J. Range Manage.
55: 488-493 September 2002
Evaluation of habitat structural measures in
ashrubland community
WADE C. HARRELL AND SAMUEL D. FUHLENDORF
Authors are Graduate Assistant and Associate Professor at Oklahoma State University, Department of Plant and Soil Sciences, Stillwater, Okla.74078-6028.
Abstract
Accurate and efficient monitoring of habitat structure on rangelands is important for understanding wildlife responses to land management practices. Unfortunately, studies of wildlife responses to changes in habitat structure often use monitoring techniques that fail to measure variation in multiple structural dimensions. Our objectives were to evaluate relationships
between measures of habitat structure in a shrubland community and to discuss the usefulness of several techniques in integrating multiple structural dimensions into a single index of habitat structure. We evaluated relationships between shrub cover, herbaceous cover, shrub patch number, average shrub patch
size, average vegetation height, visual obstruction across multiple strata of a profile board, cone of vulnerability, and angle of obstruction using a principle component analysis. Many of these variables were redundant with each other. Average visual obstruction estimates, using a profile board, were associated with variability in vertical structure as indicated by its association with height. Coefficients of variation for cone of vulnerability and visual obstruction were dependent upon their means and of limited use in describing horizontal patchiness. In contrast, shrub patch number was not linearly correlated with any other single measure in our analysis, and may be useful in describing horizontal patchiness. Cone of vulnerability and angle of obstruction are recently developed techniques that provided use- ful, single indices of multidimensional habitat structure. Efficient monitoring of wildlife habitat structure should employ multiple, independent techniques that measure distinct dimensions of habitat structure or a single measure that integrates multiple dimensions.
Key Words: cone of vulnerability, gallinaceous bird, sand shin- nery, vegetation structure, visual obstruction, patchiness, hetero- geneity
Resumen
El monitoreo eficiente y certero de la estructura del habitat es importante para entender la respuesta de la fauna silvestre a las practicas de manejo del terreno. Desafortunadamente los estu- dios de la respuesta de la fauna silvestre a los cambios de estruc- tura del habitat a menudo usan tecnicas de monitoreo que fra- casan en medir la variation en dimensiones estructurales multi- ples. Nuestros objetivos fueron evaluar las relaciones entre medi- das de la estructura del habitat en una comunidad de arbustivas y discutir la utilidad de varias tecnicas en integrar las dimen- siones estructurales multiples en un solo indice de estructura del habitat. Con el use del analisis de componentes principales eval- uamos las relaciones entre la cobertura de arbustos, la cobertura de herbaceas, el numero de parches de arbustos, el tamano promedio de los parches de arbustos, la altura promedio de la vegetation, la obstruccion visual a traves de los estratos multi- ples de un perfil amplio, el cono de vulnerabilidad y le angulo de obstruccion. Muchas de estas variables fueron redundantes unas con otras. Las estimaciones promedio de la obstruccion visual, usando un perfil amplio, estuvieron asociadas con la vari- abilidad en la estructura vertical, tal como to indico su aso- ciacion con la altura. Los coeficientes de variation para la vul- nerabilidad del cono y la obstruccion visual fueron dependientes de sus medias y de use limitado en describir los parches horizon- tales. En contraste, en nuestro analisis, el numero de parches de arbustos no estuvo linealmente correlacionado con ninguna otra de las medidas y puede ser util en describir la distribution hori- zontal de los parches. El cono de vulnerabilidad y el angulo de obstruccion son tecnicas recientemente desarrolladas que proveen indices sencillos de la estructura multidimensional del habitat. El monitoreo eficiente de la estructura del habitat de la fauna silvestre debe emplear multiples tecnicas independientes que midan distintas dimensiones de la estructura del habitat o una sola medida que integre las dimensiones multiples.
Monitoring techniques are critical for evaluating the ecological effects and efficacy of rangeland management practices. Many measures of vegetation structure have been developed on range- lands as an index of rangeland productivity (Robel 1970, Ganguli et al. 2000, Vermeire and Gillen 2001). The conservation of sen-
Approved for publication by the Director, Oklahoma Agricultural Experiment Station and funded by the Oklahoma Agricultural Experiment Station and U. S.
Forest Service. We thank Drs. T. G. Bidwell, F. S. Guthery, and M. W. Palmer for reviewing drafts of the manuscript. We also thank R. N. Chapman, K. Suedkamp, and T. R. Tunnell for field assistance.
Manuscript accepted 24 Oct. 01.
sitive wildlife species, such as grouse in western North America, has elevated the importance of monitoring wildlife habitat on rangelands (Applegate and Riley 1998, Nelle et a1. 2000).
Quantifying vegetation structure is crucial to identifying wildlife habitat (Rotenberry and Wiens 1980, Schulte and Niemi 1998, Sutter and Brigham 1998). Vegetation structure has been identi- fied as a key habitat feature for gallinaceous birds in particular (Guthery 1996). Habitat structure affects animal species composi- tion and abundance directly through mechanical effects such as providing nesting cover (Townsend et al. 2001) and indirectly through changes in microclimate (Bell et al. 1991). However, precise definitions of habitat structure are difficult to obtain.
488 JOURNAL OF RANGE MANAGEMENT 55(5) September 2002
Many papers focused on wildlife habitat avoid definitions of habitat structure entirely or in part because of confusion over relationships between typical mea- sures of structure (Verner et al. 1986).
Other studies simply define it in terms of juxtaposition of vegetation features to explain habitat structure (Bookhout 1994).
Guthery (1996) stated that "structure
refers to the height, density, biomass, and dispersion of herbaceous and woody vege- tation." Rotenberry and Wiens (1980) defined habitat structure as the physical configuration of a terrestrial environment provided by vegetation. Some attempts to define habitat structure describe 2 dimen- sions, vertical and horizontal, which dic- tate this physical configuration of vegeta- tion in space (Smith 1986). However, explanations of the relationships between horizontal and vertical dimensions of habi- tat structure have been imprecise, and there is little information evaluating the appropriateness of individual measure- ment techniques in consolidating these dimensions (Rotenberry and Wiens 1980).
Techniques used to monitor habitat structure are diverse, and minimal descrip- tions of relationships between different techniques often result in redundant habi- tat evaluations. Traditional sampling tech- niques, such as line-intercept methods, often focus on estimates of cover provided by various plant functional groups, which are often well correlated with structure (Bonham 1989). Tools, such as profile boards and Robel poles (Robel et al.
1970), can provide measures of structure in different vegetation communities by estimating visual obstruction (Guthery et al. 1981). Coefficients of variation of these techniques are often used as indica- tors of horizontal heterogeneity (Roth 1976, Madden et al. 1999). Other approaches to measuring horizontal het- erogeneity, such as landscape level inves- tigations, focus on variably-scaled spatial patterns in communities (McGarigal and McComb 1995). Recently, a 3-dimension- al technique, the cone of vulnerability (Kopp et al. 1998), was developed in an attempt to collapse infinitely diverse struc- tural features into a single index (F. S.
Guthery, Okla. State Univ., pers. com- mun.). All of these techniques vary as to the dimension and proportion of variation in habitat structure explained, yet few studies have evaluated the relationships between different approaches. Further- more, it is important to search for sam- pling techniques that measure multiple dimensions and integrate them into a sin- gle index of habitat structure (Rotenberry
and Wiens 1980). Our objectives were to:
(1) evaluate relationships between mea- sures of habitat structure in a shrubland community, and (2) discuss the usefulness of several techniques in integrating multi- ple structural dimensions into a single index of habitat structure.
Materials and Methods
Study Area
Study sites were located on the Black Kettle National Grasslands (BKNG) in Roger Mills County, Okla. and adjacent private land in Hemphill County, Tex.
(35°37'N, 100°40'W). Sample sites were chosen within available sand shinney oak (Quercus havardii Rydb.) communities.
Sites on the National Grasslands had pre-
scribed fire histories ranging from unburned to burned within 1 growing sea- son prior to sampling. Private land had a history of herbicide applications to reduce shrub cover. This variable management history led to a wide range of structural variation among sites.
Sand shinnery communities are the largest of the oak (Quercus spp.) commu- nities found in the United States, occupy- ing about 2-3 million ha in the southern Great Plains (Peterson and Boyd 1998).
These oak communities are only 0.25-1.5 m tall and are classified as shrublands.
Sand shinnery oak is the dominant species, with sand sagebrush (Artemisia filifolia Torr.) codominating. Common grasses include sand bluestem (Andropogon ger- ardii var. paucipilus Nash), little bluestem (Schizachyrium scoparium Nash), and sideoats grama (Bouteloua curtipendula Ton.). Nomenclature follows Hatch et al.
(1990). Sand shinnery communities sup- port a wide variety of wildlife species including mule deer (Odocoileus hemionus Rafinesque), white-tailed deer
(0. virginianus Boddaert), pronghorn antelope (Antilocapra americana Ord), peccary (Dicotyles tajacu L.), lesser prairie-chickens (Tympanuchus pal-
lidicinctus Ridgeway), northern bobwhites (Colinus virginianus L.), Rio Grande turkeys (Melagris gallopavo intermedia L.), mourning doves (Zenaida macroura L.), and various species of songbirds, lagomorphs, rodents, reptiles, and inverte- brates (Peterson and Boyd 1998).
All sites sampled were grazed by cattle at 1.5 ha/AUM. The BKNG is not contigu- ous, but consists of a series of land frag- ments ranging in size from 10 to 500 ha (Burgess et al. 1963). The climate of the region is semiarid, with mean August and
January temperatures of 28.0 and 2.7° C, respectively. The area has an average growing season of 209 days and average annual precipitation of 65 cm (Burgess et al. 1963). Precipitation is highly variable and bimodally distributed with peaks in
May--June and August-September.
Topography of the area consists of rolling hills, with elevation ranging from 518 to 793 m above sea level.
Sampling Methods
We measured habitat structure during the growing seasons (June-August) of 1998 and 1999. Eighty-four, 100-m line transects were used to measure canopy cover of woody and herbaceous plants (Bonham 1989). Since shrubs were the dominant vegetation cover type, shrub cover was measured as an absolute value along the transect, with herbaceous cover recorded only in the absence of shrub cover. Minimum resolution used to define plant functional group cover along the transect was 10 cm. This sampling resolu- tion was used so that fine-scale changes in structure that may be important to some wildlife species could be detected. Shrub patch number (#1100 m) and average size of shrub patches (cm) were determined from the line transect data by summing the number of distinct shrub patches and aver- aging their linear lengths. Distinct shrub patches could be as small as 10 cm and were defined as continuous shrub cover if there were no canopy breaks greater than 10 cm. Vegetation height was measured every 1 m along the transect. If no vegeta- tion was present at that point, height was
recorded as 0. We estimated visual obstruction every 10 m along the transect using a profile board as described by Nudds (1977) and modified for sand shin- nery communities by Guthery et al.
(1981). The 6.8-cm wide profile board had 12 strata, each stratum being 10 cm tall.
Estimates were taken perpendicular to the line transect at a distance of 7 m, with the observer kneeling at a height of 1.5 m over the transect. Percent visual obstruction was estimated for each stratum.
We measured the cone of vulnerability (Kopp et al. 1998) every 10 m along the transects. The cone of vulnerability is a 3-
dimensional view of visual obstruction and has been identified as a measure that quantifies habitat structure important for northern bobwhites (Kopp et al. 1998).
We assessed the cone of vulnerability by measuring angles in 8 directions (N, NE, E, SE, S, SW, W, NW) from a point locat- ed 10 cm above the ground to the top of the nearest obstructing vegetation. We
JOURNAL OF RANGE MANAGEMENT 55(5) September 489
several meaningful variables, verify our PCA, and obtain probability values. We determined the best-fit line by choosing the model that maximized the r2 and mini- mized MSE.
Results
I
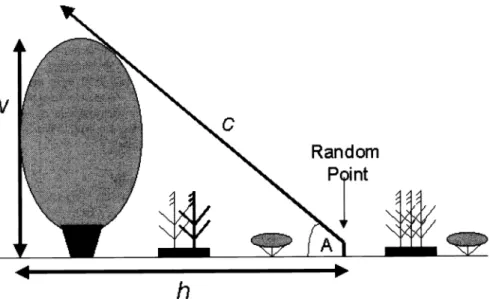
nFig. 1. Depiction of measurement components to determine cone of vulnerability (an integra- tion of vertical and horizontal dimensions of habitat structure) where: v = height of obstruction (vertical structure), h = distance from random point to base of obstruction (horizontal structure), c = line used to determine angle of obstruction, A = angle of obstruc- tion (aresine h/c). Adapted from Kopp et al. (1998).
considered the average of the 8 angles for each point to be the angle of obstruction.
We then used the angle of obstruction to calculate the volume of the air space included within a cone (Kopp et al. 1998).
A larger cone of vulnerability equates to a structurally more open habitat. The angle of obstruction used in determining the cone of vulnerability is formed by 2 basic components, height of nearest obstructing plant and distance from the point of mea- sure to the plant (Fig. 1). These compo- nents suggest the potential of this measure to integrate the vertical and horizontal dimensions of habitat structure.
Statistical Analysis
We conducted a principal components analysis (PCA) on data from 84 transects using CANOCO software (Ter Braak and Smilauer 1998) to assess the relationships among the structural measures, identify structural variables that were redundant, and determine the percent of structural variation explained by various measures of habitat structure. The variables for each transect included in the PCA were shrub cover, herbaceous cover, mean cone of vulnerability, mean angle of obstruction, mean shrub patch size, shrub patch num- ber, mean vegetation height, percent visu- al obstruction of stratum 1 through stra- tum 12, the mean of all visual obstruction values, and the coefficient of variation (CV) for the cone of vulnerability, angle of obstruction, height, and visual obstruc- tion measures. We analyzed the cone of vulnerability and angle of obstruction sep-
arately to determine if the conversion from an angle to a volume had an effect on their relationship to other measures. Matrix scaling in the PCA focused on inter-vari- able correlations, with all variables cen- tered and standardized. Correlations using linear and second order polynomials were used to further explore relationships of
Variability within our data was reflec- tive of the diverse management histories present at our study sites. Mean shrub cover was 50% (4 to 86%). Mean average height of vegetation along each transect was 38 cm (13 to 88 cm). Mean shrub patch number was 951100 m (13 to 166/100 m). Mean cone of vulnerability was 0.667 m3 (0.019 to 1.782 m3).
Variation in structure explained by PCA axis 1 and PCA axis 2 was 57.9 and 17.4%, respectively, resulting in a cumula- tive total of 75.3%. Axes 3 and 4 of the PCA explained less than 10% of the varia- tion using the variables that we measured.
Measures typically associated with verti- cal structure, such as mean visual obstruc- tion and mean vegetation height, had high component scores on PCA axis 1 and rela- tively low component scores on PCA axis 2 (Table 1). Variables that were associated with PCA axis 1 and PCA axis 2 included mean cone of vulnerability, cone of vul- nerability CV, mean angle of obstruction, angle of obstruction CV, mean shrub patch
Table 1. Component scores and correlation coefficients of habitat structural variables for sand shinnery communities in Oklahoma and Texas, 1998-1999. Component scores reflect degree of correlation with vertical (axis 1) and horizontal (axis 2) habitat structure represented by 2 orthogonal axes of a principal component analysis (PCA).
Habitat Variable
PCA Axis 1
Scores
Axis 2
Scores Cover (r)
Patch Number (r)
Shrub cover 0.840** -0.340**
Herbaceous cover -0.765** 0.245*
Height 0.886** 0.112
Height (CV) -0.312** 0.449**
Cone of vulnerability -0.864** 0.387**
Cone of vulnerability (CV) 0.822** -0.167
Angle of obstruction 0.881** -0.351**
Angle of obstruction (CV) 0.679** 0.390**
Visual obstruction 0.955** 0.252*
Visual obstruction (CV) -0.516** 0.478**
Stratum 1 0.441** 0.468**
Stratum 2 0.612** -0.478**
Stratum 3 0.810** -0.407**
Stratum 4 0.892** -0.297**
Stratum 5 0.921** -0.062
Stratum 6 0.918** 0.170
Stratum 7 0.862** 0.398**
Stratum 8 0.822** 0.507**
Stratum 9 0.784** 0.582**
Stratum 10 0.739** 0.611**
Stratum 11 0.709** 0.605**
Stratum 12 0.676** 0.584**
Shrub patch size 0.790** 0.189
Shrub patch number 0.125 0.655**
P< 0.01, *P< 0.05
490 JOURNAL OF RANGE MANAGEMENT 55(5) September 2002
visual obstruction (CV) ° °
k, height (CV) angle of obstruction (CV) R
cone of vulnerability
herbaceous cover, `~ _ ~o
.° °- N
U)
0
+1.0
PCA Axis 1
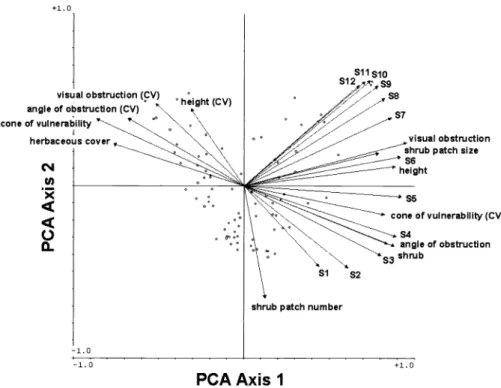
Fig. 2. Principal components analysis of vertical and horizontal structural relationships among habitat variables for sand shinnery communities in Oklahoma and Texas, 1998-1999. Arrows pointing opposite of one another depict negative relationships, arrows pointing in the same direction depict positive relationships, and arrows at right angles depict orthogonality. Strata 1-12 (51- 512) represent individual stratum along a profile board from ground level to 120 cm at 10-cm intervals. Shrub refers to cover.
size, shrub cover, herbaceous cover, and strata 3-11 of the profile board (Table 1, Fig. 2). Most of these structural measures were highly correlated with each other (Table 1).
Shrub cover had high positive correla- tions with mean shrub patch size, mean veg- etation height, cone of vulnerability CV, mean angle of obstruction, and strata 3-5 of the profile board (Table 1). Mean cone of vulnerability, angle of obstruction CV, and herbaceous cover had high negative correla- tions with shrub cover (Table 1). The CVs for angle of obstruction and cone of vulner- ability had a strong negative correlation (r = -0.737, P < 0.01; r = -0.837; P < 0.01) which indicated disagreement with each other as to the spatial variability within this community.
Shrub patch number had the highest com- ponent score on PCA axis 2 and low linear correlations with the other variables in our analysis (Table 1). When a second order polynomial regression was applied, shrub patch number had a quadratic relationship with shrub cover (Fig. 3). Shrub cover, herbaceous cover, angle of obstruction, cone of vulnerability, and strata 7-11 of the profile board had relatively high component scores for both axes which indicated these variables may be correlated with more than
1 dimension of structure (Table 1, Fig. 2).
Discussion
Past studies have either failed to identify the dimension (vertical or horizontal) of vegetation structure measured or have measured structure in a single dimension (Haensly et al. 1987, Goguen and Mathews 1998, McKee et al. 1998). For clear and efficient descriptions of habitat structure, multiple measures of habitat structure should be independent and measure dis- tinct structural attributes. When single measures are used, it is important that they integrate multiple dimensions. Our data suggested that many commonly used mea- sures of habitat structure are redundant.
Many measures in our analysis were relat- ed to vertical structure, as indicated by their association with height in the PCA.
Several of the measures evaluated in this study, such as cone of vulnerability, angle of obstruction, and the profile board, have the potential to integrate vertical and hori- zontal structure into a single index of habi- tat structure.
Horizontal structure is often defined in terms of habitat patchiness or porosity (Forman and Godron 1986, Bell et al.
1991). Patchiness is often a more accurate predictor of bird species diversity than vertical variability (MacArthur et al. 1962, Roth 1976). Shrub patch number and stra-
ta 8-12 of the profile board explained the most variation on axis 2, were not strongly correlated with other measures, and may be the best indicators of horizontal vari- ability in these shrubland communities.
Shrub patch number was the least redun- dant measure in our analysis, indicating that this measure may be useful in future assessments. Physical characteristics of vegetation, such as shrub patch number, that measure attributes related to horizon- tal structure are often evaluated at the landscape level (Forman and Godron 1986, McGarigal and McComb 1995), but rarely at a habitat-patch level as we did in our study.
Coefficient of variation for height or visual obstruction has been used as a mea- sure of horizontal patchiness (Roth 1976, Madden et al. 1999). However, coefficient
of variation only measures variation around a mean, rather than spatially explicit horizontal variation such as that measured with shrub patch number. In fact, the cone of vulnerability CV suggests that the greatest amount of horizontal vari- ability occurred at high levels of shrub cover, whereas the angle of obstruction CV indicated that the greatest horizontal variability occurred at low levels of shrub cover. The discrepancy between these CVs occurs because of the formulas required to convert the angle of obstruc- tion into an area-based measure. The means of these measures are also nega- tively correlated, indicating that patterns of the CVs are indeed dependent upon the mean and of limited use in describing hor- izontal patchiness. In contrast, relation- ships of shrub patch number with shrub cover, as well as landscape-level models, suggest that the greatest amount of hori- zontal variability should occur at interme- diate levels of shrub cover (Fig. 3; Hargis et a1,1997).
Estimating visual obstruction using den- sity or profile boards with multiple strata has been employed as a method to quanti- fy structural density of vegetation. Our data suggested that average visual obstruc- tion, which is frequently used as a single index of habitat structure (Nudds 1977, Guthery et al. 1981, DeFazio et al. 1988), is redundant with height; and therefore, was interpreted primarily as a measure of vertical structure. However, examining the 12 individual strata of the profile board independently gave a wide range of infor- mation, which was not gained from any other measure. An important limitation in quantifying vegetation structure using visual obstruction is associated with data analysis. To analyze data from a profile
JOURNAL OF RANGE MANAGEMENT 55(5) September 491
100
cD U)
0 I,
63
E 00
z
0
63 00 40 20
(1)
y= -O.05x2 +4.85x -15.69 R2 = 0.67
0
S S
f
S S
S
S S
20
i
S
*
S55
* S * * S S S S
40
i_____.. S S S
4
f S
00
S S
00
Shrub Over (%)
Fig. 3. Quadratic relationship between shrub patch number and percent shrub cover from 84 line transects in sand shinnery communities of Oklahoma and Texas, 1998-1999. Shrub patch number and shrub cover were taken at 10-cm intervals along 100-m line transects.
board without violating statistical assump- tions of independence, each stratum should be considered dependent on the lower strata. This results in a complex vector of interdependent variables instead of a single univariate index of vertical and horizontal structure.
The angle of obstruction and cone of vulnerability are recently developed tech- niques that have potential to integrate mul- tiple dimensions of habitat structure. Cone of vulnerability is calculated from the angle of obstruction (A), which is a func- tion of plant height (v) and the ground dis- tance (h) of the plant from a point in space, indicating that it is a direct mathe- matical integration of vertical and horizon- tal dimensions of habitat structure (Fig. 1).
The PCA supported this, suggesting that the cone of vulnerability and angle of obstruction were correlated with both axes. A recent model suggests that an ideal landscape for northern bobwhites would be comprised of an average cone of vulnerability of 0.691 m3, shrub cover of 53%, and relatively high variability (CVs
>50%) (Kopp et al. 1998). A technique, such as the cone of vulnerability or angle of obstruction, that integrates multiple components of habitat structure could be used as a measure of overall structural het- erogeneity in shrubland communities, but the coefficient of variation may be of little
added value.
Various habitat management practices influence the vertical and horizontal dimensions of vegetation structure differ- ently, yet studies often measure only a sin- gle dimension of structure. Choosing mul- tiple techniques that are not redundant with each other and measure distinct
dimensions of habitat structure or a single measure that integrates multiple dimen- sions is crucial in the design of efficient monitoring studies. The cone of vulnerabili- ty and angle of obstruction appear to effec- tively integrate multiple dimensions of habi- tat structure in sand shinnery communities.
Individual strata along a profile board also provided information about multiple struc- tural dimensions. Shrub patch number pro- vided data that was not related to other mea- sures in our analysis, and would be useful in future habitat evaluations.
Literature Cited
Applegate, R.D. and T.Z. Riley.1998. Lesser prairie-chicken management. Rangelands 20:13-15.
Bell, S.S., E.D. McCoy, and H.R. Mushinsky.
1991. Habitat structure: the physical arrange- ment of objects in space. Chapman and Hall, New York, N.Y.
Bonham, C.D. 1989. Measurements for terres- trial vegetation. John Wiley and Sons, New York, N.Y.
Bookhout, T.A. 1994. Research and manage- ment techniques for wildlife and habitats, fifth ed. The Wildl. Soc., Bethesda, Md.
Burgess, DL., JD. Nichols, and O.G. Henson.
1963. Soil survey of Roger Mills County, Oklahoma. USDA Soil Conserv. Serv., Washington, D.C.
DeFazio, J.T., AE. Stone, and RJ. Warren.
1988. Effects of tebuthiuron site preparation on white-tailed deer habitat. Wildl. Soc. Bull.
16:12-18.
Forman, R.T.T. and M. Godron. 1986.
Landscape ecology. John Wiley and Sons, New York, N.Y.
Ganguli, A.C., L.T. Vermeire, R.B. Mitchell, and M.C. Wallace. 2000. Comparison of four nondestructive techniques for estimating standing crop in shortgrass plains. Agron. J.
92:1211-1215.
Goguen, CB. and N.E. Mathews. 1998.
Songbird community composition and nest- ing success in grazed and ungrazed pinyon-
juniper woodlands. J. Wildl. Manage.
62:474-484.
Guthery, F.S. 1996. Upland gamebirds, p.
59-69. In: P. R. Krausman (ed.), Rangeland wildlife. Soc. for Range Manage., Denver, Colo.
Guthery, F.S., T.B. Doer, and M.A. Taylor.
1981. Use of a profile board in sand shinnery oak communities. J. Wildl. Manage.
34:157-158.
Haensly, T.F., J.A. Crawford, and S.M.
Meyers.1987. Relationships of habitat struc- ture to nest success of ring-necked pheasants.
J. Wildl. Manage. 52:421-425.
Hargis, C.D., J.A. Bissonette, and J.L.
David. 1997. Understanding measures of landscape pattern, p. 231-261. In: J. A.
Bissonette (ed.), Wildlife and landscape ecol- ogy: Effects of pattern and scale. Springer- Verlag, New York, N.Y.
Hatch, S. L., K. N. Gandhi, and L. E. Brown.
1990. Checklist of the Vascular Plants of Texas. Texas Agr. Exp. Sta. MP-1655, College Station, Tex.
Kopp, S. D., F. S. Guthery, N. D. Forrester, and W. E. Cohen. 1998. Habitat selection modeling for northern bobwhites on subtrop- ical rangeland. J. Wildl. Manage.
62:884-902.
Madden, E.M., A.J. Hansen, and R.K.
Murphy. 1999. Influence of prescribed fire history on habitat and abundance of passerine birds in northern mixed-grass prairie. Can.
Field Nat. 113:627-640.
McArthur, R.H., H.J. MacArthur, and J.
Preer. 1962. On bird species diversity II:
Prediction of bird census from measure- ments. Amer. Nat. 96:167-174.
McGarigal, K. and W.C. McComb. 1995.
Relationships between landscape structure and breeding birds in the Oregon Coast Range. Ecol. Monogr. 65:235-260.
McKee, G.M., R. Ryan, and L.M. Mechlin.
1998. Predicting greater prairie-chicken nest success from vegetation and landscape char- acteristics. J. Wildl. Manage. 62:314-321.
492 JOURNAL OF RANGE MANAGEMENT 55(5) September 2002
Nelle, P.J., K.P. Reese, and J.W. Connelly.
2000. Long-term effects of fire on sage grouse habitat. J. Range Manage.
53:586-591.
Nudds, T.D. 1977. Quantifying the vegetative structure of wildlife cover. Wildl. Soc. Bull.
5:113-117.
Peterson, R.S. and C.S. Boyd. 1998. Ecology and management of sand shinnery oak com- munities: A literature review. USDA For.
Serv. Gen. Tech. Rep. GTR-16. Washington, D.C.
Robel, R.J., J.N. Briggs, A.D. Dayton, and L.
C. Hulbert. 1970. Relationships between visual obstruction measurements and weight of grassland vegetation. J. Range Manage.
23:295-297.
Rotenberry, J.T. and J.A. Wiens. 1980.
Habitat structure, patchiness, and avian com- munities in North American steppe vegeta- tion: a multivariate analysis. Ecol.
61:1228-1250.
Roth, R.R. 1976. Spatial heterogeneity and bird species diversity. Ecol. 57: 773-782.
Schulte, L.A. and G.J. Niemi. 1998. Bird communities of early-successional burned and logged forest. J. Wildl. Manage.
64:1418-1429.
Smith, R.L. 1986. Elements of ecology, second ed. Harper and Row, New York, N.Y.
Sutter, G.C. and R.M. Brigham. 1998.
Avifaunal and habitat changes resulting from conversion of native prairie to crested wheat- grass: Patterns at songbird community and species levels. Can. J. Zool. 76:869-875.
Ter Braak, C.J.F., and P. Smilauer. 1998.
CANOCO Reference manual and user's guide to canoco for windows: Software for canonical community ordination, ver. 4.
Microcomputer Power, Ithaca, N.Y.
Townsend, D.E. II, R.E. Masters, R.L.
Lochmiller, D.M. Leslie Jr., S.J. Demaso, and A.D. Peoples. 2001. Characteristics of nest sites of northern bobwhites in western Oklahoma. J. Range Manage. 54:260-264.
Vemeire, L.T. and R.L. Gillen. 2001. Esti- mating herbage standing crop with visual obstruction in tallgrass prairie. J. Range Manage. 54:57-60.
Verner, J., M.L. Morrison, and C.J. Ralph.
1986. Wildlife 2000: modeling habitat rela- tionships of terrestrial vertebrates. Univ.
Wisconsin Press, Madison, Wisc.
Your one stop supplier for:
Pasture and range grasses Alfalfa, shrubs, & wildflowers Custom seed blends
Erosion control materials
4jonmentaI consulting
CSy'S:.
JOURNAL OF RANGE MANAGEMENT 55(5) September 493