J. Range Manage.
55: 360-366 July 2002
Elk and cattle forage use under a specialized grazing system
LACEY E. HALSTEAD1, LARRY D. HOWERY, GEORGE B. RUYLE, PAUL R. KRAUSMAN, AND ROBERT J. STEIDL
Authors are former Graduate Research Assistant, Associate Professor and Range Management Specialist, Professor and Range Management Specialist, Professor, and Assistant Professor, School of Renewable Natural Resources, The University of Arizona, Tucson, Ariz. 85721. 'Current address: The Nature Conservancy of Texas, P.O. Box 1440, San Antonio, Tex. 78295-1440.
Abstract
The Walker Basin Allotment grazing system in central Arizona is designed to allocate resource use under elk (Cervus elaphus L.) and cattle (Bos taurus L.) grazing. The grazing system was designed to promote biologically acceptable levels of forage use on the half of the allotment scheduled for cattle grazing and to rest the other half by attracting elk to pastures recently grazed by cattle. The objectives of our 2-year study were to determine whether the grazing system facilitated proper forage use as defined by recent forage use and residual stubble height guide- lines (i.e., 30 to 40% use and an 8- to 10-cm stubble height) and whether the system rested one half of the allotment from elk and cattle grazing. Mean (± SEM) total elk and cattle forage use for western wheatgrass (Pascopyrum smithii Rydb.), the key forage species, was 32 and 61 % ± 7 in 1997 and 1998, respectively; cor- responding mean (± SEM) stubble heights were 11 and 10 cm ± 0.6. Mean total cattle and elk forage use in 1998 (61%) exceeded the 30 to 40% use guidelines. However, mean end-of-year stubble height was never below 10 cm. The grazing system did not pro- vide half the allotment with complete rest; elk used all study pas
tures. Elk use was higher in pastures with heavier tree cover and steeper terrain in both years, regardless of where cattle grazing occurred. Elk grazing patterns were apparently more dependent on tree cover and topography than any changes in forage caused by the grazing system.
Key Words: Arizona, deferred grazing, paired-plot, rest-rota- tion, stubble height, western wheatgrass
Specialized grazing systems have been developed that use cat- tle grazing as a tool to alter forage characteristics and, thereby, modify elk (Cervus elaphus L.) distribution. Such grazing sys- tems often include elements of rest-rotation, deferment, or both (Vavra and Sheehy 1996). Improvements in forage availability, palatability, production, and/or animal performance have been suggested as advantages to using specialized grazing systems
Research was funded by a grant from The University of Arizona Agriculture Experiment Station. We acknowledge the Coconino National Forest and the Arizona Game and Fish Department for their support of this project. We would like to thank Dr. Lamar Smith and 3 anonymous reviewers for reviewing earlier drafts of this paper. We thank Matt Barnes, Alex Connley, Tom DeLiberto, Vicki Gempko, Arlo Halstead, Elizabeth Howery, Dan Koepke, and Dave Womack for assistance in the field and laboratory.
Manuscript accepted 19 Sept. 01.
Resumen
El sistema de asignacion del apacentamiento de la cuenca Walker, en la parte central de Arizona, esta disenado para asig-
nar el use de los recursos bajo el apacentamiento de alces (Cervus elaphus L.) y ganado bovino (Bos taurus L.). El sistema de apacentamiento se diseiio para promover niveles biologica- mente aceptables de utilizacion de forraje en la mitad del terreno programado para el ganado bovino y descansar la otra mitad mediante la atraccion de los alces a potreros recenn apacentados por bovinos. Los objetivos de nuestro estudio, de 2 aiios de duracion, fueron determinar si el sistema de apacentamiento facilito el use adecuado del forraje tal como to definen los lin- eamientos recientes de use de forraje y altura del rastrojo (esto es, 30 a 40% de use y 8 a 10 cm de altura del restrojo) y si el sis- tema descanso del alce y bovinos una de las mitades de la asi- gnacion. La media (± EEM) de use total de forraje por alces y bovinos para el "Western wheatgrass" (Pascopyrum smithii Rydb.), la especie cave, fue 32 y 61% ± 7% en 1997 y 1998 respectivamente, y la medias correspondientes (± EEM) para la atura del rastrojo fueron 11 y 10 cm ± 0.6. En 1998, la media total de use de forraje por alces y bovinos (61%) excedio el 30 a 40% de use establecido en los lineamientos. Sin embargo, la media de altura del rastrojo al final del aiio nunca fue menor a 10 cm. El sistema de apacentamiento no proveyo un descanso completo para la mitad del terreno, el alce use todos los potreros bajo estudio. El use por el alce fue mayor en potreros con una densa cobertura de arboles y de terreno con pendiente, sin importar donde ocurrio el apacentamiento de los bovinos. Los patrones de apacentamiento del alce aparentemente fueron mas dependientes de la cobertura de arboles y la topografia del ter- reno que cualquier cambio en el forraje causado por el sistema de apacentamiento.
(Anderson and Scherzinger 1975, Alt et al. 1992, Wisdom and Thomas 1996). These systems may attract elk to areas recently grazed by cattle (Gordon 1988, Alt et al. 1992, Frisina 1992), or they may produce little or no change in forage production, nutri- tional content, or herbivore distribution (Lacey and Van Poolen 1981, Yeo et al. 1993, Wambolt et al. 1997).
The Walker Basin Allotment grazing system in central Arizona combines elements of rest-rotation and deferment, employing seasonal cattle grazing on half the allotment each year (United States Forest Service [USFS], unpublished Walker Basin Allotment Management Plan 1990, Camp Verde, Ariz.). The
360 JOURNAL OF RANGE MANAGEMENT 55(4) July 2002
objectives of our 2-year study were to determine whether the grazing system pro- moted target levels of forage use and residual stubble height (Holechek et al.
1998), and whether the system rested half the allotment from large ungulate her- bivory each year.
Materials And Methods Study Area
The Walker Basin Allotment (111 ° 40' 40" W, 34° 38' 30" N) is comprised of about 31,000 ha of USFS rangeland. The Walker Basin Allotment's 57 pastures are divided into 2 main sections that run west to east along an increasing elevational gra- dient. The Walker Basin Allotment has 3 seasonal ranges: winter (1,220 to 1,524 m elevation), transitional (1,525 to 1,982 m elevation), and summer (1,983 to 2,287 m elevation). Our study area (about 6,750 ha) consisted of 4 pastures (850 to 2,100 ha) on the transitional range (Fig. 1) because local resource managers identified this range as having high potential for elk and cattle competition (personal commu- nication, USFS, Arizona Game and Fish Department, and ranch managers).
Western wheatgrass (Pascopyrum
smithii Rydb.) has been identified by the USFS as the key herbaceous forage species in the study pastures (USFS, unpublished Walker Basin Allotment Management Plan 1990, Camp Verde, Arizona). Other plant species included blue grama (Bouteloua gracilis H.B.K.), sideoats grama (Bouteloua curtipendula Michx.), downy brome (Bromus tectorum L.), buckwheat (Eriogonum spp.), snake- weed (Gutierrezia sarothrae Pursh.), squawbush (Rhus trilobata Nutt.), emory oak (Quercus emoryi Ton), pinyon pine (Pinus edulis Engelm.) and juniper (Juniperus osteosperma Torr.). Soils are
predominantly classified as Vertic Haplustalfs (Terrestrial Ecosystems Survey of the Coconino National Forest 1992).
The growing season (frost-free days) on the transitional range extends from March to October. Average yearly precipitation is 33 cm, occurring primarily from December to February and July to September (National Oceanic and Atmospheric Administration 1997). Winter precipitation occurs primarily as snow. The northern pastures (1 and 2) were near an ephemeral drainage and con- tained more pinyon pine and juniper cover than the southern pastures (3 and 4).
Description of Grazing System and Herbivores
The Walker Basin Allotment grazing system is designed to promote biologically acceptable levels of forage use by cattle, elk, and other wild herbivores and to rest half of the allotment by attracting elk and other wild ungulates to pastures recently grazed by cattle (USFS, unpublished Walker Basin Allotment Management Plan 1990, Camp Verde, Ariz.). Hereford and Hereford cross-bred (Saler, Braford, Brahman, Angus, Gelbvieh) cow-calf pairs were used in this experiment and handled following the University of Arizona's Animal Care Protocol # 96-118.
During 1997, 413 cow-calf pairs were used (mean body weight = 476 kg ± 62 SD), while 450 cow-calf pairs were used in 1998 (mean body weight = 457 kg ± 87 SD). Each year, cattle were moved up the elevational gradient through pastures on one half of the allotment during the grow- ing season (about 14 days/pasture) and moved down the elevational gradient on the same half during the dormant season (about 5 days/grazed pasture). The other half of the allotment was rested from cattle grazing the entire year (i.e., rested pastures).
Seasonal cattle grazing is used to increase palatable regrowth, which is hypothesized to attract elk to pastures recently grazed by cattle, thereby resting the other half of the allotment from cattle and elk herbivory.
According to the Arizona Game and Fish Department, elk is the main wild her- bivore species that significantly impacts western wheatgrass, the key forage species used in this study. Jack rabbits (Lepus cal- ifornicus Gray), pronghorn (Antilocapra americana Ord), mule deer (Odocoileus
hemionus Rafinesque), and white-tailed deer (Odocoileus virginianus Rafinesque) are thought to use insignificant amounts of western wheatgrass compared with elk and cattle due to lower animal numbers or dietary differences (Thomas Britt, Regional Supervisor, Arizona Game and Fish Department, personal communica- tion, Vavra et al. 1989). Thus, our research focused on elk and cattle impacts on west- ern wheatgrass.
General Sampling Procedures The study was conducted from March 1997 to October 1998. We estimated for- age use by elk and cattle and residual stub- ble height during 2 growing seasons. The southern pastures (3 and 4) were grazed by cattle in 1997 and the northern pastures (1 and 2) were grazed by cattle in 1998 as required by the USFS grazing manage- ment plan (Fig. 1). Average stocking rates for cattle, calculated using definition `a' of the Glossary Revision Special Committee report (1989), were 5.1 and 6.9 ha/AUM during 1997 and 1998, respectively (Fig.
1). All pastures were accessible to elk dur- ing the entire study.
Paired-plot and stubble height tech- niques (Interagency Technical Reference 1996) were used to evaluate grazing of western wheatgrass in 12 randomly select- ed 3-ha sampling areas (3/pasture). Each sampling area was located >_ 0.4 km from well-traveled roads, fences, and water and
> 0.3 km from adjacent sampling areas.
Sampling areas contained 6 paired-plot units. Each paired-plot unit consisted of 1
protected macroplot (1.7-m2 grazing exclosure), and two, 1.7-m2 unprotected macroplots, for a total of 72 protected and
NT
Pasture 1 Pasture 2
Grazed by cattle 1998 Grazed by cattle 1998
(2100 ha) (1900 ha)
Pasture 3 Pasture 4
Grazed by cattle 1997 Grazed by cattle 1997
(850 ha) (1900 ha)
Fig. 1. Study pasture layout on the Walker Basin Allotment, central Arizona. Cattle grazed southern pastures (3 and 4) JunJJul. and Nov. of 1997, and northern pastures (1 and 2) Jun./Jul. and Nov. of 1998. Elk had access to study pastures year-round.
JOURNAL OF RANGE MANAGEMENT 55(4) July 361
144 unprotected plots in the study area (i.e., 72 paired-plot units). Two unprotect- ed macroplots, rather than the traditional 1, were matched with each protected macroplot to account for possible patch grazing by cattle and elk (Klingman et al.
1943, Grelen 1967). Unprotected and pro- tected macroplots were matched based on similar ocular estimates of western wheat- grass phytomass. Each sampling area also contained a 400-m stubble height transect located between protected and unprotected macroplots and >_ 10 m from protected macroplots.
To avoid attracting animals to protected plots within sampling areas, each protect- ed plot was >- 100 m from the others.
Protected and unprotected plots were >- 50 m apart, and unprotected plots within a
paired-plot unit were >- 10 m apart. To minimize bias due to enhanced growth within protected plots, new paired-plot units were established in March each year (Owensby 1969). Before initially estab- lishing paired-plot units, we tested the pre- cision of ocular matching by clipping, dry- ing, and weighing western wheatgrass from 29 pairs of 0.25-m2 circular plots that were later used to clip subsamples within paired-plot units. A paired t-test revealed no difference between paired test plots (P
> 0.2, a = 0.05). The same observer
always established paired-plot units.
We estimated forage use and stubble height in each pasture in 3 sampling peri- ods: 1) immediately before cattle entered grazed pastures, 2) immediately after cat- tle exited grazed pastures, and 3) at the end of the growing season, about 3-4
months after cattle exited grazed pastures (Fig. 2 and Fig. 3; Tables 1 and 2).
Measurements made before cattle grazed (early/mid-June) estimated relative elk use in all pastures. Measurements made after cattle grazed (mid-June/early July) esti- mated relative cattle and/or elk use, while measurements made at the end of the growing season (mid-October) estimated total forage use for the entire growing sea- son (cattle and/or elk). Relative use describes the amount of forage consumed or destroyed up to a certain time during the growing season but prior to peak standing crop (e.g., June or July; Frost et al. 1994). Total forage use is "the propor- tion of current year's forage consumed or destroyed by grazing animals," measured at the end of the growing season (Glossary Revision Special Committee 1989). Cattle grazed study pastures about 5 days in mid- November (dormant season), and elk migrating to winter ranges likely used study pastures at this time. However, we
Table 1. Mean relative and total western wheatgrass forage use (%) under 2 treatments (elk graz- ing and elk/cattle grazing) across 3 sampling periods on the Walker Basin Allotment, central Arizona, 1997/1998 (SEM = 7).
Sampling period'
Before cattle After cattle End of
Year/Grazing animal2 Pasture grazing season
---(%)---
1997
Elk 1 and 2 28
Elk and cattle 3 and 4 14
1998
Elk and cattle 1 and 2 28
Elk 3 and 4 13
'Before cattle grazing = relative forage use, early/mid-Jun.; After cattle grazing = relative forage use, mid-Jun./early Jul.; End of growing season, or 3 to 4 months after cattle exited grazed pastures = total forage use, mid-Oct.
Year and grazing animal main effects were significant and are reported in the Results section and Figs. 2a,2b.
did not measure dormant season grazing because of snow depth.
Paired-plot Sampling
For each sampling period, we clipped western wheatgrass from 2 randomly selected paired-plot units in each sampling area within each pasture for a total of 24
paired-plot samples. All plots were clipped to ground level. During 1997, we used a 0.25-m2 circular frame to clip 4 subplots within each 1.7-m2 macroplot.
We averaged the 4 subplot dry weights to obtain 1 mean protected weight for each protected macroplot. For the 2 correspond- ing unprotected macroplots, we averaged the 8 subplot dry weights (4 subplots x 2 macroplots) to obtain 1 mean unprotected weight. Percentage use for a paired-plot unit was the ratio of the mean unprotected and protected weights. Negative utilization values from paired-plot units were zeroed (Werner and Urness 1998). Mean use for a sampling area was calculated from the 2 randomly selected paired-plot units. Mean use for each pasture treatment (grazed or rested) was calculated across the appropri-
ate 6 sampling areas for each sampling period (Table 1).
In 1998, we altered our paired-plot sam- pling procedure slightly to address the high range of variability of 1997 use esti- mates between paired-plot units within sampling areas (SE range = 0-35). For each paired-plot unit in 1998, we ocularly matched three, 0.25-m2 subplots within the protected macroplot to three, 0.25-m2 sub- plots within each of the 2 unprotected macroplots, creating 3 individually matched subsamples in each paired-plot unit. Percentage use for a matched sub- sample was the ratio of dry weights clipped from the 2 unprotected 0.25-m2 subplots (averaged) and the corresponding 0.25-m2 protected subplot. Percentage use for a paired-plot unit was the mean of the 3 matched subsample use estimates.
Means for sampling areas and pastures were calculated as described in 1997. We calculated western wheatgrass standing crop dry weight (kg ha 1) from protected macroplots each sampling period during both years of the study.
Table 2. Mean western wheatgrass residual stubble height (cm) under 2 treatments (elk grazing and elk/cattle grazing) across 3 sampling periods on the Walker Basin Allotment, central Arizona, 1997/1998 (SEM = 0.6).
Sampling period'
Before cattle After cattle End of
Year/Grazing animal2 Pasture grazing season
---(cm)---
1997
Elk 1 and 2 12
Elk and cattle 3 and 4 13
1
Elk and
cattle grazing = relative forage use, early/mid-Jun.; After cattle grazing = relative forage use, mid-Jun./early Jul.; End of growing season, or 3 to 4 months after cattle exited grazed pastures = total forage use, mid-Oct.
Year and grazing animal main effects were significant and are reported in the Results section and Figs. 3a,3b.
362 JOURNAL OF RANGE MANAGEMENT 55(4) July 2002
60
50
10
0 50
10
60- 0
B
Before cattle grazing
Cattle and Elk Elk
--1 01997
T 11998
After cattle grazing End of growing season Sampling period*
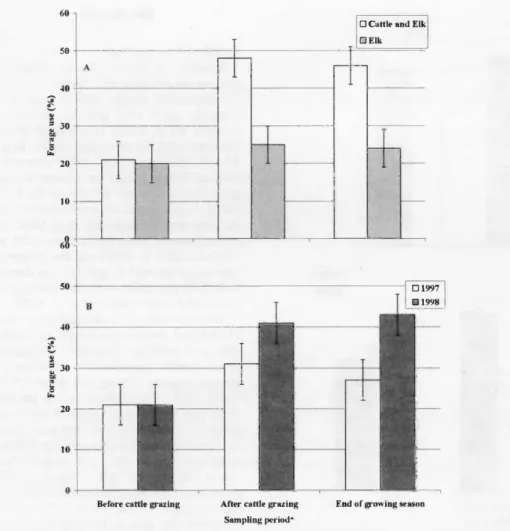
Fig. 2. Grazing animal (A) and year (B) effects on relative and total western wheatgrass for- age use (%) across 3 sampling periods on the Walker Basin Allotment, central Arizona (SEM = 5). * Sampling periods were: Before cattle grazing = relative forage use, early/mid- Jun.; After cattle grazing = relative forage use, mid-Jun./early Jul.; End of growing season, or 3 to 4 months after cattle exited grazed pastures = total forage use, mid-Oct.
Stubble Height Sampling
Stubble height sampling methodology was the same in both years. For each sam- pling period, the average height of 60 indi- vidual western wheatgrass plants was measured (Interagency Technical Reference 1996). Individual plants (grazed and ungrazed) were measured as encountered at approximate 3-m intervals along a transect.
An individual western wheatgrass plant was defined as a turf of vegetation occu- pying a circle at least 5 cm in diameter.
Height of the extended green leaf area of each plant was measured to the nearest 0.5 cm after gently placing a ruler in the mid- dle of the turf circle. When a plant was grazed unevenly, we ocularly estimated the average height of the 5-cm turf area.
Mean residual stubble height for each sampling area was calculated from the 60 plants, and mean residual stubble height for pastures was calculated as described for paired-plot estimates.
Statistical Analyses
We employed a completely randomized design experiment with 2 x 2 factorial arrangement of treatments. Because we measured forage use of western wheat- grass and residual stubble height repeated- ly in sampling areas, we used a multivari- ate repeated measures analysis of variance to test the effects of grazing animal (elk vs elk and cattle), year (1997 vs 1998), and grazing animal x year interaction. We applied an arc-sine transformation to for- age-use data prior to analysis (Steel and Torrie 1980).
Results Forage Use
Forage use was influenced by type of grazing animal (Fig. 2A; F2,19 = 6.1; P = 0.009) and year (Fig. 2B; F2 19 = 2.9; P = 0.08) and there was no type of animal x
year interaction (P > 0.9). On average, elk had used about 20% (relative use) of west- ern wheatgrass in pastures scheduled for grazing and rest before cattle were released into the study area (Fig. 2A). In rested pastures (elk use), forage use mea- sured after cattle grazing, and at the end of the growing season, averaged 25% (rela- tive use) and 24% (total use), respectively, while corresponding use in grazed pas- tures (cattle and elk use) averaged 48%
(relative use) and 46% (total use). Total forage use averaged 22 percentage points higher in grazed pastures (46%) than in
rested pastures (24%) at the end of the growing season.
Relative forage use attributable to elk averaged about 20% before cattle arrived in the study area both years of the study (Fig. 2B). However, forage use measured after cattle grazing and at the end of the growing season averaged 10 and 16 per- centage points higher in 1998 than in
1997, respectively.
Residual Stubble Height
Residual stubble height also was influ- enced by type of grazing animal (Fig. 3A;
F2 19 = 3.6; P = 0.06) and year (Fig. 3B;
F2 19 = 32.2; P < 0.0001), and there was no type of animal x year interaction (P >
0.8). Stubble height averaged 14 cm in pastures scheduled for grazing and rest before cattle arrived at the study area (Fig.
3A). In grazed pastures (cattle and elk use), mean stubble height decreased to 12 cm after cattle grazing and to 10 cm at the end of the growing season, compared with
13 and 12 cm in rested pastures (elk use), respectively, during those same sampling periods. Stubble heights averaged 2 cm lower in grazed pastures (10 cm) than in rested pastures (12 cm) by the end of the
growing season.
In 1997, stubble heights, measured before cattle grazing (12 cm) and after cat- tle grazing (10 cm), averaged 4 and 5 cm lower than respective 1998 stubble heights (i.e., 16 and 15 cm; Fig. 3B). However, stubble height averaged about the same by the end of the growing season for both years of the study (i.e., 12 and 11 cm in 1997 and 1998, respectively).
Elk and Cattle Grazing Patterns
Because it is important to discuss both relative and total forage use in relation to corresponding stubble heights across sam- pling periods, we tabulated results by year and grazing treatment (Tables I and 2).
Higher use levels occurred after cattle had occupied grazed pastures (cattle and elk use), which typically yielded lower stub-
JOURNAL OF RANGE MANAGEMENT 55(4) July 363
16
14
18
16
14 A
i
4
2
B
12
10
8 6 4
Before cattle grazing 2
0
I
After cattle grazing Sampling period"
Cattle and Elk Elk
End of growing season
Fig. 3. Grazing animal (A) and year (B) effects on western wheatgrass stubble height (cm across 3 sampling periods on the Walker Basin Allotment, central Arizona (SEM = 0.4).
Sampling periods were: Before cattle grazing = relative forage use, early/mid-Jun.; After cattle grazing = relative forage use, mid-Jun./early Jul.; End of growing season, or 3 to 4 months after cattle exited grazed pastures = total forage use, mid-Oct.
ble heights compared with rested pastures (elk use) during both years of the study (Tables 1 and 2). As expected, mean for- age use in grazed pastures was higher after cattle grazing (37 and 58% relative forage use during 1997 and 1998, respectively), and at the end of the growing season (32 and 61% total forage use during 1997 and 1998, respectively), than before cattle graz- ing (14 and 28% relative forage use during
1997 and 1998, respectively; Table 1).
Corresponding mean stubble heights in
grazed pastures were lower after cattle grazing (10 and 14 cm during 1997 and 1998, respectively), and at the end of the growing season (11 and 10 cm during
1997 and 1998, respectively), than before cattle grazing (13 and 16 cm during 1997
and 1998, respectively; Table 2).
Interestingly, stubble height at the end of the growing season was about the same both years of the study regardless of graz- ing treatment (i.e., range = 10-12 cm;
Table 2), whereas estimates of total forage use (Table 1) were much higher in grazed pastures during 1998 (61% ± 7) than in 1997 (32% ± 7). Higher overall stubble height in 1998 was correlated with higher mean western wheatgrass standing crop (i.e., 277 vs. 471 kg ha -1 in 1997 and 1998, respectively, SEM = 32). Higher produc- tion levels in 1998 apparently allowed higher total forage use levels than in 1997, and contributed to similar end-of-growing- season stubble heights both years.
In rested pastures, mean relative and total elk use remained relatively light and similar across the 3 sampling periods both years (i.e., range = 22-26% during 1997;
range = 13-26% during 1998; Table 1).
Corresponding mean stubble heights in rested pastures were also fairly constant across sampling periods during 1997 (i.e., 12, 10, and 12 cm, respectively), but showed a declining trend during 1998 (i.e.,
17, 16, and 12 cm, respectively; Table 2).
Discussion Level of Forage Use
Whether the Walker Basin Allotment grazing system provided "proper" forage use depended on the metric used. For example, mean 1998 total use in grazed pastures (61%, Table 1) exceeded levels recommended for semi-arid ranges (e.g., 30-40%, Holechek et al. 1998); however, residual stubble height for western wheat- grass (Table 2) never fell below the 8-10 cm (3-4 in) minimum recommended by the same authors (Holechek et al. 1998). In rested pastures, mean total elk use (22% in 1997 and 26% in 1998) and end-of-grow- ing-season stubble height (12 cm during both 1997 and 1998) were also within rec- ommended limits (Holechek et al. 1998).
Adhering strictly to utilization or stub- ble height guidelines while ignoring effects of intensity, frequency, and season of use yields an incomplete picture of grazing impacts (Zhang and Romo 1995, Smith 1998). For example, cattle grazing in each pasture occurred only 19 days/year (intensity, frequency) and after seed set or during dormancy, when western wheat- grass is less vulnerable to herbivory (sea- son of use) (Smith 1998). Pastures grazed by cattle 1 year were rested from cattle the following year (frequency) and received relatively light elk use (intensity).
Because total use in rested pastures was nearly the same in June as in October (Table 1), we concluded that most elk use occurred early in the growing season when western wheatgrass was in the vegetative stage (season of use). Perennial grasses tend to be more tolerant of grazing during the vegetative stage compared to the reproductive "boot" stage because meris- tematic tissue is relatively closer to ground (Frost et al. 1994, Smith 1998).
The sampling technique used may also influence the results obtained. One disad- vantage of the paired-plot technique is that use estimates are imprecise unless sample size is very large (Klingman et al. 1943).
An attempt in 1998 to decrease paired-plot unit variability within sampling areas by
individually matching subsamples was ineffective (Bork and Werner 1999).
Additionally, Bork and Werner (1999) suggested that the standard practice of zeroing negative utilization values when using the paired-plot technique could con- tribute to overestimation of forage use on spatially heterogeneous ranges. Negative use values from paired-plot units were zeroed following Werner and Urness (1998). Zeroed paired-plot data in our study were 9 percentage points higher than
364 JOURNAL OF RANGE MANAGEMENT 55(4) July 2002