J. Range Manage.
55:117-126 March 2002
Elk management strategies and profitability of beef cattle ranches
WENDY L. F. TORSTENSON, MICHAEL W. TESS, AND JAMES E. KNIGHT
Authors are Research Associate, Professor, and Wildlife Extension Specialist, Department of Animal and Range Sciences, Montana State University, Bozeman, Mont. 59717-2900.
Abstract
Computer simulation was used to determine the effects of wild elk (Cervus elaphus) on available forage, cattle herd size, and ranch gross margin in southwestern Montana beef cow-calf pro- duction systems. Data collected from 5 southwestern Montana ranches were used to develop input parameters for bio-economic models of elk forage harvest and beef production. Input parame- ters described ranch resources, animal inventories, and animal management. Cattle herd size ranged from 241 to 1147 head. Elk numbers varied by season within ranch and ranged from 49 to 421 head. Ranches were simulated as currently managed with elk pre- sent and with 10, 20, 30, and 100% of the elk removed. Simulated management scenarios were replicated 10 times. Data from each ranch were analyzed by one-way analysis of variance. Cattle herd size, gross margin, and available forage significantly (P < 0.05) increased when all elk were removed; however, the magnitude of these effects differed among ranches. Removal of all elk permitted cattle herd size to increase from 7 to 32% across ranches. Annual costs of elk on the 5 ranches (i.e., increase in gross margin from elk removal) ranged from $5,949 to $21,152. On an AUM basis, elk costs ranged from $8.55 to $14.51. Three management alternatives were evaluated for their potential to recover elk costs: Montana's Block Management Program, coordinated exchange of forage use, and leasing of hunting access. For each ranch, at least one of these management strategies could recover all estimated costs of provid- ing elk habitat. Elk can significantly reduce profits for cow-calf ranches in southwestern Montana. Elk impacts on beef enterprise profits are closely associated with efficiency of resource use by cat-
tle-i.e., ranches with lower unit costs of production lose more gross margin by providing forage for elk compared to ranches with higher production costs.
Key Words: range economics
Beef cattle and elk (Cervus elaphus) are important parts of the economy and heritage of the Rocky Mountain West. As native wild ungulates, elk are important components of healthy ecosys- tems. Elk and cattle use similar habitats and prefer similar diets for much of the year. Because private lands, primarily livestock ranches, provide an important part of annual elk habitat, cattle-elk interactions are important to public resource managers and live-
Research was funded in part by USDA-NRICGP.
Journal Series No. 2001-39, Montana Agricultural Experiment Station.
Manuscript accepted 20 Jul. 01.
Resumen
Simulacion por computadora fue usada para determinar los efectos del alce silvestre (Cervus elaphus) en forraje disponible, tamano del Nato de ganado, y margen bruto del rancho en sis- temas de produccion vaca- becerro en el suroeste de Montana.
Los datos recolectados de 5 ranchos del suroeste de Montana fueron usados para desarrollar parametros de entrada para modelos bio-economicos del consumo de forraje del alce y la pro- duccion de ganado de carne. Los parametros de entrada descri- bieron los recursos del rancho, inventario y manejo de animales.
El tamano del hato de ganado vario de 241 a 1147 cabezas. El namero de alces vario por temporada en el rancho y fluctuo entre 49 a 421 cabezas. Los ranchos fueron simulados tanto como si el alce estuviera presente como si este hubiera sido reti- rado de los mismos. Escenarios de administracion simulados fueron repetidos 10 veces. Los datos fueron analizados por pro- cedimientos de minimos cuadrados, contabilizando los efectos del alce. El tamano del Nato de ganado, el margen bruto, y el forraje disponible incremento significativamente (P < 0.05) cuando los alces fueron retirados; aunque la magnitud de estos efectos fue diferente entre ranchos. El retirar todos los alces permitio que el tamano del Nato de ganado se incrementara de 7 a 32% entre los diferentes ranchos. Los costos anuales del alce en los 5 ranchos (e.g., incremento en el margen bruto por el retiro del alce) van- anon de US$ 5, 949 a US$ 21,152. Sobre la base de unidades ani- mal por mes (UAM), los costos del alce variaron de US$ 8.55 a US$ 14.51. Tres alternativas de manejo fueron evaluadas por su potencial para recuperar los costos del alce: programa de administracion por bloque de Montana, intercambio coordinado de use de forraje, y renta por acceso a la caza del alce. Para cada rancho, al menos una de estas estrategias podria recuperar todos los costos estimados de proveer un habitat para el alce. El alce puede reducir significativamente las ganancias de ranchos vaca- becerro en el suroeste de Montana. Los efectos del alce en empresas de ganado de carne estan asociados con la eficiencia del use de los recursos por el ganado (e.g., ranchos con bajos cos- tos unitarios de produccion pierden mas margen bruto al proveer forraje para el alce, comparados con ranchos con altos costos de produccion).
stock producers (Adams 1982, Skovlin 1982, Alt et al. 1992, Henderson and O' Herrin 1992).
Interactions between cattle and elk sharing habitats are com- plex and determined by many factors (Smith 1961, Vavra et a1.
1989). These factors include similarity of feeding strategies, and spatial, temporal and dietary overlap (Mackie 1970; Edge and Marcum 1990, Vavra 1992, Sheehy and Vavra 1996). For competi-
JOURNAL OF RANGE MANAGEMENT 55(2) March 117
tion for forage to occur, both cattle and elk must be consuming the same forage species in the same area and the forage species must be in short supply (Marie 1951, Gordan 1968, Wagner 1969, Holechek
1980, Vavra et al 1989, Vavra 1992, Edge and Marcum 1990).
Given the goals of environmental and economic sustainability, when elk and cat- tle share the same habitats, numbers of both species may need to be reduced in order to prevent damage to the range resource. Assuming cattle prices are above breakeven prices and other sources of income are held constant, a reduction in cattle numbers will reduce ranch profit.
For beef producers on private land, most strategies to preserve ranch income involve minimizing competition between elk and cattle and (or) deriving supple- mental income from elk. The relative eco- nomic benefits of these alternatives have not been studied.
The objectives of our research were to:
1) evaluate the effects of elk populations on profitability of beef cattle enterprises, and 2) compare alternative elk/cattle man- agement strategies for their effects on ranch profitability.
Materials and Methods
Five ranches located in southwestern Montana cooperated in the study.
Livestock, wildlife, and management data collected from each ranch were used to develop input parameters for 2 computer simulation models. The first model pre- dicted forage harvest by elk based on number, age, sex, reproduction and season of use. The second model simulated cattle performance and profit for the ranch.
Ranch and Cattle Data
Five ranches were selected as represen- tatives of southwestern Montana. Criteria for selection were that the ranch was a beef cow-calf operation with: a) private land representing a large portion of the resource base, b) revenues from the sale of cattle constituting its primary source of income, and c) migratory and (or) resident elk using the ranch for at least part of the year. Advice on suitable ranches was received from Montana Fish, Wildlife &
Parks (FWP) biologists and Montana State University Extension personnel.
Inventories and descriptions of forage resources and cattle grazing strategies were obtained from each ranch. Cattle data included: herd size, genetic composition, replacement strategies, breeding seasons,
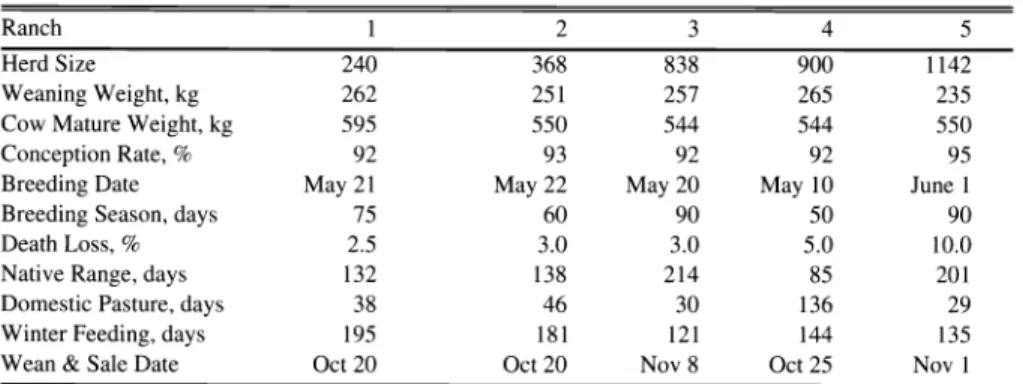
health management, nutritional manage- ment, marketing practices, and perfor- mance measures for reproductive rate, mortality, and growth. Feeding manage- ment data included amounts and type of forage, dates when cattle were moved on and off range, along with how each man- agement group was treated (Table 1).
Elk data collection
Estimates of the number of elk on each ranch were obtained from FWP biologists and ranch managers. Yearly flight data (FWP) for elk numbers were used to cate- gorize elk herds into bulls, cows, and calves. Most flights occurred after the hunting season and near the end of winter after a large portion of elk mortality had occurred. Calves were assumed to be 50%
male. Taber et al. (1982) constructed static life tables (defined by Begon et al. 1990) based on field studies of Rocky Mountain elk. We adapted their reproductive per- centages to determine age distributions within sex. Amount of time and type of activity elk spent on the ranches was determined from interviews with FWP biologists and ranch managers.
Dietary overlap (percentage of elk diet, by season, that would be potentially con- sumed by cattle if available) was deter- mined from literature reports based on veg- etation types that we judged to be relevant to the habitats found on the 5 ranches (Murie 1951, Stevens 1966, Gordon 1968, Mackie 1970, Nelson 1982, Peek 1982, Kasworm et al. 1984). Similarly, spatial overlap (percentage of habitat used by elk, by season, that was used by cattle some- time during the year) was estimated based on literature reports (Smith 1961, Mackie 1970, Skovlin 1982, Witmer and deCalesta 1983, Hart et al. 1991, Yeo et al. 1993) and by interviews with ranch managers and local FWP biologists.
Table 1. Characteristics of ranches simulated.a
Elk Forage Consumption Model In an effort to quantify dietary overlap between elk and cattle, many researchers have compared forage intake by elk to the standard AUM. Intuitive reasoning has formed the basis for many estimates of AUM equivalents (Holechek 1980).
Several estimates have been based simply on body weight (Murie 1951, Stoddart and Smith 1955, Loomis et al. 1989, Lacey et al. 1993). Calculations based on weight alone risk errors due to differences in gen- der, animal physiological state, and spatial and dietary overlap (Holechek 1980, Nelson and Leege 1982).
An AUM is a useful, but imprecise method of measuring forage intake (SRM 1989). A more precise measure of what an animal eats would be based on caloric intake. Because energy is usually the lim- iting nutrient under range conditions, ani- mals eat to meet its energy requirements (Vavra 1992), and intake is expected to vary with gender and physiological state.
Because the energy density of forages changes with plant maturity, dry matter intake will change with plant maturity for
animals in the same physiological state.
The purpose of our elk model is to simu- late forage consumption by wild elk in an effort to quantify dietary overlap between elk and domestic cattle. The model takes into account the different physiological needs of elk as related to age, sex, repro- ductive status, and time of year, as well as forage quality and dietary and spatial over- lap of elk and cattle. The model is deter- ministic and relatively simple. We empha- size that the primary purpose of the model is to estimate forage removal by an existing elk herd, and not to simulate the dynamics of a herd in response to changing resources.
See Appendix for further description of the model and the equations used.
Ranch 1 2 3 4 5
Herd Size 240 368
Weaning Weight, kg 262 251
Cow Mature Weight, kg 595 550
Conception Rate, % 92 93
Breeding Date May 21 May 22 20 10 1
Breeding Season, days 75 60
Death Loss, % 2.5 3.0
Native Range, days 132 138
Domestic Pasture, days 38 46
Winter Feeding, days 195 181
Wean & Sale Date Oct 20 Oct 20 8 25 1
aHerd
Size = number of beef cows exposed to bulls per year, including replacements; Weaning weight = average wean- ing weight of steers and heifers; Breeding Date = first day of breeding for mature cows, all ranches except #2 bred year- ling heifers earlier (Ranch l = 14 d, Ranches 3 & 5 = 10 d, Ranch 4 = 30 d); Breeding Season = length of season for mature cows; Death Loss = calves lost from birth to weaning; Domestic Pasture = early spring pasture (Ranch 4) and hay aftermath (all ranches).
118 JOURNAL OF RANGE MANAGEMENT 55(2) March 2002
Beef Cow-Calf Model
The beef cow-calf model developed by Tess and Kolstad (2000a,2000b) was used to simulate cattle and ranch enterprise per- formance. The model simulates perfor- mance of beef cattle of varying genetic types in response to changes in forage quality and management strategies, and simulates economic performance of beef production systems in response to alter- nate breeding and management systems. It uses parameters input by the user describ- ing genotypes, mating systems, nutritional characteristics of native range and stored feed, management decisions, input costs, and cattle prices. Importantly, the model simulates performance of ranches of fixed
size-i.e., the grazed forage base is a fixed number of AUM. Resource and manage- ment data for the ranches used in the sim- ulations are presented in Table 1. Input prices and cattle prices used were averages during 1996.
The beef simulation model produces several measures of system performance.
Only 3 statistics will be reported here.
Because the model simulates a ranch with a fixed range resource base, adding resources or changing the management of the range forage base can lead to differ- ences in annual cattle herd carrying capac- ity. Hence, herd size (specifically, the number of cows exposed for breeding) provides a measure of carrying capacity.
Ranch gross margin, computed as gross income minus variable costs, provides a measure of profitability for each ranch when the ranch is constrained to a fixed range resource base. This economic mea- sure considers some expenses as fixed
-
for example, home raised hay, grazed for- age, property taxes, and some family labor. In contrast, unit cost of production (specifically, input cost per kg of steer equivalent weight sold) provides a mea- sure of production efficiency treating all input costs as variable and without con- straints. In other words, for this measure of economic efficiency, all resources used, including raised hay and grazed forage, are priced at their rental values and are not considered to be in limited supply. See Tess and Kolstad (2000a,2000b) for fur- ther details.
Integration of Elk and Cattle Data The elk forage model was used to deter- mine forage harvest by elk on each ranch.
Forage use by elk was equated to AUM that potentially could have been used by cattle if elk were not present and if elk were eating what the cows could access-
i.e., as affected by slope, terrain, etc. It is
important to understand that our definition of a fixed forage resource base assumes that there is a fixed amount of forage pro- duced annually that can be grazed without harming the range resource.
Using the cow-calf model, ranches were simulated as they were actually managed.
To compare how these ranches could theo- retically be run if elk were not present, AUM harvested by elk on the respective ranches, as determined by the elk forage model, were added into the cow-calf model for the individual ranches.
Comparisons of these simulations, allowed us to determine how many additional cat- tle could be maintained on the ranches due to an increase in forage if elk were not present, and the effects this had on ranch gross margin. Amounts of home-raised hay and domestic pasture were also con- sidered fixed for each ranch. Hence, adding range resources would allow each ranch to run more cattle, but also might require the purchase of additional hay for winter feeding.
Alternative Management Strategies Several potential methods exist by which beef cattle ranchers can reduce con- flict between elk and cattle and (or) recov- er costs associated with elk on private lands. Variability of available resources on ranches and the number of elk utilizing the ranches makes it difficult to find a single best solution to the problem.
Block Management. In Montana, the Block Management Program was devised to keep private lands open for public hunt- ing, while paying landowners for allowing free hunter access. Through management of the number and strategic placement of hunters, more efficient hunting is expect- ed, thereby reducing elk herd numbers (Governor's Advisory Council on Private lands/Public Wildlife, unpublished). In addition to assisting landowners with hunter management, the program also offers benefits that reduce or eliminate the cost of having hunters on private land, and in some cases offers taxable reimburse- ments of up to $8,000 (Montana Session Laws 1995).
To mimic more efficient hunting, each ranch was simulated with elk herds reduced by 10, 20, and 30%. Effects on cattle herd size and gross margins were evaluated.
Coordinated Exchange of Forage Use.
Coordinated grazing of rangelands among state, federal, and private lands allows pri- vate landowners to rest pastures that have been grazed by elk during the fall, winter, and (or) spring (Frisina and Morin 1991, Alt et al. 1992). With the exchange of for-
age, landowners may not have to purchase stored forage to replace forage removed by elk. For example, members of the Wall Creek Stock Association participating in the Wall Creek Wildlife Management Area exchange of use program received an addi- tional month of livestock grazing, resulting in an extra 826 AUM of grazing by cattle (Alt et al. 1992). A major limitation of this scenario is that there must be available state and federal lands close enough to the private landowner to make transporting cattle to these public ranges feasible. To evaluate this scenario, the fair market value of an AUM on private property was com- pared to the value of an AUM as simulated for each of the five ranches.
Leasing Hunting Access. Leasing pri- vate land to outfitters in Montana is a common, but sometimes controversial, practice. Hunters are willing to pay for the opportunity to hunt elk, particularly if they are assured of an un-crowded hunt. This
"market" allows outfitters to lease land from ranchers at a value that increases the landowners' income.
There are several forms of fee hunting.
However, for this study, we chose only the leasing of the land to an outfitter. Once land was leased to an outfitter it was assumed that no further costs associated with hunters, such as time spent managing or guiding hunters, would be incurred by the rancher. Also, the monetary value of the lease was fixed, whereas if a landown- er were to lease hunting access to individ- ual hunters, the income would be variable, dependent on the number of hunters want- ing to hunt.
To determine the value of a lease on each ranch, a survey was sent to 100 out- fitters in FWP hunting regions 1, 2, and 3, where elk hunting is prevalent. Survey procedures were based on previous studies (Swensson and Knight 1998, 2001). The survey consisted of a cover letter explain- ing the study and what was being asked of the outfitter; general maps of the individ- ual study ranches showing county roads and habitat types; and a description of the elk herd that occupied the ranch during hunting season. The elk herd was described by percentage of bulls in various age classes, as well as number of calves per 100 cows and number of bulls per 100 cows. Outfitters were requested to esti- mate the market value of each lease. Six weeks after mailing the initial surveys, fol- low-up phone calls were made to a ran- dom 50% of the non-respondents. Reasons for not completing the survey were deter- mined. When feasible, non-respondents were again asked to complete the survey.
JOURNAL OF RANGE MANAGEMENT 55(2) March 119
Statistical Analyses
Five scenarios were simulated in deter- mining the effects of elk on ranches. To meet our first objective, each ranch was simulated as currently managed with elk present. The simulations were repeated with elk removed from the ranch, i.e., for- age resources utilized by elk were added to the AUM available for cattle. These simulations also provided insights into the merits of the exchange of forage manage- ment strategy. To evaluate the potential effects of partial reduction in the elk herds, as might be expected due to Block Management, each ranch was simulated with a 10, 20, or 30% reduction in the ranch's elk population.
Due to the stochastic nature of the beef cow-calf model (reproductive traits exhibit random variation; Tess and Kolstad 2000a), it is possible to statistically com- pare simulated systems. Because not all traits are modeled with random variation, simulated variation between replicates is not the same as would be measured among actual ranches; however, the variation sim- ulated does provide a basis for evaluating differences. Hence, each ranch/scenario combination was replicated ten times.
Because variances differed among ranches, simulated data for each ranch was analyzed separately. One-way analysis of variance was conducted to evaluate treat- ment effects (i.e., 0, 10, 20, 30, or 100% elk removal) on ranch gross margin and cattle herd size (SAS 1992). Means were separat- ed using Duncan's Multiple Range test.
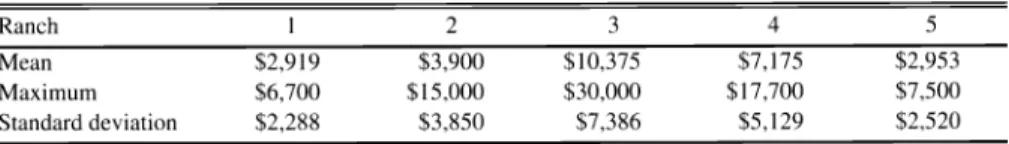
Results of the outfitter surveys were summarized by computing simple means and standard deviations of the estimated lease values.
Results
Elk AUM Equivalents
Table 2 illustrates the performance of the elk model for animals of different sexes and physiological states, and con- suming forage of different quality. To a large degree, previous estimates of AUM equivalents have been based on differ- ences in mature weight between elk and cattle, assuming that intake of elk was pro- portional to cattle but not considering physiological state. Murie (1951) and Loomis et al. (1989) used values of 0.25 and 0.27 for elk calves. Coupled with their value for lactating elk cows (0.67), the values of Loomis et al. (1989) agree with the model's predictions. Arychuk (2000) distinguished yearlings (0.3), adult females (0.5) and adult males (0.7).
Table 2. Effects of variable forage energy content and physiological state of elk on animal unit value equivalents.a
Male Female-N Female-G Female-L
Metabolizable energy per kilogram dry matter
Age 2.00 1.70
Y l 0.47 0.56
Y2 0.59 0.67
M 0.63 0.79
aY 1= yearling, Y2 =two-year old animal, and M = mature animal of five-years old or older. Female-N = non-reproduc- tive female, Female-G = gestating female, and Female-L = lactating female, including calf.
Previous AUM equivalents for adult elk (sex not specified) include 0.4 (Murie 1951, Meresczak et al.1981, Loomis et al.
1989, Wisdom 1992), 0.5 (Stoddart and Smith 1955, Skovlin et al. 1968, Lacey et al. 1993), 0.6 (Lacey et al. 1988), 0.65 (Vallentine 1990), and 0.75 (Telfer and Scotter 1975).
Our results demonstrate the effects that age, gender, physiological state, and for- age quality can have on forage intake. By accounting for these variables and dietary overlap, our model permits more precise description of the study case. These results also point to the hazards of using single, general predictions of AUM consumed by elk, because such predictions cannot account for species differences in food habits and distribution across rangelands (Vavra 1992).
Animal Use and Ranch Resources Numbers of elk utilizing the ranches were likely conservative (Table 3). With only one yearly flight to determine the population characteristics of a herd for the
entire year, we assumed no recruitment of bachelor bulls took place, and average recruitment through reproduction occurred.
Elk use and numbers varied across ranches. All ranches showed an influx of elk in late fall that continued to early spring (Table 4). In general, there was a decline in elk numbers during the summer as elk migrated to higher elevation habi- tats, typically on state and federal lands.
The exception to this was Ranch 5, which provided calving grounds to 250 cow elk.
Four of the 5 ranches supported both resi- dent and migratory populations of elk.
Elk-use data presented in Table 4 repre- sent our best estimates for the product of spatial and dietary overlap between elk and cattle by season and reflect differ- ences due to forage species, elevation, slope, ruggedness, and distance from water (also see review by Fuller 1997).
Late fall and winter showed the highest percentages of resource overlap of up to 90%, with the exception of Ranch 2. The manager of Ranch 2 felt there was only 20% overlap due to the fact that all hay Table 3. Summary of elk herds on individual ranches.a
Ranch Age Class Male
1 Y0 9 9
Yl 8 13 2
Y2 2 7 6
M 9 28
2 Y0 32
Y1 30 45 8
Y2 5 25
M 29 102
3 Y0 24
Y1 21 31 6
Y2 7 18
M. 19 71
4 Y0 26
Yl 4 17 3
Y2 3 9 9
M 5 41
5 Y0 34
Yl 10 25 4
Y2 4 14
M 9 56
a Numbers shown are estimated maximum populations.
Y0 = calves, Y 1= yearlings; Y2 = 2 'ear olds; M = 3+years
Female-N = non-reproductive female; Female-R = reproductive female.
120 JOURNAL OF RANGE MANAGEMENT 55(2) March 2002
Table 4. Summary of elk use on individual ranches.
Ranch Period of Use Number of Elk
1 Oct 1-Nov 30 118
Dec 1- May 15 118 75
May 16 - May 31 118 75
June 1- Oct 1 71 40
2 Oct 1- Nov 30 199
Dec 1- Mar 31 347 20
Apr 1- May 30 421 40
June! Sept 9 331 50
Sept 10 - 30 199 80
3 Oct 1- Nov 30 290
Dec 1- Apr 15 298 85
Apr 16 - Jun 20 249 40
Jun 21- Sept 9 199 50
Sept 10 - 30 290 80
4 Oct 1- Nov 30 178
Dec 1-Mar 31 178 90
Apr 1- Jun 20 49 40
Jun 21- Sept 9 100 50
Sept 10 - 30 178 80
5 Oct 1- Nov 30 194
Dec 1- Apr 15 114 85
May 15 - Aug 15 250 40
Sept 10 - 30 194 80
aOverlap=dietary and spatial overlap between elk and cattle, %.
Table 5. Simulated ranch performance without elk removal.a
Ranch Herd Size Cattle AUM Elk w/o Cattle used by Elk
Overlap
($/kg) --- (AUM) ---
1 241 1,835
2 368 2,820
3 838 7,750
4 902 7,760
5 1,147 9,200
aHerd
Size = number of beef cows exposed per year, including replacements. Cattle AUM = AUM used by cattle; $/kg = unit cost of beef production; Elk AUM w/o overlap = AUM used by elk without considering dietary and spatial overlap;
Cattle AUM used by Elk = AUM that could be used by cattle if elk were not present.
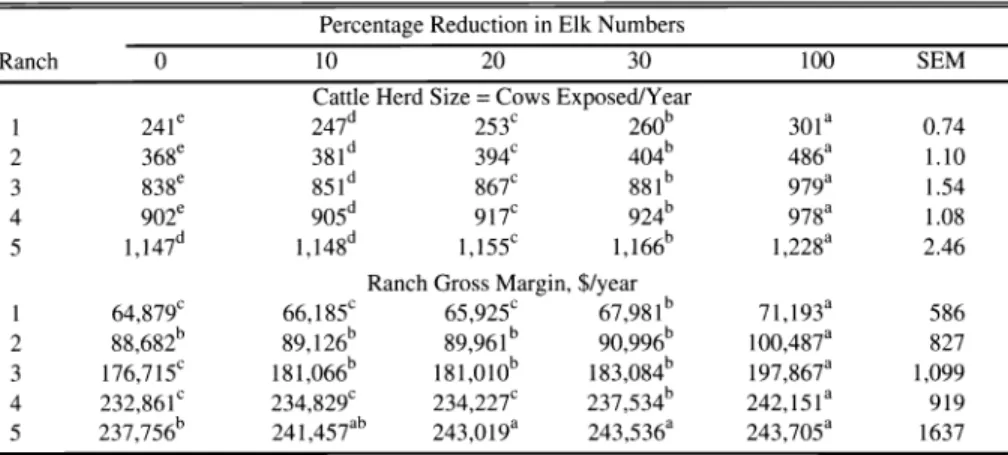
Table 6. Simulated effects of elk herd reduction on beef enterprise performance.
Percentage Reduction in Elk Numbers
Ranch 0 10 20 30
Cattle Herd Size = Cows Exposed/Year
1
241e
247d 260b
2 368e
381d 404b
3 838e
851d 881b
4 902e 905d 924b
5 1,147d 1,148d 1,166b
Ranch Gross Margin, $/year
1 64,879c 66,185c 67,981
2 88,682b 89,126b 90,996b
3 176,715c 181,066b 183,084b
4 232,86P 234,829c 237,534b a
5 237,756b 241,457ab 243,536a
abcdeMeans within rows with different superscripts differ (P < 0.05).
was stored in "elk-proof' sheds, and elk did not generally intermingle with cattle during winter feeding of hay. In general, summer months showed only a 40% over- lap mostly due to changes in dietary pref-
erences of elk from grasses to forbs (Murie 1951, Mackie 1970).
Table 5 summarizes ranch performance under actual management and elk num- bers. Differences in production costs ($/kg) were due to several factors.
Reproductive rates were similar among ranches; however, calf mortality was high for Ranch 5, spreading production costs over less output. Due to snow cover, Ranches 1 and 2 fed hay for extended periods, increasing feed costs.
By accounting for less than complete dietary and spatial overlap (Table 4), AUM harvested by elk in competition with cattle were considerably less than might be predicted otherwise (Vavra et al.
1989, Kingery et al. 1996). This highlights the importance of dietary overlap in quan- tifying potential competition between live- stock and wildlife.
Forage Resources Gained From Elk Removal
Differences among ranches in gross margin reflect differences in herd size as well as differences in unit costs of produc- tion (Table 6). Recovering all forage resources used by elk (i.e., 100% elk removal) increased cattle carrying capaci- ty and gross margin for each ranch (P <
0.05); however, responses were unique for each ranch. The ratio of added AUM to added cows ranged from 7.7 to 9.4, indi-
cating how ranches differed in their dependence on range resources. Because of their short grazing seasons, Ranches 1
and 2 added more cows per AUM than Ranch 3, which was able to graze for near- ly two months longer. Ranches 4 and 5 were intermediate.
The value of added AUM (added gross margin divided by added AUM) also dif- fered among ranches; however, standard errors were large. Because this statistic was deemed important to the interpretation of results, we repeated the simulations for the base scenario, and the scenario assum- ing total removal of elk. This time we
replicated each scenario 200 times.
Estimated values of an added AUM ranged from $8.55 to $14.51 (Table 7).
Differences were related to, but not totally explained by differences in grazing sea- son. Ranches that grazed longer and fed less hay were generally more efficient (i.e., lower production costs, $/kg) and recovered more gross margin per added
JOURNAL OF RANGE MANAGEMENT 55(2) March 121