J. Range Manage.
51:139-l& March 1998
Tallgrass prairie response to grazing system and stocking rate
ROBERT L. GILLEN, F. TED MCCOLLUM III, KENNETH W. TATE, AND MARK E. HODGES
Corresponding author: Robert L Gillen, USDA-Agricultural Research Service, 2ooO 18th Street, Woodward, Okla. 73801. Rangeland scientist, USDA-ARS, Woodward, Okla.; beef cattle extension specialist, Texas A&M University, Amarillo, Tex.; assistant professor, Department of Agronomy and Range Science, University of California, Davis; and executive secretary Oklahoma Wheat Commission, Oklahoma City, Okla. At the time the research was conducted Gillen was professor, Department of Agronomy, McCollum was professor, Department of Animal Science, and Tare and Hodges were senior agriculturists, Dep&ment of Agronomy, Oklahoma State University, Stillwater,.Okla.
Abstract
Grazing system and stocking rate effects on standing crop of species and relative species composition of tallgrass prairies in north-central Oklahoma were evaluated from 1989 to 1993.
Twelve experimental units, consisting of pastures dominated by big bluestem [Andropogon gerurdii Vitman], little bluestem [Schizachyrium scoparium (Michx.) Nash], and indiangrass [Sorghustrum nutuns (L.) Nash], were arranged in a completely randomized design with either a short duration rotation or con- tinuous grazing system and stocking rates ranging from 51.5 ani- mal-unit-days/ha (AUD/ha) to 89.8 AUD/ha. Yearling steers grazed the pastures from late April to late September.
Cumulative precipitation was above average during the study period. Continuous and rotation grazing affected the major herbage components similarly over time. Standing crop of all
major herbage components declined as stocking rate increased.
The standing crop of the major herbage components also declined from the first to the last year of the study. The decrease in standing crop of big bluestem, indiangrass and forbs over years was greatest at lighter stocking rates. Relative composition of switchgrass [Panicurn virgutum L.] increased at the lower stocking rates over time in both grazing systems. The relation- ship between shortgrasses and stocking rate was different
between grazing systems at the start of the study but became simii between grazing systems over time. Atter 5 years, short- grasses were positively related to stocking rate under both graz- ing systems. Favorable growing conditions and the high seral state of the vegetation in the experimental pastures may have tempered the response to grazing treatments.
managers have reported dramatic improvement in vegetation after implementation of rotational grazing (Howell 1978, Merrill 1983). Research results comparing rotational grazing to continu- ous grazing, however, have not shown large differences in vege- tation response. Denny et al. (1977), Hart et al. (1988), and Thurow et al. (1988) found no differences in species composition of vegetation under continuous and rotational systems grazed at the same stocking rates. When stocking rates were increased under rotational grazing compared to continuous grazing, vegeta- tion responses were similar or less desirable under rotational grazing (Pitts and Bryant 1987, White et al. 1991).
Stocking rate has a strong effect on vegetation (Ellison 1960).
In the tallgrass prairie, high stocking rates tend to increase midgrasses and shortgrasses at the expense of tallgrasses (Herbel and Anderson 1959). This effect can be mitigated with late-sea- son non-use in a simple grazing system such as intensive-early stocking (Owensby et al. 1988).
We studied the impact of grazing system and stocking rate on several characteristics of a tallgrass prairie-livestock production system including herbage dynamics, grazing behavior, and live- stock production. In this paper we report the effects of continuous and rotational grazing systems at several stocking rates on vege- tation dynamics of tallgrass prairie. Our hypothesis was that peri- odic rest periods during the growing season would favor the dom- inant tallgrass species and this effect would be more pronounced as the stocking rate increased.
Study Area
Key Words: continuous grazing, rotation grazing, species compo- sition, plant succession
Short duration rotational grazing has been suggested as a method for increasing livestock numbers while maintaining range condition (Booysen and Tainton 1978, Savory 1978). Some land
Approved for publication by the Director, Oklahoma Agriculh~ral Experiment Station. This research was supported under project H-2089.
Authors wish to thank Brock Karges and Bob McDaniel for facilitating live- stock movement in rotational pastures and Justin Demer, Terry Carroll, and Ghan Glidewell for help with data collection.
Manuscript accepted 19 Apr 1997.
The study was conducted from 1989 to 1993 at the Oklahoma State University Research Range, located approximately 21 km southwest of Stillwater, Okla. (36”22’N, 99”04’W). The climate is continental with an average frost-free growing period of 204 days, extending from April to October. Average annual precipita- tion for the area is 831 mm with 65% falling as rain from May to October. The mean annual temperature is 15X, and ranges from an average daily minimum of -4.3”C in January to an average daily maximum of 34°C in August (Myers 1982).
Major range sites found on the area were shallow prairie (33%), loamy prairie (25%), and eroded prairie (22%). Sandy Savannah dominates the remaining area. The shallow prairie sites have Grainola series soils (fine, mixed, thermic Vertic Haplustalf),
which have a loam surface with silty clay subsoil. Coyle series soils (fine-loamy, siliceous, thermic Udic Argiustoll) comprise the loamy prairie sites. These soils have line sandy loam surfaces with sandy clay loam subsoils. The eroded prairie sites are on old fields and have Renfrow (fine, mixed, thermic Udertic Paleustoll), Mulhall (fine-loamy, siliceous, thermic Udic Paleustoll), and Coyle series soils.
Table 1. Precipitation (mm) and average maximum daily temperature (“C) at the Oklahoma State University Research Range, Payne County, 1989-1993.
Vegetation on the experimental units was typical of tallgrass prairie in a high seral state. Dominant grasses included little bluestem [Schizachyrium scoparium (Michx.) Nash], big bluestem [Andropogon gerardii Vitman], and indiangrass [Sorghastrum nutans (L.) Nash]. Secondary grasses included switchgrass [Panicum virgatum L.], tall dropseed [Sporobolus asper (Michx.) Kunth], sideoats grama [Bouteloua curtipendula (Michx.) Torr.], and Scribner’s dicanthelium [Dicanthelium oligosanthes (J.A. Schultes) Gould]. The dominant forb was western ragweed [Ambrosia psilostuchya DC]. All units had been moderately grazed in the 5 years previous to initiation of the study. The units had been burned either 1 or 2 times in late spring during the same period.
Preciuitation Tempera&e
Year Nov.-Apr. May-Aug. May-Aug.
__________ (-) _________ - (“(3
1989 307 608 29.5
1990 497 281 31.1
1991 204 343 31.9
1992 305 536 28.6
1993 542 361 30.8
Study Average 371 426 30.4
Long-term Average 268 360 31.3
indiangrass, switchgrass, midgrasses, shortgrasses, annual grass- es, and forbs. Total standing crop was measured in late September by clipping forty-five 0.1 -m* quadrats in a grid pattern in each experimental pasture unit. Standing crops of species groups were calculated by multiplying percent relative composi- tion by total standing crop.
Methods
The experimental design consisted of a completely randomized design with grazing system and stocking rate as treatments. Six of 12 experimental pasture units were assigned to a rotational graz- ing system, and the remaining 6 units assigned to a continuous grazing system. All treatment assignments were random.
Experimental units ranged in size from 14 to 26 ha. The rotation units were subdivided into 8 pastures. Within each grazing sys- tem the units were randomly allocated to 1 of 6 levels of stocking rate. Stocking rates ranged from 5 1.5 animal-unit-days/ha (AUD/ha) to 89.8 AUD/ha, which represented moderate to very heavy rates for this range type. Experimental animals were mixed-breed yearling beef cattle with an average initial weight of 208 kg. Cattle numbers per unit ranged from 10 to 22. On aver- age, grazing began 25 April and terminated 23 September for a 15 1 day grazing season.
Cattle in the rotation units remained in a single herd and were moved between pastures. Grazing schedules in the rotation units were originally designed to allow an average of 45 days of rest for each pasture between grazing periods. We shortened the rest and grazing periods in the early portion of the growing season and lengthened the rest and grazing periods as the growing sea- son progressed. Grazing periods ranged from 3 to 8 days. After the first 2 years, target rest periods were shortened to 30-35 days;
thus grazing periods ranged from 2 to 5 days. Grazing periods for an individual pasture were adjusted for the relative forage pro- duction in that pasture compared to other pastures in the same grazing unit. Cattle in the continuous units were not moved dur- ing the grazing season. All units were burned 1 April 1990 and 20 March 1993.
We analyzed the data as a repeated measures experimental design. Main plot factors were grazing system and stocking rate with year as the repeated factor. Grazing system and year were qualitative variables. Stocking rate was a quantitative variable.
Only linear effects of stocking rate were included in the statistical model. Because stocking rate was not replicated, Type I sums of squares were used for hypothesis testing (SAS Institute 1985).
10000 8000 6000 4000 2000 0
8 6000
6 f
Relative composition was measured between 15 August and 1 September in 1989 and 1993. Composition was measured as per- cent of standing crop using the dry-weight-rank method (Gillen and Smith 1986). We systematically located one hundred 0.1-m’
quadrats in a grid pattern in each experimental pasture unit. The same grid pattern was used each year but the exact quadrat loca- tions were not repeated because the quadrats were located by pac- ing. Species groupings were little bluestem, big bluestem and
p 4000 .
.-
z m 2000 -.--- -_’
ti k---Q- cl ---mu
00 25 30 35 40 45 50 55
Stocking Rate (AUDlha)
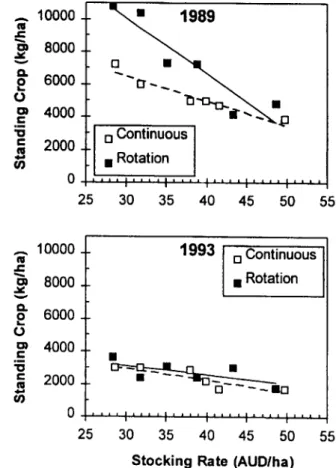
Fig. 1. Total standing crop as affected by the interaction of grazing sys- tem, stocking rate, and year (P = 0.08).
Table 2. P-values from analyses of variance of total standing crop and standing crop by species as affected by grazing system, stocking rate, and year.
Source of variation
Grazing system Stocking rate GS*SR Error A YCZX Year*GS YeaPSR Y*GS*SR Error B
df
1 1 1 8 1 1 1 1 8
Total Standing
Crop
< 0.01
< 0.01 0.01
< 0.01 0.04
< 0.01 0.08
Little Big bluestem- Short- Annual
bluestem indiangrass Switchgrass Midgrasses grasses grasses Forbs
0.05 < 0.01 0.08 0.50 0.94 0.63 0.58
0.10 < 0.01 < 0.01 c 0.01 0.80 0.53 < 0.01
0.43 0.59 0.74 0.44 0.01 0.35 0.16
0.01 c 0.01 0.98 0.01 0.85 0.01 < 0.01
0.15 0.02 0.99 0.11 0.17 0.67 0.27
0.27 < 0.01 0.96 0.43 0.42 0.70 < 0.01
0.22 0.31 0.92 0.38 < 0.01 0.46 0.27
Response variables were species standing crop (kg/ha) and rela- tive composition (%). When stocking rate interactions with graz- ing system or year were declared significant, slopes of standing crop or relative composition versus stocking rate within grazing system or year were tested using indicator regression methods (Neter and Wasserman 1974). For relative composition, all data were analyzed as percent composition and as the arcsin transfor- mation of percent. Results were not different between the raw and transformed data. Each species grouping was analyzed separately.
To address the research objective, we emphasized interactions of grazing system or stocking rate with year. Significant effects of grazing system or stocking rate were not considered important unless they changed over time.
Results
Precipitation from November to April was above normal in 4 of the 5 study years (Table 1). Precipitation from May to August was more than 50% above normal in 2 years, 1989 and 1992. Spring and summer temperatures for these 2 years were also relatively cool. May to August precipitation approximated the long-term average in 2 other years, 1991 and 1993, and was 22% below nor- mal in 1990. Overall weather conditions were favorable during the study period with cumulative precipitation well above average, and spring and summer temperatures slightly below average.
Total Standing Crop
All independent factors, grazing system, stocking rate, and year, combined to affect total standing crop (Table 2). In 1989, total standing crop was higher for rotational grazing at the lighter
stocking rates but this difference disappeared as stocking rate increased (Fig. 1). Overall standing crop was much lower in 1993 and was not different between grazing systems. May-August pre- cipitation measured 608 mm in 1989 versus 361 mm in 1993.
Over 5 years (1989-1993), total standing crop in September was higher in rotation units (Cassels et al. 1995).
Little Bluestem
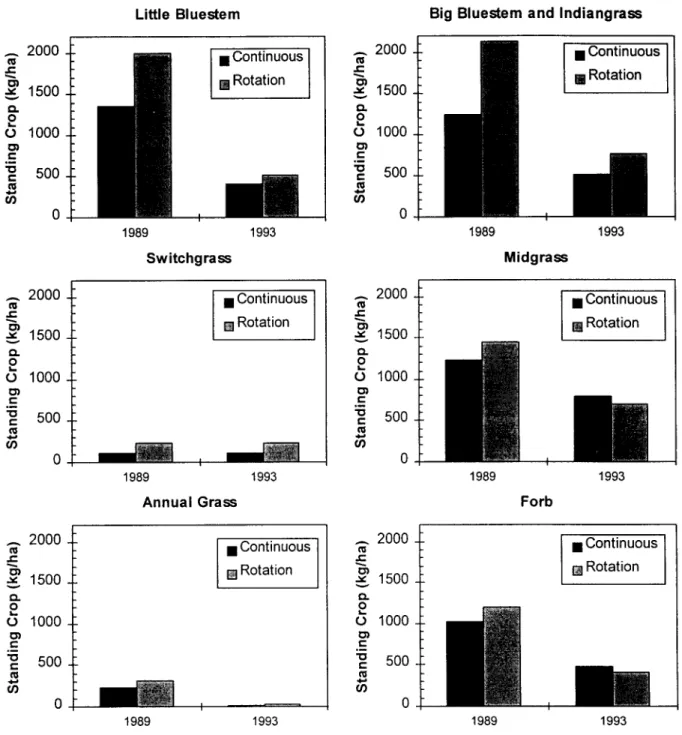
Standing crop of little bluestem was significantly higher in rotation pastures in both 1989 and 1993 (Table 2, Fig. 2).
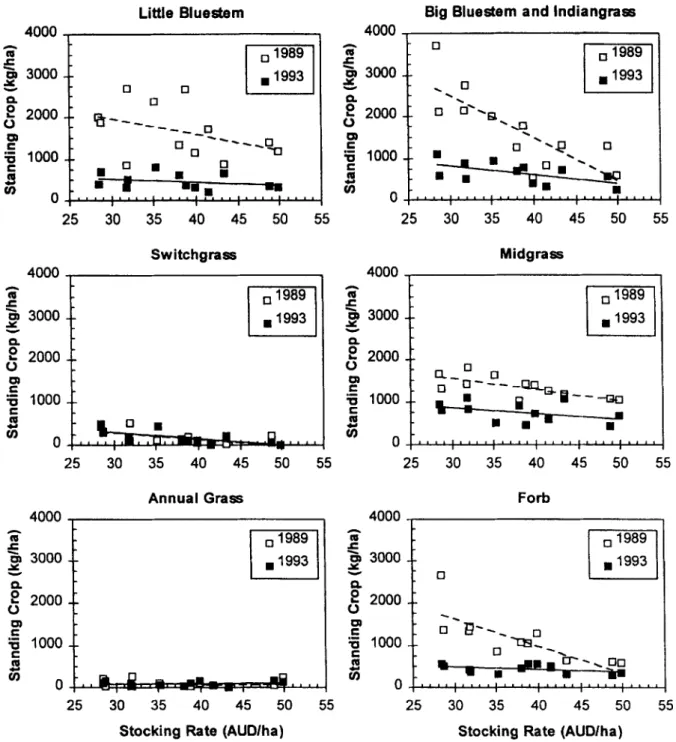
Standing crop of little bluestem also decreased as stocking rate increased (Fig. 3). These effects were mainly a function of the changes in total standing crop because relative composition of lit- tle bluestem was not affected by grazing system or stocking rate (Table 3). Simple main effects of year were significant for rela- tive composition of little bluestem (P c 0.01, Fig. 4). The decline in the proportion of little bluestem regardless of grazing system or stocking rate was unexpected given the favorable growing con- ditions and this species’ usual dominance in the tallgrass prairie.
Big Bluestem and Indiangrass
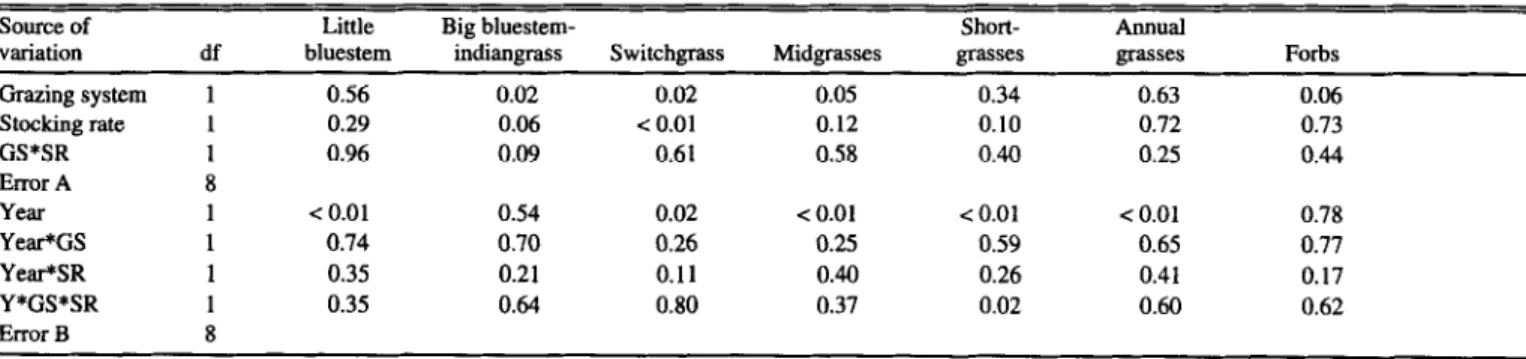
Standing crop of big bluestem and indiangrass was higher in rotation pastures in 1989 but equal between continuous and rota- tion pastures in 1993 (Table 2, Fig. 2). Relative composition for this group was higher in rotation pastures in both years (Table 3, Fig. 4). We did not attribute these differences in relative compo- sition to the grazing systems. The differences were present at the beginning of the study and did not change over 5 years of grazing (the grazing system by year interaction was non-significant, Table 3, Fig. 4). The first vegetation measurements were taken after the grazing treatments had been imposed for only 115 days.
Table 3. P-values from analyses of variance of relative compostion as affected by grazing system, stocking rate, and year.
Source of variation Grazing system Stocking rate GS*SR Error A Year Year*GS Year*SR Y*GS*SR Error B
df 1 1 1 8 1 1 1 1 8
Little Big bluestem- Short- AMU~
bluestem indiangrass Switchgrass Midgrasses grasses grasses Forbs
0.56 0.02 0.02 0.05 0.34 0.63 0.06
0.29 0.06 < 0.01 0.12 0.10 0.72 0.73
0.96 0.09 0.61 0.58 0.40 0.25 0.44
< 0.01 0.54 0.02 c 0.01 < 0.01 < 0.01 0.78
0.74 0.70 0.26 0.25 0.59 0.65 0.77
0.35 0.21 0.11 0.40 0.26 0.41 0.17
0.35 0.64 0.80 0.37 0.02 0.60 0.62
Little Bluestem Big Bluestem and Indiangrass
1989 1993
Switchgrass
1989 1993
Annual Grass
1989 1993
Midgrass
1989 1993
Forb
z 2000
f
g 1500
2
6 1000 .- z : 500
m G
0
1989 1993
Fig. 2. Standing crop of spezies groups as affected by graziug system and year. Grazing system effects were significant (P < 0.05) for little bluestem and switcbgrass. Year effects were significant (P < 0.10) for little bluestem, midgrass, annual grass, and forbs. Grazing system by year interaction significant for big bluestem and indiangrass (P < 0.05).
We believe the initial differences were a chance result of the ran- Switchgrass
dom assignment of experimental units to treatments. Standing crop of switchgrass was higher in rotation pastures Standing crop of big bluestem and indiangrass declined as (Fig. 2) and at lower stocking rates (Fig. 3). Relative composition stocking rate increased (Table 2, Fig. 3). The rate of decline was
more severe for 1989, the year of highest total standing crop. of switchgrass was also higher in rotation pastures (Fig. 4) and at Relative composition for this component also declined as stock- lower stocking rates. These relationships were present at the initi- ing rate increased (Table 3). This indicated selective grazing on ation of the study. Year had no affect on standing crop of switch- these grasses which are generally considered to be the most palat- grass but composition of switchgrass increased in all treatments able grasses in the tallgrass prairie. The decline in relative com- from 1989 to 1993. The increase in composition of switchgrass position was more severe under continuous grazing which sug- over years was directly related to stocking rate (Fig. 5). This may gested greater selection for these grasses under continuous graz- reflect favorable precipitation for the study period.
ing. This grazing system by stocking rate interaction for relative composition did not change over time (Table 3).
Little Blue&em Big Blueetem and lndiangraas
4000 , ,
2 jl 3000
- i
t 2000
25 30 35 40 45 50 55 25 30 35 40 45 50 55
Switchgrass
4000, 1
25 30 35 40 45 50 55 25 30 35 40 45 50 55
4000 ,
Annual Grass
I
f
3 3000
I
F 0 2000
r"
z 1000 m
s 0
4000 ,
Midgrass
Forb 4000 b
25 30 35 40 45 50 55 25 30 35 40 45 50 55
Stocking Rate (AUDlha) Stocking Rate (AUDlha)
Fig. 3. Standing crop of species groups as affected by stockiug rate and year. Year effects were sign&ant (P < 0.10) for little bluestem, big bluestem aad imIiangrass, midgrass, and forbs. Stocking rate by year interactions were significant (I’ < 0.01) for big bluestem and indiigrass and forbs.
Midgrasses
Midgrasses were mainly tall dropseed, sideoats grama, Scribner’s dicanthelium, and bermudagrass [Cynodon dactylon (L.) Pers.]. Standing crop of midgrasses was not influenced by grazing system (Fig. 2) but decreased as stocking rate increased (Fig. 3). Relative composition of midgrasses was higher under rotation grazing at the beginning and end of the study. Relative composition of midgrasses increased in both treatments over years. This increase was likely in response to the general decrease in little bluestem over years.
Shortgrasses
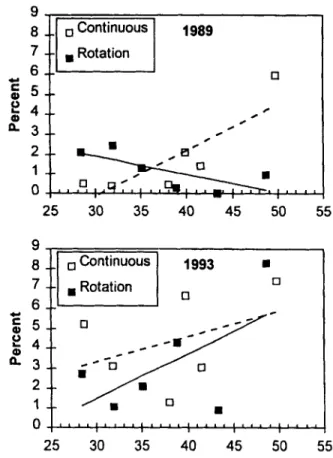
The shortgrass component was composed primarily of buffalo- grass [BuchEoe dactyloides (Nutt.) Engelm.], hairy grama [Bouteloua hirsutu Lag.], and blue grama [Bouteloua grucilis (H.B.K.) Lag. ex Steud.]. These grasses were a relatively minor part of the vegetation, averaging less than 200 kg ha-’ of standing crop and less than 6% relative composition. This group displayed a complex response to grazing system, stocking rate, and year.
The response was similar for both standing crop and relative composition (Fig. 6 and 7). Under continuous grazing, shortgrasses increased over time at all but the heaviest stocking
Little Bluestem Big Bluestem and lndiangraes
35 35
30 30
25 25
g 20 2 20
g 15 s ; 15
n a.
10 10
5 5
0 0
1989 1993 1989 1993
Switchgrass Midgrass
35 35
30 30
25 25
2 20 2 20
d s
; 15 2 15
n II
10 10
5 5
0 0
1989 1993 1989 1993
Annual Grass Forb
1989 1993 1989 1993
Fig. 4. Relative composition by weight (%) as affected by grazing system and year. Grazing system effects were significant (P -z 0.10) for big bluestem and indiangrass, switchgrass, midgrasses and forbs. Year effects were significant (I’ < 0.10) for little blue&m, midgrass, and annual grass. Grazing system by year interactions were not significant for any component.
rates. This is an unexpected result since these grasses are generally Annual Grasses
indicators of drier conditions and heavier grazing (Suns and Dwyer Annual grasses were mainly Japanese brome [Bromus juponicus 1965). Under rotational grazing, shortgrasses increased at the high- Thunb.] and prairie threeawn [Arisrida oliganth Michx.]. As with er stocking rates after 5 years of grazing. Standing crop and com- the shortgrasses, the annual grasses were a minor component of position of the shortgrasses in the rotational pastures was different the total vegetation. Standing crop of this group was not affected from the continuous pastures initially, probably due to chance, but by grazing system or stocking rate but declined over years (Table became more similar to the continuous pastures over time. 2, Fig. 2). Relative composition was not affected by grazing sys- tem or stocking rate but did decline from 1989 to 1993 (Fig. 4).
This decline was likely the result of the spring burn in 1993 (Gillen et al. 1987).
25 30 35 40 45 50 55 Stocking Rate (AUDIha)
Fig. 5. Relative composition by weight (%) of switchgrass as affected by the interaction of stocking rate and year (P = 0.11).
Forbs
Common forbs on the experimental pastures included western ragweed, slimflower scurfpea (Psoralea tenuifora Pursh), and heath aster (Aster ericoides L.). Western ragweed is considered to have low forage value for cattle while heath aster and scurfpea are moderately palatable to cattle (Dwyer 1961). Standing crop of forbs was not affected by grazing system (Fig. 2). Standing crop of forbs was much higher at the lower stocking rates in 1989 but was little affected by stocking rate in 1993 (Fig. 3). We believe this is an expression of abundant precipitation in 1993.
f 250 2 200 0” 150 t
-1
= 100 C z 50 8
0
9-
1989
9 8 7 6
=5 s t4
&3 2 1 0
25 30 35 40 45 50 55
25 30 35 40 45 50 55
Fig. 7. Relative composition by weight (%) of shortgrasses as affected by the interaction of grazing system, stocking rate, and year Q = 0.02).
n 1989 I
Launchbaugh (1967) reported a similar relationship, high forb production under moderate stocking rates in high precipitation years, for mixed prairie in western Kansas. Relative composition of forbs was higher under continuous grazing in 1989 but this relationship did not change over time (Fig. 4).
Discussion
25 30 35 40 45 50 55
;;; 250 -- 1993
f 9 200 -- Y
e 150 -- cl
ii ---_---__ 0 n
a .-
; 50 --
3; m cl n
0 ‘“‘:““:““:““:~“~:‘“’
25 30 35 40 45 50 55
Stocking Rate (AUDIha)
Other studies of grazing systems in tallgrass prairie have not shown a strong vegetation response to grazing systems. A 3-pas- ture deferred grazing system tended to increase little bluestem and indiangrass and decrease midgrasses after 17 years of grazing in Kansas tallgrass prairie (Owensby et al. 1973). A 3-pasture rota- tional system with 1 month grazing periods had little impact on sandhills vegetation in western Oklahoma after 8 years (McIlvain and Savage 1951) although the authors felt tallgrasses were slight- ly favored. In both studies, the general state of the vegetation under either continuous or simple grazing systems was considered desirable. Finally, different combinations of grazing and rest peri- ods under rotational grazing did not change vegetation response in other studies at this same location (Gillen et al. 1991).
Vegetation response to grazing system was also minimal in this study. Our emphasis was on changes due to management treat- ments that occurred over time. Rotation grazing had no positive impact on the standing crop or relative contribution of any major vegetation component over the study period compared to continu- __
Fig. 6. Standing crop of shortgrasses as affected by the interaction of ous grazing. Any effects of grazing system were present at both
grazing system, stoebing rate, and year (P < 0.01). the beginning and end of the study. It could be suggested that
higher standing crops of the desirable tallgrasses in rotation pas- tures at the end of the grazing season would eventually translate into higher vigor and greater relative contributions of these species over time. This did not occur over the 5 years of our study. Shortgrasses were the only component affected by rotation grazing. Rather than diverging, the shortgrass component in the rotation pastures became more similar to that in the continuous pastures over time.
The standing crop of all major vegetation components, includ- ing forbs, declined as stocking rate increased. This was expected as greater numbers of animals translated into higher total forage consumption. The relative contribution of big bluestem, indian- grass, and switchgrass also declined as stocking rate increased which suggested that these species were preferred by livestock.
Few changes were attributed to stocking rate over time. Relative composition of switchgrass increased over years at lower stoek- ing rates. Standing crop of big bluestem and indiangrass and forbs decreased over time at lower stocking rates.
Weather conditions were generally favorable during the study period. Results may be different under more stressful precipitation
patterns. Two years of spring burning during the study period would also be considered a positive influence on the dominant tall- grasses (Towne and Owensby 1984). In addition, all experimental pastures were in high seral condition when the study was initiated.
This would give the pastures the potential to withstand greater stress before showing significant shifts in relative composition.
Literature Cited
Booysen, P.V. and Tainton, N.M. 1978. Grassland management: princi- ples and practice in South Africa, p. 551-554. In: D.N. Hyder (cd.):
Proc. First Int. Rangeland Congr., Sot. for Range Management, Denver, Colo.
Cassels, D-M., R.L. Gillen, F.T. McCollum, K.W. Tate, and M.E.
Hodges. 1995. Effects of grazing management on standing crop dynamics in tallgrass prairie. J. Range Manage. 4881-84.
Denny, RP., D.L. Barnes, and T.C.D. Kennan. 1977. Trials of multi- paddock grazing systems on veld 1. An exploratory trial of systems involving twelve paddocks and one herd. Rlmd. J. Agr. Res. 15:1 l-23.
Dwyer, D.D. 1961. Activities and grazing preferences of cows with calves in northern Osage County, Oklahoma. Oklahoma Agr. Exp. Sta.
Bul. B-588.
E&on, L. 1960. Influence of grazing on plant succession of rangelands.
Bot. Rev. 26: l-78.
Giien, RL. and E.L. Smith. 1986. Evaluation of the dry-weight-rank method for determining species composition in tallgrass prairie. J.
Range Manage. 39:283-285.
Giien, RL., D. Rollins, and J.F. Stritzke. 1987. Atrazine, spring bmn- ing, and nitrogen for improvement of tallgrass prairie. J. Range Manage. 40:4&l-447.
Giien, RL., F.T. McCoilum, M.E. Hodges, J.E. Brummer, and K.W.
Tate. 1991. Plant community responses under short duration grazing in taUgrsss prairie. J. Range Manage. 44:124-128.
Hart, R.H., MJ. Samuel, P.S. Test, and M.A. Smith. 1988. Cattle, vegetation, and economic responses to grazing systems and grazing pressure. J. Range Manage. 41:282-286.
Herbel, C.H. and K.L. Anderson. 1959. Response of ttue prairie vege- tation on major Flint Hills range sites to grazing treatment. Ecol.
Mono. 29:171-186.
Howeii, L.N. 1978. Development of multi-camp grazing systems in the Southern Orange Free State, Republic of South Africa. J. Range Manage. 3 1:459-465.
Launchbaugb, J.L. 1967. Vegetation relationships associated with intensity of summer grazing on a clay upland range site in the Kansas 20-to 24-inch precipitation zone. Kansas Agr. Exp. Sta. Tech. Bull.
154.
McIlvain, E.H. and D.A. Savage. 1951. Eight-year comparison of con- tinuous and rotational grazing on the Southern Plains Experimental Range J. Range Manage. 4:42-47.
Merrill, J. 1983. The XXX Ranch: managing range for ecology and economy, p. 86-95. In: 1983 Yearbook of Agriculture. U.S. Dept. Agr.
Myers, H.R. 1982. Climatological data of Stillwater, Oklahoma 1893-1980. Oklahoma Agr. Exp. Sta. Rep. P-821.
Neter, J. and W. Wasserman. 1974. Applied linear statist.icaJ models.
R. D. Irwin, Homewood, Ill.
Owensby, C.E., R. Co&ran, and E.F. Smith. 1988. Stocking rate effects on intensively-early stocked Flint Hills bluestem range. J.
Range Manage. 41:483-487.
Oweusby, C.E., E.F. Smith, and K.L. Anderson. 1973. Deferred-rota- tion grazing with steers in the Kansas Flint Hills. J. Range Manage.
26:39>395.
Pitts, J.S. and F.C. Bryant. 1987. Steer and vegetation response to short duration and continuous grazing. J. Range Manage. 40:38&389.
SAS Institute, Inc. 1985. The GLM procedure, pp. 183-260. In: S.P.
Joyner (ed.). SAS/STAT Guide for Personal Computers, Version 6 Edition. Gary, NC.
Savory, A. 1978. A holistic approach to ranch management using short duration grazing, p. 555-557. In: D. N. Hyder (ed.). Proc. First Int.
Rangeland Congr., Sot. for Range Management, Denver, Colo.
Sims, P.L. and D.D. Dwyer. 1965. Pattern of retrogression of native vegetation in north central Oklahoma. J. Range Manage. 18:2B-25.
Thurow, T.L., W.H. Blackburn, and ,C.H. Taylor, Jr. 1988. Some vegetation responses to selected livestock grazing strategies, Edwards Plateau, Texas. J. Range Manage. 41:108-114.
Towne, and C. E. Owensby. 1984. Long-term effects of annual burning at different dates in ungrazed Kansas tallgrass prairie. J. Range Manage. 37:393-397.
White, M.R, RD. Pieper, G.B. Donart, and L. White Trifaro. 1991.
Vegetational response to short-duration and continuous grazing in south-central New Mexico. J. Range Manage. 44:399-3.