68:2 (2014) 29–37 | www.jurnalteknologi.utm.my | eISSN 2180–3722 |
Full paper
Jurnal
Teknologi
Jurnal
Full paper
Teknologi
Constructing an Adoption Model for e-Government Services
Maziar Shajaria*, Zuraini Ismailb
aDepartment of Computer, Islamic Azad University - Dehaghan Branch, Esfahan, Iran
bAdvanced Informatics School, Universiti Teknologi Malaysia, International Campus, Kuala Lumpur, Malaysia
*Corresponding author: [email protected]
Article history
Received :1 December 2013 Received in revised form : 10 January 2014
Accepted :31 January 2014
Graphical abstract
Abstract
The frequent use of Government services and the ability of the government to successfully implement e-Government to match the needs of the citizens remain to be understood. The purpose of this study is to construct an adoption model for the e-Government services by considering renowned technology adoption models. This model considered trustworthiness in shaping the adoption model. To test the model, questionnaire was designed, adapted from previous studies which were distributed to employees of public organizations in Esfahan, Iran. The proposed model was thoroughly analyzed using Structured Equation Modeling (SEM). The new adoption model modified and the final model consist of ten constructs including intention to use, trustworthiness, perceived usefulness, perceived ease of use, compatibility, social influence, job relevant, output quality, and image. The results affirmed that relationships between the model variables suggested good model fit. The fitted model of this study may be applied to other e-Government services of other countries.
Keywords: Adoption of e-Government services; information technology adoption; trustworthiness; intention to use; structured equation modeling
Abstrak
Penggunaan kerap perkhidmatan e-Kerajaan dan keupayaan kerajaan untuk berjaya melaksanakan e-Kerajaan untuk dipadankan dengan keperluan rakyat kekal difahami. Tujuan kajian ini adalah untuk membina sebuah model penerimaan untuk perkhidmatan e-Kerajaan telah mengambil kira semua model penerimaan teknologi yang terkenal. Model ini menyokong ciri kepercayaan dalam membentuk model adopsi. Untuk menguji model, soal selidik telah direka, mengambil kira kajian sebelum ini dan diedarkan kepada pekerja organisasi awam di Esfahan, Iran. Model yang dicadangkan ini telah dianalisis menggunakan pemodelan persamaan berstruktur (SEM). Model adopsi baru ini telah diubahsuai dan model muktamat terdiri daripada sepuluh konstruk iaitu niat menggunakan, ciri kepecayaan, tanggapan kegunaan, tanggapan mudah diguna, keserasian, pengaruh sosial, pekerjaan yang berkaitan, kualiti output, dan imej. Keputusan mengesahkan bahawa hubungan antara pemboleh ubah model mencadangkan model patut baik. Model tersebut boleh digunakan untuk lain-lain perkhidmatan e-Kerajaan negara-negara lain.
Kata kunci: Adopsi perkhidmatan e-Kerajaan; penerimaan teknologi maklumat; ciri kepercayaan; niat menggunakan; pemodelan persamaan berstruktur
2014 Penerbit UTM Press. All rights reserved.
1.0 INTRODUCTION
Governments typically play a major role in administrating societies and people's use of the Internet in many aspects of their lives. They offer services to their citizens and as technology advances, they use new innovations to offer better services to the citizens (Ahmad et al., 2013). The introduction of new technological innovations occurs at an exceptional rate (Hedman and Gimpel, 2010) and government services use these technologies. A survey in 2012 shows that almost all countries in the world use Internet and communication technologies (ICTs) in their governments to serve their citizens and only a few countries
2003) and Diffusion of Innovations (DOI) (Rogers, 2003). Due to the imperative reason, this study is carried out to identify influencing factors that lead towards a successful adoption of e-government services.
2.0 BACKGROUND OF THE STUDY
One of the main adoption models was Technology Acceptance Model (TAM) which remains to be the underlying model for technology adoption (Davis et al., 1989). Since then TAM2 introduces ‘Perceived Usefulness’ and ‘Perceived Ease of Use’ (Venkatesh et al., 2003) further presented another important adoption model known as Unified Theory of Acceptance, and Use of Technology (UTAUT), introducing ‘Intention to Use’. A more parsimony model was proposed, known as Diffusion of Innovations (DOI) suggested ‘innovations’ (Rogers, 1995). Despite these efforts, researchers are still investigating on a comprehensive adoption model as none of these models were commonly accepted (Shajari and Ismail, 2010).
On one hand, adoption of new e-Government services is becoming more important due to the fact that new technologies and new e-Government services are introduced in a rapid pace (Cui et al., 2009). On the other hand, for success rate of adopting e-Government initiatives greatly depends upon citizens’ eagerness to adopt their services (Carter and Belanger, 2005). Therefore, identifying the factors influencing the adoption of e-Government services is essential for any governments.
The next section reviews the various adoption models, investigating the possible factors. The development of the proposed model is then established in section four. In section five, a quantitative approach was applied to answer the study’s objective. A rigorous analysis on the collected data was executed using Structured Equation Modeling portrayed in section six. Consequently, section seven realized the final model. Lastly, section eight discusses and concludes the study.
3.0 EXISTING TECHNOLOGY ACCEPTANCE MODEL
3.1 Technology Acceptance Model
Technology Acceptance Model (TAM) is much referred to IT adoption models. Attention was given to Perceived Usefulness (PU) and Perceived Ease of Use (PEU) and how they influence one’s attitude towards system usage. Consequently, behavioural intention to use a system, was also considered in determining actual system usage (Davis et al., 1989). TAM claims that IS usage has direct relation with Behavioral Intention. Two independent factors of TAM are able to explain the user’s initial attitude toward adopting of technologies, but these two factors have limitations (Conrad, 2009). TAM obviously is simple and does not cover the complexities of users’ behavior. These limitations lead to other studies, which extended the TAM leading to a more comprehensive model.
3.2 The Extended Technology Acceptance Model
The extension of TAM, TAM2 suggested ‘Perceived Usefulness’, which are influenced by Subjective Norm (SN), Image (IMG), Job Relevant (JR), Output Quality (OQ), Result Demonstrability (RD). Two moderators were implied, namely Experience and Voluntariness. The model omitted ‘attitude toward using’ since they were found to be weak predictors on behavioural Intention To Use (ITU) and actual system usage (Venkatesh and Davis, 2000). Experience and Voluntariness were
included as moderating factors of subjective norm (Venkatesh and Davis, 2000). Therefore, TAM2 is an adoption model that considered more constructs, and as it was tested it seemed to be more comprehensive than TAM.
3.3 Unified Theory of Acceptance and Use of Technology (UTAUT)
The Unified Theory of Acceptance and Use of Technology (UTAUT) model was a derivative from previous models such as TAM, Theory of Reasoned Action (TRA), Motivational Model (MM), Theory of planned Behavior (TPB), Combined TAM-TPB, Model of PC Utilization (MPCU), Innovation Diffusion Theory (IDT), and Social Cognitive Theory (SCT) (Venkatesh et al., 2003). The models were commonly used to study about the users’ adoption and acceptance of new innovations.
The most important factors from the eight models mentioned above were chosen to present a comprehensive model (Datta, 2011), which can be seen as a new version of TAM (Rana et al., 2013), which was proven to be more comprehensive (Datta, 2011) explaining user intention to use an information system.
3.4 Diffusion of Innovations (DOI)
The Diffusion of Innovations (DOI) theory was proposed and developed by a sociologist to describe how an innovation diffuses through a society (Conrad, 2009). This theory is popular, and has been used widely to explain the adoption of IT innovations in an organization or society. The rate of diffusion of innovation is affected by five attributes namely; Relative Advantage, Compatibility, Complexity, Trialability, and Observability (Rogers, 2003).
3.5 Trustworthiness
Several studies (Grabner-Krauter et al., 2006, Pavlou, 2003) had concluded trustworthiness constructs as the factors that impede adoption of e-Government. Trustworthiness is defined as “the perception of confidence in the electronic marketer’s reliability and integrity” (Belanger et al., 2002). For online services, users must trust the vendor of the service and also the technology which the vendor uses. Users will only adopt the e-Services which they trust (Grabner-Krauter et al., 2006, Chee-Wee et al., 2005, Salam
et al., 2005).
Therefore, for e-Government services, users must have reasonable trust towards the government as the provider of the service i.e. Trust of the Government (TOG). Furthermore, the internet as the technology the government uses to offer its services i.e. ‘Trust of the Internet’ (Pavlou, 2003). Trust of the Internet (TOI) refers to an “individual’s perceptions of the institutional environment, including the structures and regulations that make an environment feel safe” (McKnight et al., 1998). TOG is defined “one’s perceptions regarding the integrity and ability of the agency providing the service”(Carter and Belanger, 2005). Thus, for e-Government’s service adoption to be elevated, it is necessary for the users to be confident about the service provider’s.
4.0 PROPOSED MODEL
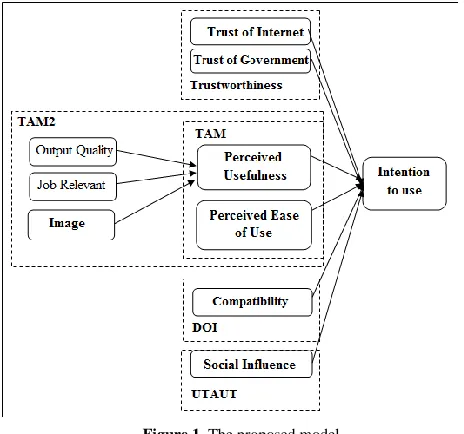
Based on TAM2, UTAUT, DOI and Trustworthiness a theoretical model is proposed for adoption of e-Government services. This model is illustrated in Figure 1.
There are nine independent factors which are included in the proposed model. These factors were chosen based on the
literature reviewed. The dependent variable is Intention to Use (ITU). Intention to Use is considered as a strong predictor of actual system usage in many studies (Venkatesh et al., 2003). PEU, PU, COM, SI, IMG, JR, OQ, TOI, and TOG are the factors influencing ITU. These factors were chosen because their relationships with ‘intention to use’ were proven positively in several studies.
Specific studies (Conrad, 2009, Davis, 1989, Lee et al., 2003) on new technology innovations concluded that PU is a key influencing factor on the Intention to Use. Cost and time saving were found to be influencing factors for usefulness (Ozgen and Turan, 2007). Consequently, in this study, PU is considered important and is used in the proposed model.
Horton et al. (2001) concluded that PEU is the key variable in TAM. In addition, to explain the adoption of information systems in organizations, PEU was considered very important in a number of other studies (Davis, 1989, Carter and Belanger, 2005, Lee et al., 2003, Gefen et al., 2003).
OQ influences Intention to Use indirectly. This factor directly impacts on the Perceived Usefulness. There are several studies indicating the importance of OQ in adoption of the new technology users (Moore and Benbasat, 1991, Tassabehji and Elliman, 2006, Sang and Lee, 2009).
JR was selected from TAM2 as this factor impact indirectly on the Intention to Use and directly on the Perceived Usefulness. There is several studies (Cheng et al., 2008, Anderson et al., 2006) indicating that this factor is important for the users to adopt a new technology.
In a study done in a developing country (Tajudeen and Liman, 2011) supports Image has an impact on emerging technology adoption. There are several other studies (Gefen et al., 2003, Anderson et al., 2006, Park et al., 2007, Horst et al., 2007, Spaulding, 2010) which stated that Image have significant relation with the adoption of the users.
Sumak et al. (2010) argued that the Social Influence has a significant impact on adoption of new electronic innovations. In addition, Venkatesh et al. asserted that as developing countries compete with developed countries, Social Influence is considered in those environments (Venkatesh et al., 2003). Moreover, in many developing countries, people try to adopt the culture and technology from the developed countries (Datta, 2011).
From this point of view, people’s behavior in developed countries, their perception of new technologies, and their consideration about other people’s adoption are important for people in developing countries. Furthermore, there are other studies (Tassabehji and Elliman, 2006, Cheng et al., 2008, Anderson et al., 2006, Park et al., 2007, Marchewka et al., 2007, Guo and Barnes, 2007), which show that SI is an important factor influencing the adoption of users.
Similarly, myriad researchers (Datta, 2011, Grabner-Krauter
et al., 2006, Hu and Bentler, 1999, Byrne, 2010, Kline, 2011) identified Compatibility as a significant factor in adoption decision of users.
Trust has been tested as a factor for adoption of IT users, for example, Spaulding (2010) details that Trust plays a role on the adoption of consumers in virtual communities. In addition, many recent studies show that Trustworthiness is the main factor influencing the adoption of e-Government users (Carter and Belanger, 2005, Tassabehji and Elliman, 2006, Cheng et al., 2008, Horst et al., 2007, Carter, 2008, Gilbert and Balestrini, 2004, Lean et al., 2009), presenting significant relation between trust and use of e-Government services (Tolbert and Mossberger, 2006, Srivastava and Thompson, 2005). Consequently, Trust of Internet and Trust of Government are included in this study as influencing factors of adoption with e-Government services setting.
PU, PEU, OQ, JR and IMG were selected from TAM2. Furthermore, TOI and TOG were chosen as two important aspects of Trustworthiness model. In addition, COM from DOI and SI from UTAUT were added to complete the model. The suggested adoption factors must be examined to find out if they are proper for these organizations. All the mentioned constructs were considered in constructing the proposed model.
5.0 QUANTITATIVE APPROACH
5.1 Census Data of the Geographical Location of the Study
Esfahan is located about 340 km south of the capital city (Tehran) and is Iran's second-largest city. Esfahan's public organizations, as the capital of one of the major provinces in Iran, were chosen for data gathering. Only organizations with fully implemented E-Government services are considered in this survey.
5.2 The Chosen Sampling Frame
The unit of analysis comprised of employees in the public organizations. From the 46 major administrative organizations in Esfahan, only fifteen (15) public organizations agreed to participate in the survey. The adequate sample size was calculated according to the Kukran formula (Hair et al., 2009). Based on this, the minimum number of respondents was calculated to be 271. In total, 320 questionnaires were distributed in 15 public organizations. 290 questionnaires were returned, giving a favorable response rate of 90.6%. However, 283 questionnaires were valid for further analysis.
5.3 Questionnaire Design
In designing the survey instrument, the use of e-government services was measured with Carter and Belanger’s use intentions construct (Carter and Belanger, 2005). The independent variables of TOI, TOG, PU, COM, and PEU were measured with constructs from the instrument developed by Carter and Belanger. The other independent variables IMG, SI, and OQ were measured
with the constructs from the instrument developed by Venkatesh and Davis (Venkatesh and Davis, 2000). The questionnaire layout consists of several sections. The first section gathers the demographic information such as age, education level, sex and experience. In the next sections, employees who had e-Government services in their departments were asked about the impacting factor on their intention to use the services. The questionnaire can be found in Appendix A.
The measurement used a 5-point Likert scale ranged from “1” for “strongly disagree” to “5” for “strongly agree”. The drafted questionnaire was reviewed by two professionals in the area of information systems. The first review involved several comments on the format of the questionnaire; such as the color of the pages and unnecessary information that were addressed. As the survey was carried out in a non-English speaking country, a second review is necessary to verify clarity after translation to the Persian language.
5.4 Pilot Study
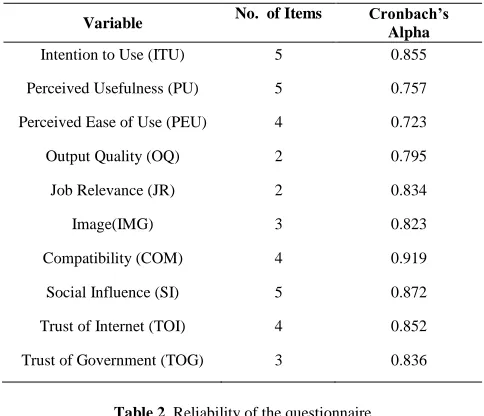
For the pilot study, fifty (50) revised questionnaires were distributed randomly in public organizations. After a week, thirty one (31) questionnaires were returned, and they were used in the pilot study. Statistical Software SPSS (16.0) was used to estimate the reliability of the questionnaire. Each item was tested separately, and it was found that all inter-correlations exceed 0.30 and item-to-total correlations exceed 0.50, which shows acceptable values for the pilot study and indicates good values to continue the data-gathering. The Cronbach’s Alpha value was calculated depicted in Table 1.
Table 1 Reliability of each item in the questionnaires (pilot test)
Variable No. of Items Cronbach’s Alpha
Intention to Use (ITU) 5 0.855
Perceived Usefulness (PU) 5 0.757
Perceived Ease of Use (PEU) 4 0.723
Output Quality (OQ) 2 0.795
Job Relevance (JR) 2 0.834
Image(IMG) 3 0.823
Compatibility (COM) 4 0.919
Social Influence (SI) 5 0.872
Trust of Internet (TOI) 4 0.852
Trust of Government (TOG) 3 0.836
Table 2 Reliability of the questionnaire
Cronbach’s Alpha Number of items
0.826 37
Table 2 further represents the average Cronbach’s Alpha that reads 0.826, which exceeds the recommended level of 0.70 showing high internal consistency reliability.
6.0 FURTHER ANALYSIS USING SEM
To test the study question, multiple regression and factor analysis must be used. Structure Equation Model (SEM) recently has been
regarded as an alternative for multiple regression, path analysis, factor analysis, and analysis of covariance.The SEM method is a method of examining the relation between these variables (Conrad, 2009, Teo, 2010).
An observed variable can be seen and measured easily (e.g., age, height or cost), while a latent variable cannot be observed by the researcher or cannot get a measurable value (e.g., satisfaction, trust or success). SEM is capable of modeling the independent and dependent variables’ relationship at the same time. Furthermore, a great advantage of SEM is that it can examine the structural and measurement model simultaneously. The original proposed adoption model has been based on literature review and must be tested using Confirmatory Factor Analysis (CFA). Firstly, the model must be examined against the obtained measurement data for the model fit indices' values to ensure that the model is well fitted. Researchers use the measurement theories in order to perform the measurements reliably and with a valid method (Hair et al., 2009). Only a fitted model can be used to validate the relations between the variables. Hence, AMOS Ver. 8.0 was used to further examine the proposed model.
6.1 Missing Data Treatment
In SEM, missing data problem needs to addressed with the list-wise deletion or pair-list-wise deletion methods. As the sample size is 283, and 37 items in questionnaire, the missing data was found to be less than 0.05 percent. Using the mean value was recommended as the missing data rate was not high (Hair et al., 2009).
6.2 Outlier Detection Treatment
In preparation for data analysis, it was necessary to detect the outlier data. The Mahalanobis Distance Statistic test is normally used to find the outliers. To perform the test, this study used SPSS software. This study excluded 15 outliers comparing the Mahalanobis Distance with the chi-squared distribution table. Therefore, the number of questionnaires reduced to 268 from the 283.
6.3 Preparation for Model Fit
Table 3 delineated four factors, which have good model fit indicators. These factors are denoted by ITU, PU, IMG and TOI. The normal Chi-squares for all of the four factors have values less than 3, which showed a good model fit. Furthermore, Adjusted Goodness of Fit Index (AGFI), Comparative Fit Index (CFI), and Tucker Lewis Index (TLI) are more than 0.9. This indicated that all the items in these constructs are well-correlated, hence model modifications is not necessary. In addition, Table 4 illustrated several indicators which presented unacceptable model fits. The factors are PEU, SI, TOG and COM. These factors need some modifications.
Table 3 Model fit indices before modifications
For PEU the normal Chi-Square is 20.813 and CFI, TLI and AGFI are less than 0.9 while Root Mean Square Error of Approximation (RMSEA) is greater than 0.08, which indicates the model is not fitted. Therefore, the other indices must be checked to find the improper item or relation. The standardized regression weight and factor score weight were first checked before the modification indices. The analysis shows that PEU3 and PEU4 present the same concepts. To continue the analysis, PEU3 was deleted as a repeated item. After modification, the model fit values show the values of normal Chi-Square decreases to 0.015 and at the same time TLI, RMSEA and CFI values changed to good model fit values, which show a very good model fit.
Table 4 Model fit indices after modifications
SI was the next variable with unacceptable model fit indices. To perform the needed modifications, factor analysis was performed. The factor score weights show that SI2 and SI3 are illustrating the same concept. Furthermore, Standardized Regression Weights show a slight difference between these two items. Considering the modification indices, SI2 was deleted from the model items. The results are presented in Table 4. The values after the modification show that after deleting the SI2, the model fit values are acceptable.
TOG of Government was the next tested variable. The values for AGFI, TLI and CFI are found to be acceptable and the normalized Chi-Square is less than 5, which is acceptable. However, the value of RMSEA is greater than 0.08, suggesting further modification. The modification indices showed that there is covariance between e1 and e2 in the model and connecting these two items would lead us to a better model fit without changing the model or omitting an item.
The modified model shows a very good model fit as the normal Chi-Square value is near zero and TLI, AGFI and CFI are all more than 0.9. The RMSEA is less than 0.08, and there are good model fit values. The last analyzed variable is COM. As it is illustrated in Table 4 TLI, CFI and AGFI have good values for the model fit but normal Chi-Square, and RMSEA values are slightly high. To have a good model fit, the modification indices were reviewed. The modifications indices show that e1 and e3 have covariance and can be correlated with each other.
It is obvious that after modification, the model fit for COM variable is acceptable and can be used in the final model. The normal Chi-Square is 0.567, which is less than 3 and TLI; AGFI and CFI are all more than 0.9. Furthermore, RMSEA is 0, which indicates a very good value, and it is less than 0.08 (Table 4). Job Relevant and Output Quality are the two variables that have only two items. While their items are less than three, it is not recommended to be tested by AMOS. Therefore, to be confident about item relevance, the items were qualified by checking them by the professionals in the area. In addition, they were tested for covariance between the items.
After the modifications, the constructs can be used in the final model, and it will be used for the last model fit test. For all the variables, the correlation scores and factor scores were tested. Variable scales for all items were good enough to continue the process of analysis, and no more items were deleted. The next and final step was to analyze the proposed model with all items.
6.4 Model Fit for Proposed Model
A good fit model has many fit indices that are introduced by various scientists but these indices should not be used together. The three most important indicators presenting the model fit are normal Chi-Square, RMSEA and CFI (Hair et al., 2009).
Construct CMIN /df
P-Value
AGFI RMSEA CFI TLI
ITU 1.940 0.084 0.957 0.059 0.988 0.976
PU 2.068 0.066 0.955 0.063 0.982 0.963
PEU 0.015 0.903 1 0.0 1 1.017
IMG 2.2 0.138 0.967 0.67 0.995 0.984
SI 1.304 0.271 0.975 0.034 0.998 0.994
TOI 2.599 0.107 0.961 0.077 0.995 0.986
TOG 0.008 0.931 1 0 1 1.012
COM 0.567 0.452 0.989 0 1 1.006
Construct CMIN/df
P-Value AGFI RMSEA CFI TLI
ITU 1.940 0.084 0.957 0.059 0.988 0.976 PU 2.068 0.066 0.955 0.063 0.982 0.963 PEU 20.813 0.000 0.618 0.272 0.858 0.574 IMG 2.2 0.138 0.967 0.67 0.995 0.984 SI 5.644 0.000 0.888 0.132 0.956 0.912 TOI 2.599 0.107 0.961 0.077 0.995 0.986 TOG 3.776 0.023 0.928 0.102 0.988 0.965 COM 5.095 0.006 0.912 0.124 0.980 0.941
The normal Chi-Square is less dependent on the sample size and is obtained by dividing the Chi-Square by the degree of freedom. A value less than 2.0 indicates a very good model fit and a number smaller than 5.0 is acceptable. Many others asserted that a value below 3.0 is fair enough for the normal Chi-Square (Kline, 2011). AGFI is another important indicator of the model fit that must have a value between 0 to 1. The AGFI value should be at or above 0.80 for a good model fit.
Furthermore, this study focuses on RMSEA and CFI to test the model. These indicators exhibit acceptable levels of the model fit (Hair et al., 2009). RMSEA is a very popular measure of the model fit, and it is a measure less affected by the sample size. If the RMSEA value is less than 0.08, there will be adequate fit. Hu and Bentler (1999) have suggested that if RMSEA is less than 0.06 the model fit is good.
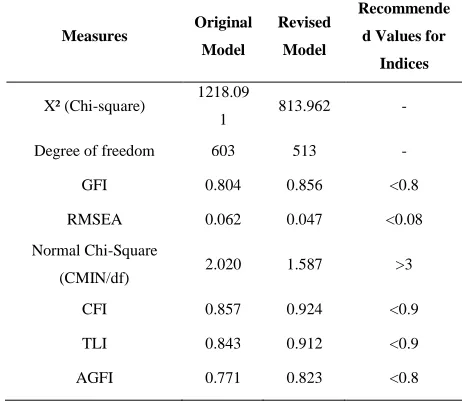
Referring to Table 4, the values shown are measures before and after modifications. The RMSEA for the proposed model is 0.047, which is less than 0.06 indicating a good model fit. Table 5 shows measure values for the model before and after the modifications. Comparing the values show that after the modifications, all the model fit measures have better values, and the model is acceptable.
7.0 THE FINAL MODEL
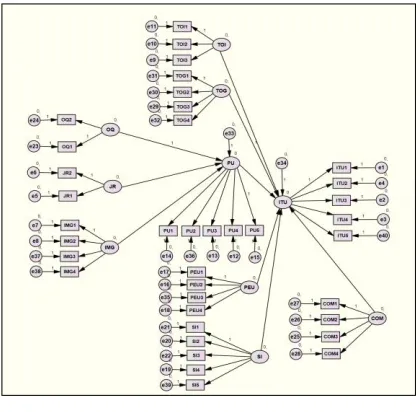
After the modifications of the constructs, the model fit indices were found to be acceptable. Figure 3 depicts the modified model, while Figure 4 illustrates the final model after modification.
Table 5 illustrates measured values for the model before and after the first stage of modification. Comparing the values that emerged after the modifications, almost all the model fit measures have more acceptable values, and these results reveal strong overall support for the model. The simple modified model can be seen in Figure 4.
Measures Original Model
Revised Model
Recommende d Values for Indices
X² (Chi-square) 1218.09
1 813.962 -
Degree of freedom 603 513 -
GFI 0.804 0.856 <0.8
RMSEA 0.062 0.047 <0.08
Normal Chi-Square
(CMIN/df) 2.020 1.587 >3
CFI 0.857 0.924 <0.9
TLI 0.843 0.912 <0.9
AGFI 0.771 0.823 <0.8
8.0 DISCUSSION AND CONCLUSION
Garnering perceived benefits from the use of e-Government services has compelled many governments to invest in implementing e-Government services. After implementing the services, many governments are faced with new problems. The actual benefits were reported as not to satisfy the predicted benefits. Hence, many e-Government services were marked as less successful in practice.
The results of this study offer strong overall support for the model. Additionally, it illustrated that the adapted model can be used as an adoption model in public organizations for e-Government services. Although the model was found applicable to the adoption of e-Government services, the relation between the model factors and intention to use are yet to be further analyzed. However, there are limitations to the presented findings. First the survey data, predominantly empirical based study, were collected from organizations of a specific country. A
Figure 3 Modified model
Figure 4 Final model after modifications
qualitative design involving in-depth interviews may suggest a variation to the result. Secondly, the unit of analysis are from government employers’ perspective. Views from the general public or e-Government services users may provide an alternative landscape to this study. These two reasons findings may not necessarily be applied to other replications. Organization and societal may provide a variation to the results portrayed in this study.
The future work need to proceed in testing the relations between the constructs and also using the model for other groups of users. This may assist government organizations’ managers towards a better implementation of e-Government services in preparation of promoting better adoption.
Acknowledgement
This research received no specific grant from any funding agency in the public, commercial, or non- profit sectors. Special thanks to Universiti Teknologi Malaysia (UTM) for the support in this research.
References
[1] Ahmad, M. O., Markkula, J. and Oivo, M. 2013. Factors Afecting E-Government Adoption in Pakistan: A Citizen’s Perspective.
Transforming Government: People, Process and Policy. 7(2): 225–239.
[2] Hedman, J. and Gimpel, G. 2010. The Adoption of Hyped Hechnologies:
A Qualitative Study. Information Technology and Management. 11(4):
161–175.
[3] United Nations E-Government Survey 2012: E-Government for the
People, United Nations Department of Economic and Social Affairs. New York. 2012.
[4] Conrad, E. 2009. Willingness to Use IT Innovations: A Hybrid
Approach Employing Diffusion of Innovations and Technology Acceptance Models. Ph.D. Thesis. Management. Southern Illinois University at Carbondale. Illinois, USA.
[5] Davis, F. D. 1989. Perceived Usefulness, Perceived Ease of Use and
User Acceptance of Information Technology. MIS Quarterly. 13: 319–
330.
[6] Venkatesh, V. and Davis, F. D. 2000. A Theoretical Extension of the Technology Acceptance Model: Four Longitudinal Field Studies.
Management Science. 45(2): 186–204.
[7] Venkatesh, V., Morris, M., Davis, G. B. and Davis, F. D. 2003. User
Acceptance of Information Technology: Toward a Unified View. MIS
Quarterly. 27(3): 425–478.
[8] Rogers, E. M., 2003. Diffusion of Innovations. New York: Free Press.
[9] Davis, F. D., Baggozzi, R. P. and Warshaw, P. R. 1989. User Acceptance
of Computer Technology: a Comparison of Two Theoritical Models.
Management Science. 35(8): 982–1003.
[10] Rogers, E. M., 1995. Diffusion of Innovations. New York: Free press. [11] Shajari, M. and Ismail, Z. 2010. A Comprehensive Adoption Model of
e-Government Services in Developing Countries, Presented at the 2010
IEEE International Conference on Advanced Management Science
(ICAMS). Chengdu.
[12] Cui, G., Bao, W. and Chan, T.-S. 2009. Consumers’ Adoption of New Technology Products: The Role of Coping Strategies. Journal of
Consumer Marketing. 26(2): 110–120.
[13] Carter, L. and Belanger, F. 2005. The Utilization of E-Government Services: Citizen Trust, Innovation and Acceptance Factors. Information Systems Journal. 15(1): 5–25.
[14] Venkatesh, V. and Davis, F. 2000. A Theoretical Extension of the Technology Acceptance Model: Four Longitudinal Field Studies.
Management Science. 45(2): 186–204.
[15] Datta, P. 2011. A Preliminary Study of E-Commerce Adoption in Developing Countries. Information Systems Journal. 21(1): 3–32. [16] Rana, N. P., Dwivedi, Y. K. and Williams, M. D. 2013. Evaluating
Alternative Theoretical Models for Examining Citizen Centric Adoption
of E-Government. Transforming Government: People, Process and
Policy. 7(1): 27–49.
[17] Grabner-Krauter, S., Kaluscha, E. A. and Fladnitzer, M. 2006. Perspectives of Online Trust and Similar Constructs: A Conceptual
Clarification, Presented at the 8th International Conference on Electronic Commerce: The New e-Commerce: Innovations for Conquering Current Barriers, Obstacles and Limitations to Conducting Successful Business on the Internet. Fredericton, Canada.
[18] Pavlou, P. A. 2003. Consumer Acceptance of Electronic Commerce: Integrating Trust and Risk with the Technology Acceptance Model. International Journal of Electronic Commerce. 7(3): 69–103. [19] Belanger, F., Hiller, J. and Smith, W. 2002. Trustworthiness in
Electronic Commerce: The Role of Privacy, Security, and Site Attributes. Journal of Strategic Information Systems. 11(3/4): 245–270. [20] Chee-Wee, T., Shan-Ling, P. and Lim, E. T. K. 2005. Towards the Restoration of Public Trust in Electronic Governments: A Case Study of the e-Filing System in Singapore., Presented at the 38th Hawaii International Conference on System Sciences. Honolulu, HI.
[21] Salam, A. F., Iyer, L., Palvia, P. and Singh, R. 2005. Trust in
e-Commerce. Communications of the ACM. 48(2): 72–77.
[22] McKnight, D. H., Cummings, L. L. and Chervany, N. L. 1998. Initial Trust Formation in New Organizational Relationships. Academy of
Management Review 23(3): 473–490.
[23] Lee, Y., Kozar, K. and Larsen, K. 2003. The Technology Acceptance Model: Past, Present & Future. Communications of the Association for Information Systems. 12: 752–780.
[24] Ozgen, F. B. and Turan, A. H. 2007. Usage and Adoption of Online Tax Filing and Payment System in Tax Management: An Empirical Assessment with Technology Acceptance (TAM) Model in Turkey, Presented at the 9th International Scientific Conference, Management Horizons: Visions and Challenges. Kaunas.
[25] Horton, R., Buck, T., Waterson, P. and Clegg, C. 2001. Explaining
Intranet Use with Technology Acceptance Model. Journal of
Information Technology. 16: 237–249.
[26] Gefen, D., Karahanna, E. and Straub, D. W. 2003. Trust and TAM in Online Shopping: An Integrated Model. MIS Quarterly. 27(1): 51-90. [27] Moore, G. and Benbasat, I. 1991. Development of an Instrument to
Measure the Perceptions of Adopting an Information Technology Innovation. Information Systems Research. 2(3): 173–191.
[28] Tassabehji, R. and Elliman, T. 2006. Generating Citizen Trust in e-Government Using a Trust Verification Agent: A Researcher Note,
Presented at the European and Mediterranean Conference on
Information Systems (EMCIS). Costa Blanca, Alicante, Spain [29] Sang, S. and Lee, J. D. 2009. A Conceptual Model of e-Government
Acceptance in Public Sector, Presented at the Third International Conference on Digital Society.
[30] Cheng, D., Liu, G. and Qian, C. 2008. On Determinants of User Acceptance of Internet Banking: A Theoretical Framework and
Empirical Study, Presented at the Advanced Management of Information
for Globalized Enterprises (AMIGE 2008). Tianjin
[31] Anderson, J. E., Schwager, P. H. and Kerns, R. L. 2006. The Drives for Acceptance of Tablet PCs by Faculty in a College of Business. Journal of Information Systems Education. 17(4): 429–440.
[32] Tajudeen, S. A. and Liman, M. A. 2011. Structural Equation Modelling Analysis: Factor Influencing Technology Use in Nigeria Universities. Interdisciplinary Journal of Contemporary Research in Business. 3(3): 1230–1243.
[33] Park, J. K., Yang, S. J. and Lehto, X. R. 2007. Adoption of Mobile
Tchnologies for Chinese Consumers. Journal of Electronic Commerce
Research. 8(3): 196–206.
[34] Horst, M., Kuttschreuter, M. and Gutteling, J. M. 2007. Perceived Usefulness, Personal Experiences, Risk Perception and Trust as Determinants of Adoption of E-Government Services in The
Netherlands. Computers in Human Behavior. 23(4): 1838–1852.
[35] Spaulding, T. J. 2010. How Can Virtual Communities Create Value for
Business? Electronic Commerce Research and Applications,. 9(1): 38–
49.
[36] Šumak, B., Polančič, G. and Heričko, M. 2010. An Empirical Study Of Virtual Learning Environment Adoption Using UTAUT, Presented at the Second International Conference on Mobile, Hybrid, and On-line Learning. Saint Maarten.
[37] Marchewka, J. T., Liu, C. and Kostiwa, K. 2007. An Application of the UTAUT Model for Understanding Student Perceptions Using Course
Management Software. Communications of the IIMA. 7: 93–104.
[38] Guo, Y. and Barnes, S. 2007. Why People Buy Virtual Items in Virtual
Worlds with Real Money. Database for Advances in Information
Systems. 38(4): 69–76.
[39] Hu, L. and Bentler, P. M. 1999. Cutoff Criteria for Fit Indexes in Covariance Structure Analysis: Coventional Criteria Versus New Alternatives. Structural Equation Modeling. 6(1): 1–55.
[40] Byrne, B. M., 2010. Structured Equation Modeling with AMOS, 2nd ed.
[41] Kline, R. B., 2011. Principles and Practices of Structural Equation
Modeling, 3rd ed. New York, NY: The Guilford Press.
[42] Carter, L. 2008. E-Government Diffusion: A Comparison of Adoption
Constructs. Transforming Government: People Process and Policy.
2(3): 147–161.
[43] Gilbert, D. and Balestrini, P. 2004. Barriers and Benefits in the Adoption
of e-Government. The International Journal of Public Sector
Management. 17(4): 286–301.
[44] Lean, O. K., Zailani, S., Ramayah, T. and Fernando, Y. 2009. Factors Influencing Intention to Use E-Government Services Among Citizens in
Malaysia. International Journal of Information Management. 29: 458–
475.
[45] Tolbert, C. J. and Mossberger, K. 2006. The Effects of e-Government on Trust and Confidence in Government. Public Administration Review. 66(3): 354–369.
[46] Srivastava, S. C. and Thompson, S. H. 2005. Citizen Trust Development for e-Government Adoption: Case of Singapore, Presented at the Pacific Asia Conference on Information Systems.
[47] Hair, J. F., Black, W. C., Babin, B. J. and Anderson, P. E., 2009. Multivariate Data Analysis, 7th ed. Prentice Hall.
[48] Teo, T. 2010. A Case for Using Structural Equation Modelling (SEM) in Educational Technology Research. British Journal of Educational
Appendix A
Questionnaire
Intention to Use
1- I plan to use e-Government services.
2- I would use the e-Government services for gathering state government information.
3- I would use e-Government services provided over the web. 4- Interacting with the e-Government services over the web is something that I would do.
5- I would not hesitate to provide information to e-Government servicesover the web.
Perceived Usefulness
1- Using e-Government services would enable me to complete transactions with the government more quickly.
2- I think e-Government provides valuable services for me. 3- The content of e-Government services would be useless to me. 4- E-Government services would enhance my effectiveness in searching for and using government services.
5- I would find e-Government services useful.
Perceived Ease of Use
1- Learning to interact with e-Government services would be easy for me.
2- I believe interacting with a state e-Government service would be a clear and understandable process.
3- I would find most e-Government services to be flexible to interact with.
4- It would be easy for me to become skilful at using a state government service.
Output Quality
1- The quality of the e-Government services output which I get, are high.
2- I would have no problem with the quality of e-Government services’ output.
Job Relevance
1- In my job, usage e-Government services would be important. 2- In my job, usage e-Government services would be relevant.
Image
1- People in my organization who use e-Government services would have more prestige than those who do not.
2- People in my organization who use e-Government services would have more prestige than those who do not.
3- People in my organization who use e-Governments services would have a high profile.
Compatibility
1- I think using the e-Government services would fit well with the way that I like to gather information from government agencies.
2- I think using the e-Government services would fit well with the way that I like to interact with the government agencies. 3- Using the e-Government services to make my interactions to the government would fit into my lifestyle.
4- Using e-Government services to interact with the government agencies would be compatible with how I like to do things.
Social Influence
1- People who supervise me think that I should use e-Government services.
2- People who are important to me (e.g., family, friends, etc) think that I should use e-Government services.
3- Most People who influence my behavior would think that I should use e-Government services.
4- The government has supported the use of e-Government services.
5- People around me who use e-Government services have high status and prestige.
Trust of Internet
1- The Internet has enough safeguards to make me feel comfortable using it to make my transactions to the e-Government services online.
2- I feel assured that legal and technological structures adequately protect me from problems on the Internet.
3- In general, the Internet is now a robust and safe environment in which I can make my transactions to the e-Government services.
Trust of Government
1- I think I can trust the e-Government services.
2- The e-Government services can be trusted to carry out transactions faithfully.
3- In my opinion, the transaction of the e-Government services is trustworthy.
4- I trust the e-Government services to keep my best interests in mind. e-Government.