229
Efficiency Metrics for Data-Driven Models:
A Text Summarization Case Study
Erion Çano
Institute of Formal and Applied Linguistics, Charles University,
Prague, Czech Republic [email protected]
Ondˇrej Bojar
Institute of Formal and Applied Linguistics, Charles University,
Prague, Czech Republic [email protected]
Abstract
Using data-driven models for solving text summarization or similar tasks has become very common in the last years. Yet most of the studies report basic accuracy scores only, and nothing is known about the ability of the proposed models to improve when trained on more data. In this paper, we define and pro-pose three data efficiency metrics: data score efficiency, data time deficiency and overall data efficiency. We also propose a simple scheme that uses those metrics and apply it for a more comprehensive evaluation of pop-ular methods on text summarization and title generation tasks. For the latter task, we pro-cess and release a huge collection of 35 million abstract-title pairs from scientific articles. Our results reveal that among the tested models, the Transformer is the most efficient on both tasks.
1 Introduction
Text summarization is the process of distilling the most noteworthy information in a document to produce an abridged version of it. This task is earning considerable interest, since shorter ver-sions of long documents are easier to read and save us time. There are two basic ways to sum-marize texts. Extractive summarization selects the most relevant parts of the source document and combines them to generate the summary. In this case, the summary contains exact copies of words or phrases picked from the source. Abstractive summarization, on the other hand, paraphrases the information required for the summary instead of copying it verbatim. This is usually better, but also more complex and harder to achieve.
There has been a rapid progress in ATS (Ab-stractive Text Summarization) over the last years. The vanilla encoder-decoder with bidirectional LSTMs (Hochreiter and Schmidhuber, 1997) is now enhanced with advanced mechanisms like at-tention (Bahdanau et al., 2014) which has been
widely embraced. It allows the model to focus on various parts of the input during the gener-ation phase and was successfully used by Rush et al.(2015) to summarize news articles. Pointing (copying) is another mechanism that helps to al-leviate the problem of unknown words (Gulcehre et al.,2016;Gu et al.,2016). Moreover, coverage (Tu et al.,2016) and intra-attention (Paulus et al.,
2017) were proposed and utilized to avoid word repetitions, producing more readable summaries. RL (Reinforcement Learning) concepts like policy gradient (Rennie et al.,2017) were recently com-bined into the encoder-decoder architecture, alle-viating other problems like train/test inconsistency and exposure bias (Paulus et al.,2017;Chen and Bansal,2018).
All these developments helped to boost the ATS ROUGE (Lin, 2004) scores from about 30 % in
Rush et al.(2015) to about 41 % in Paulus et al.
(2017). This is an increase of roughly 37 % in the last three years. Yet all the studies evaluate the methods using datasets of a fixed size. Do-ing so they tell us nothDo-ing about the expected per-formance1of the models when trained with more data. Moreover, training time is rarely reported. We believe that this evaluation practice of data-driven models is incomplete and data efficiency metrics should be computed and reported.
In this paper, we propose three data efficiency metrics, namely data score efficiency, data time deficiency and overall data efficiency. The first two represent the output quality gain and the train-ing time delay of the model per additional data samples. The third is the ratio between them and reflects the overall efficiency of the models w.r.t the training data. We also suggest a simple scheme that considers several values for each of the above metrics, together with the basic accuracy score,
in-1We use “performance” solely for the output quality, not
stead of reporting only the latter. The proposed scheme and the metrics can be used for a more de-tailed evaluation of supervised learning models.
Using them, we examine various recently pro-posed methods in two tasks: text summariza-tion using the popular CNNDM (CNN/Daily Mail,
Nallapati et al., 2016) dataset and title genera-tion of scientific articles using OAGS, a novel dataset of abstract-title pairs that we processed and released.2 According to our results, the best-performing and fastest methods in the two datasets are those of Paulus et al. (2017) and Chen and Bansal (2018). Regarding score and time effi-ciency, Transformer (Vaswani et al.,2017) is dis-tinctly superior. In the future, we will examine the Transformer model on more data with different pa-rameter setups. Applying our evaluation scheme to related tasks such as MT (Machine Translation) could also be beneficial.
Overall, this work brings the following main contributions: (i) We define and propose three data efficiency metrics and a simple evaluation scheme that uses them for a more comprehensive evalua-tion of data-driven learning methods. (ii) We use the scheme and metrics to benchmark some of the most recently proposed ATS methods and discuss their training times, ROUGE, and data efficiency scores. (iii) Finally, a huge collection of about 35 million scientific paper abstracts and titles is pre-pared and released to the community. To our best knowledge, this is the largest data collection pre-pared for title generation experiments.
2 Data Efficiency Metrics
2.1 Related Work
Training data efficiency of the data-driven learn-ing models is little considered in the literature. An early work is that ofLawrence et al.(1998) who investigate the generalization ability of neural net-works with respect to the complexity of the ap-proximation function, the size of the network and the degree of noise in the training data. In the case of latter factor, they vary the size of the train-ing data and the levels of Gaussian noise added to those data concluding that ensemble techniques are more immune to the increased noise levels. Performance variations w.r.t the training data sizes are not considered, though.
Al-Jarrah et al. (2015) review the research lit-erature focusing in the computational and energy
2http://hdl.handle.net/11234/1-3043
efficiency of the data-driven methods. They par-ticularly consider data-intensive application areas (e.g., big data computing) and how sustainable data models can help for a maximal learning ac-curacy with minimal computational cost and effi-cient processing of large volumes of data.
Boom et al. (2016) examine a character-level RNN (Recurrent Neural Network) used to predict the next character of a text given the previous in-put characters. They assess the evolution of the network performance (in terms of perplexity) in four train and prediction scenarios as a function of the training time and input training sequences. Ac-cording to their results, the efficiency of the model is considerably influenced by the chosen scenario. A similar experiment is conducted byRiou et al.
(2019) who explore reinforcement learning con-cepts on the task of neural language generation. They compare different implementations reporting not only performance scores, but also their evolu-tion as a funcevolu-tion of the cumulated learning cost and the training data size.
The most relevant work we found is the one by
Hlynsson. et al. (2019) who propose an experi-mental protocol for comparing the data efficiency of a CNN (Convolution Neural Network) with that of HiGSFA (Hierarchical information-preserving Graph-based Slow Feature Analysis). They give an informal definition of data efficiency consid-ering it asperformance as a function of training set size. Three character recognition challenges are defined and the two methods are trained on increasing amounts of data samples reporting the corresponding accuracy scores.
2.2 Proposed Data Efficiency Metrics
Despite the experimental results and insights they bring, the above studies are still task and method specific. Moreover, their computation schemes are not generic or transferable and no formalization of the data efficiency is given. In this section, we de-fine three novel and useful data efficiency metrics. Suppose we train a data-driven method M on dataset D to solve task T and we test it based on performance scoreS. We also assume that the quality of the data samples in different intervals ofD is homogeneous. In practice, this could be achieved by shufflingDbefore starting the exper-iments. For a certain training data sized, it takes
tseconds to train the modelmduntil convergence
training time) and the score obtained by testing it on a standard and independent test dataset of a fixed size is s. We expect that for a certain in-crease∆dof training samples fed toM, it will re-quire an extra time∆tto converge, and the result-ing model md+∆d will attain an extra ∆s score.
We can thus define and compute data score effi-ciency(score gain per additional data samples)Σ
of methodMas:
Σ = ∆s /∆d (1)
It is a measure of how smartly or effectivelyM in-terprets the extra data samples, or how well its per-formance score scales w.r.t the training data. Simi-larly,data time deficiency(the inverse ofdata time efficiency)ΘofMwill be:
Θ = ∆t /∆d (2)
This measures how slowly or lazily M interprets the additional samples.3 Given two train and test runs (original and enlarged datasets) characterized by the above measures (training data: d,d+ ∆d; training times: t,t+ ∆t; achieved scores: s,s+ ∆s), we define theoverall data efficiencyEas:
E = Σ/Θ = ∆s /∆t (3)
It is a measure of how smartly and quickly the models ofMutilizes the data ofDon taskT.
In practice, using the absolute increments
∆s, ∆t, and∆dmay produce small values ofΣ
which are hard to interpret and work with. Further-more,ΘandEuse training times which depend on the computing conditions (e.g., hardware setups). As a result, they are hardly reproducible across different computing environments. To overcome these limitations, we can instead use the relative increments∆s/s, ∆t/tand∆d/d, computing the correspondingrelative data efficiency metricsas:
σ= ∆s / s
∆d / d (4)
θ= ∆t / t
∆d / d (5)
=σ θ =
∆s / s
∆t / t (6)
3
Ourdata time efficiency(∆d/∆t) should not be con-fused with thetraining throughputas defined byPopel and Bojar(2018) for machine translation which reflects the time required for one model update given the additional data. Our ∆tis the increase in the overall training time till convergence on the enlarged dataset in comparison with the original one.
These relative metrics and their values are practi-cally easier to interpret and work with. Further-more, they are transferable or reproducible in dif-ferent computing setups which is important for cross-interpretation of the experimental results. We can express σ and θ values in percent and
values as their ratio.
2.3 Assorted Remarks
The metrics presented above can be used to evalu-ate different data-driven methods or compare sev-eral parameter configurations of the same basic method (algorithm, neural network, etc.) and help us find the optimal one. In this sense, they are generic and task-independent. However, it is im-portant to note that they do not represent “univer-sal” or global attributes of methodM. They are in-stead linear approximations that can give us local characterizations ofMin certain intervals ofD. In other words, high Σ(or σ) values ofM in some intervals of Ddo not necessarily assure a decent generalization ofM.
It is also important not to confuse the data effi-ciency with performance or quality. In our daily intuition, we often tend to consider highly effi-cient machines, techniques or methods as well-performing ones. Instead, according to the above definitions, a model can perform poorly but still be highly efficient w.r.t the training data. This happens if its performance scores on increasing training data cuts are all very low, but grow very quickly from one assessment to the next. A model can also yield high scores which grow very slowly on increasing data sizes (thus relatively small Σ
andσ values). In this case it is a well-performing (maybe even the best) model on those data, but not a data efficient one.
3 A Comprehensive Evaluation Scheme
Since the sizes of the predictive models and the utilized datasets are consistently growing, it be-comes more difficult and costly to use human ex-pertise for the evaluation. The typical approach is to test automatically by means of standard datasets and scoring metrics which are popular. For ex-ample, in the case of text summarization task, it is very common to find evaluations of proposed methods using the full set of CNNDM only (Ta-ble 1 inPaulus et al., Table 3 inLin et al., Table 1 inSee et al., and more).
We believe there are serious shortcomings in this evaluation practice. Testing only one model of a method trained on a fixed-size data split does not reveal anything about its score trend when fed with more data. It thus becomes hard to discern the overall best method (out of a few that are com-pared) in a fair and objective way, especially if the achieved scores are similar. Moreover, train-ing time is rarely reported and nothtrain-ing is known about the time efficiency of the models.
To overcome the above limitations, we propose a more detailed evaluation scheme that considers accuracy scores together with the data efficiency metrics defined in Section2.2. Again, suppose we have a datasetDof sizedwith homogeneous train-ing samples, a standard performance scoreS and two methods Aand B that we want to compare. The typical practice trains two single modelsaand
bfromA andBon entiredand reports accuracy scoressaandsbfrom the standard test set.
Instead, we suggest to splitdinnequal parts of sized/nand formnintervalsd1, d2, . . . , dnof
increasing sizesd/n, 2d/n, . . . , (n−1)d/n, d. This way we can train2nmodelsa1, a2, . . . , an
and b1, b2, . . . , bn on d1, d2, . . . , dn
and compute their scores sa
1, sa2, . . . , san and
sb1, sb2, . . . , sbn from the same test set. From Equation4, we also computeσ1a, σ2a, . . . , σan−1
using each two scores sa
i and sai+1 of models ai
andai+1, together withσb1, σb2, . . . , σbn−1 from
theBmodels.
We can now report up to 2n score values and
2(n−1)relative data score efficiency values. For conciseness, we can limit insa
nandsbnof the two
biggest models. Also, given the local nature of the efficiency metrics, it make sense to report values from dispersed data intervals like the leftmost (σa
1
[image:4.595.311.521.64.162.2]andσ1b), the middle (σn/a 2andσbn/2) and the right-most (σan−1 and σnb−1) σ. The rightmost values
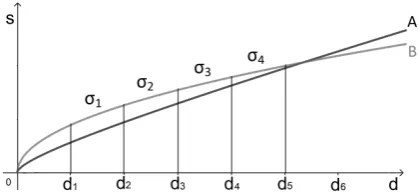
Figure 1: Illustration of the schema application
are probably more relevant for predicting the score trend on bigger training sizes. We can also com-pute and report the respectiveΣvalues or even the
θandvalues in a similar fashion using the other equations of Section2.2.
Getting back to Avs. B, we can first checksan
and sbn. If one of them is distinctly higher than the other, comparing theσ values may not be es-sential. The real worth comes whensan ≈ sbn, by contrasting the rightmost corresponding σ values (σan−1 vs. σbn−1). A significant difference of one against the other could suggest which of them will reach higher scores on a bigger training set.
To illustrate, we can see in Figure 1 two hy-pothetical graphs that approximate the variations of sa and sb over D. We have n = 5, training
sized = d5 and very similar performance scores (sa5 ≈ sb5). Obviously, sb grows faster than sa
till d2, but then the situation is reversed, since σ3a> σb3andσ4a> σ4b. We can thus expectsa> sb
ford > d5 which is what actually happens in this
example (sa
6 > sb6).
Using the traditional practice (computing sa5
andsb5 only) our verdict would be: AandB per-form (almost) the same on D. Instead, using the above scheme we can conclude that:AandB per-form (almost) the same onD, butAwill probably perform better thanBif trained on more data. The scheme can be used to evaluate data-driven meth-ods with different scores, on different tasks. In Section5we show the results we obtained by ap-plying it to assess several advanced ATS methods.
4 Text Summarization Datasets
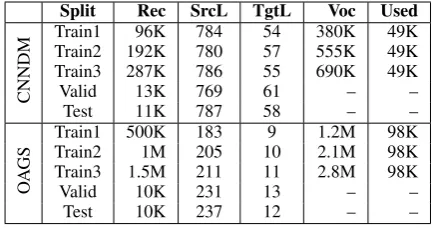
The tendency towards data-driven methods based on neural networks has encouraged experiments with large text collections for various tasks. In the case of ATS, one of the first big datasets was the annotated English Gigaword (Napoles et al.,2012;
Split Rec SrcL TgtL Voc Used
CNNDM
Train1 96K 784 54 380K 49K
Train2 192K 780 57 555K 49K
Train3 287K 786 55 690K 49K
Valid 13K 769 61 – –
Test 11K 787 58 – –
O
A
GS
Train1 500K 183 9 1.2M 98K
Train2 1M 205 10 2.1M 98K
Train3 1.5M 211 11 2.8M 98K
Valid 10K 231 13 – –
[image:5.595.72.290.62.176.2]Test 10K 237 12 – –
Table 1: Statistics of used datasets. For each split, it shows the number of records (Rec), average length of source and target texts in tokens (SrcL, TgtL), total vo-cabulary size (Voc), and the number of most frequent words that were used (Used).
Manning et al.(2014). Each headline was paired with the first sentence of the corresponding arti-cle to create the training base for the experiments. DUC-2004 is another dataset4, mostly used as an evaluation baseline, given its small size. It con-sists of 500 document-summary pairs curated by human experts. Newsroom is a recent and hetero-geneous bundle of about 1.3 million news articles (Grusky et al.,2018).
CNNDM has become the most popular dataset for text summarization (Nallapati et al., 2016). It provides a large set of news articles and the cor-responding multi-sentence summaries, unlike the three above that contain one-sentence summaries only. It is thus more suitable for training and test-ing summarization models of longer texts.
Title generation task, on the other hand, requires data samples of shorter texts and one-sentence ti-tles. Collections of abstracts and titles from scien-tific articles are well suited for exploring it. KP20k is a collection of 20K records of scientific paper metadata (title, abstract and keywords) presented byMeng et al.(2017). The metadata belong to ar-ticles of computer science from ACM Digital Li-brary, ScienceDirect, and Web of Science.
The demand for more and more data has mo-tivated initiatives that mine research articles from academic networks. One of them is ArnetMiner, a system that extracts researcher profiles from the Web and integrates the data into a unified network (Tang et al.,2008). A byproduct of that work is the OAG (Open Academic Graph) collection (Sinha et al.,2015).
To produce a big title generation dataset for our experiments, we started from OAG. First,abstract,
4https://duc.nist.gov/duc2004/
title, andlanguagefields were extracted from each record where they were available. In many cases, abstract language did not match thelanguagefield. We ignored the latter and used a language identi-fier to remove records that were not in English. Duplicates were dropped and the texts were low-ercased. Finally, Stanford CoreNLP tokenizer was used to split title and abstract texts. The result-ing dataset (OAGS, released with this paper) con-tains about 35 million abstract-title pairs and can be used for title generation experiments.
We had a quick look at the content of OAGS and observed that most of the papers are from medicine. There are also many papers about so-cial sciences, psychology, economics or engineer-ing disciplines. Given its huge size and the top-ical richness, the value of OAGS is twofold: (i) It can be used to supplement existing datasets on title generation tasks when more training data are needed. (ii) It can be used for creating byproducts of specific scientific disciplines or domains.
5 Text Summarization Evaluation
In this section, we apply the relative metrics of Section2.2and the evaluation scheme of Section3
to benchmark several advanced methods on text summarization of news articles and title genera-tion of scientific papers. We first introduce the methods and their parameters, together with the experimental data. Later, we present and discuss the achieved accuracy and data efficiency scores.
5.1 Tested Summarization Methods
The ability of recurrent neural networks to rep-resent and process variable-length sequences has created a tradition of applying them on sequence-to-sequence tasks such as ATS or MT. In the case of ATS, the goal is to process the source text pro-ducing a target text that is shorter but still mean-ingful and easy to read.
Rush et al.(2015) were probably the first to im-plement attention in a network dedicated to ATS. Their model (ABS in the following) uses an en-coder that learns a soft alignment (attention) be-tween the source and the target sequences produc-ing the context vector. In the decodproduc-ing phase, it uses a beam-search decoder (Dahlmeier and Ng,
state-of-the-art results in the DUC-2004 testing dataset.
See et al. (2017) proposed Pointer-Generator (PCOV), a model that implements an attention-based encoder for producing the context vector. The decoder is extended with a pointing/copying mechanism (Gulcehre et al.,2016;Gu et al.,2016) that is used in each step to compute a generation probability pgen from the context vector, the
de-coder states, and the dede-coder output in that step. This generation probability is used as a switch to decide if the next word should be predicted or copied from the input. Another extension is the coverage mechanism (keeping track of decoder outputs) for avoiding word repetitions in the mary, a chronic problem of encoder-decoder sum-marizers (Tu et al.,2016). The method was imple-mented with word embeddings and hidden layer of sizes 128 and 256 respectively.
Lin et al. (2018) tried a partial use of convo-lutions in their model (GLOBEN) to avoid word repetitions and semantic irrelevance in the sum-maries. They couple the encoder with a convolu-tional gated unit which performs global encoding of the source context and uses it to filter certain n-gram features and refine the output of the encoder in each time step. GLOBENis a very big network
(about 68M parameters on CNNDM) with three layers in the encoder and other three in the de-coder, each of 512 dimensions.
A taxonomy of the above (and more) sequence-to-sequence methods and added mechanisms can be found in Shi et al. (2018). Authors present a detailed review of problems and proposed solu-tions based on network structures, training strate-gies, and generation algorithms. Furthermore, they develop and release a library (NATS) that im-plements combinations of mechanisms like atten-tion, pointing, and coverage, analyzing their ef-fects in text summarization quality. NATSwas im-plemented with the same network parameters as PCOV. Intra-decoder attention and weight sharing of embeddings were added in the decoder.
The introduction of the Transformer (TRANS) architecture that removes all recurrent or convo-lutional structures reduced computation cost and training time (Vaswani et al.,2017). Totally based on attention mechanism and primarily designed for MT, Transformer can also work for text sum-marization, since all it needs to do is to learn the alignments between the input (source) texts and the output (target) summaries. Positional
encod-ing is added to word embeddencod-ings to preserve the order of the input and output sequences. TRANS
is the biggest model we tried, with four layers in both encoder and decoder, 512 dimensions in each layer, including the embedding layers, 200K train-ing steps and 8000 warm-up steps.
Two observed problems in the encoder-decoder framework are theexposure biasandtrain/test in-consistency(Keneshloo et al.,2018). To overcome them, RL ideas have been recently applied.Paulus et al.(2017) use intra-attention to focus on differ-ent parts of the encoded sequence. This way it is less likely for their model (PGRL) to attend to the same parts of input in different decoding steps, and thus fewer word repetitions should appear in the summaries. To optimize for ROUGE or similar discrete evaluation metrics, they implement self-critical policy gradient training with reward func-tion, a RL mechanism introduced byRennie et al.
(2017). PGRLwas used with encoder and decoder of 256 dimensions and word embeddings of 128 dimensions.
Aiming for speed,Chen and Bansal(2018) de-veloped an extractive-abstractive text summarizer (FASTRL) with policy-based reinforcement. It first uses an extractor agent to pick the most salient sentences or phrases, instead of encoding the en-tire input sequence which can be long. It then uses an encoder-decoder abstractor to rewrite (com-press) the sentences in parallel. Actor-Critic pol-icy gradient with reward function (Bahdanau et al.,
2016) joins together the extractor and abstractor networks. Same as most models above, FASTRL
uses 256 and 128 dimensions for the recurrent layer and the word embeddings.
In every experiment, no pretraining of word embeddings was performed. They were learned during the training of each model. Adam op-timizer (Kingma and Ba, 2014) was used with
α= 0.001, β1 = 0.9, β2 = 0.999and= 10−8. We chose mini-batches of size 16 in most of the cases (8 for GLOBEN and TRANS to avoid mem-ory errors). All experiments were conducted on two NVIDIA GTX 1080Ti GPUs.
5.2 Used Data
CNNDM OAGS
Authors Model P R1 R2 RL Tt P R1 R2 RL Tt
Rush et al.
ABS1 15M 26.66 8.81 24.46 135032 22M 24.75 10.05 21.84 48595
ABS2 15M 28.56 10.42 25.57 185549 22M 26.6 11.5 23.33 61729
ABS3 15M 29.64 11.55 26.32 243549 22M 27.86 12.15 24.48 73038
See et al.
PCOV1 14M 36.97 15.19 33.84 113110 21M 34.4 17.67 27.55 30551
PCOV2 14M 38.56 16.03 35.09 138175 21M 35.18 18.06 28.83 42723 PCOV3 14M 39.41 16.77 36.31 163744 21M 35.86 18.51 29.42 56538
Shi et al.
NATS1 15M 36.92 14.56 32.88 98791 – – – – –
NATS2 15M 38.25 15.89 34.02 179689 – – – – –
NATS3 15M 39.11 17.2 35.66 261794 – – – – –
Lin et al.
GLOBEN1 68M 36.53 14.9 34.11 658924 – – – – –
GLOBEN2 68M 37.82 16.13 35.46 785622 – – – – –
GLOBEN3 68M 38.67 16.94 36.25 875817 – – – – –
Vaswani et al.
TRANS1 81M 32.38 10.47 29.43 518924 129M 30.29 13.1 24.34 251802 TRANS2 81M 36.76 14.54 33.82 579149 129M 34.17 17.49 28.46 269665 TRANS3 81M 38.24 16.33 35.28 611359 129M 37.06 19.44 30.51 278602
Chen et al.
FASTRL1 – 36.95 14.89 34.69 19601 – – – – –
FASTRL2 – 39.18 16.17 36.15 30485 – – – – –
FASTRL3 – 40.02 17.52 37.24 52775 – – – – –
Paulus et al.
PGRL1 – 38.16 14.17 36.24 68942 – 35.52 16.81 28.65 43726
PGRL2 – 39.88 15.31 37.89 81529 – 36.9 18.44 30.22 55324
[image:7.595.74.521.59.322.2]PGRL3 – 40.83 15.68 38.73 107179 – 38.05 19.23 31.16 74983
Table 2: Parameters, ROUGEF1scores and training times for each method on the splits of the two datasets
1 2 3
30 35 40
R-1
score
1 2 3
25 30 35
ABS PCOV NATS GLOBEN TRANS FASTRL PGRL
Figure 2:R1score trends of the three models of each method on CNNDM (left) and OAGS (right)
splits (one-third, two-thirds, and full) of CNNDM. Some statistics of the experimental data are shown in Table1. Vocabulary sizes used in each experi-ment are shown in its last column.
The higher vocabulary sizes of OAGS splits cause a significant difference in parameters be-tween the two corresponding models of each method. As we can see (Table 2), Transformer models grows from 81M in CNNDM to 129M in OAGS. Another difference between the two sets of experiments is in the maximal number of encod-ing and decodencod-ing steps (words in source and target texts). For CNNDM, we used 400 and 100 respec-tively. For OAGS, we chose 200 and 50, since
pa-per abstracts and titles should not be longer.
5.3 Summarization Results
ROUGE scores and training times (in seconds) on CNNDM experiments are shown in the mid-dle part of Table 2. The most accurate models are PGRL and FASTRL. They both implement policy-based training and optimize w.r.t ROUGE scores. The worst performer is ABSand the other
four fall somewhere in between, reaching similar scores with each other.
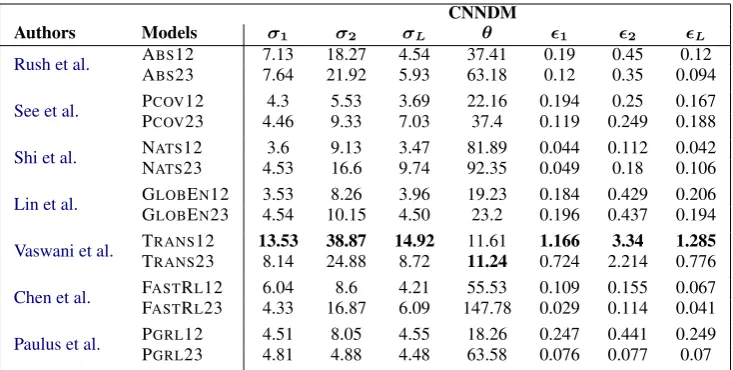
[image:7.595.80.502.350.533.2]CNNDM
Authors Models σ1 σ2 σL θ 1 2 L
Rush et al. ABS12 7.13 18.27 4.54 37.41 0.19 0.45 0.12
ABS23 7.64 21.92 5.93 63.18 0.12 0.35 0.094
See et al. PCOV12 4.3 5.53 3.69 22.16 0.194 0.25 0.167
PCOV23 4.46 9.33 7.03 37.4 0.119 0.249 0.188
Shi et al. NATS12 3.6 9.13 3.47 81.89 0.044 0.112 0.042
NATS23 4.53 16.6 9.74 92.35 0.049 0.18 0.106
Lin et al. GLOBEN12 3.53 8.26 3.96 19.23 0.184 0.429 0.206
GLOBEN23 4.54 10.15 4.50 23.2 0.196 0.437 0.194
Vaswani et al. TRANS12 13.53 38.87 14.92 11.61 1.166 3.34 1.285
TRANS23 8.14 24.88 8.72 11.24 0.724 2.214 0.776
Chen et al. FASTRL12 6.04 8.6 4.21 55.53 0.109 0.155 0.067
FASTRL23 4.33 16.87 6.09 147.78 0.029 0.114 0.041
Paulus et al. PGRL12 4.51 8.05 4.55 18.26 0.247 0.441 0.249
[image:8.595.116.483.61.246.2]PGRL23 4.81 4.88 4.48 63.58 0.076 0.077 0.07
Table 3: Data efficiency scores of the models on CNNDM experiments.σXis computed based on the correspond-ingRXscore. Similarly,X is computed based onσXandθ.
OAGS
Authors Models σ1 σ2 σL θ 1 2 L
Rush et al. ABS12 7.47 14.43 6.82 27.03 0.277 0.534 0.252
ABS23 9.47 11.3 9.86 36.64 0.259 0.309 0.269
See et al. PCOV12 2.27 2.21 4.65 39.84 0.057 0.055 0.117
PCOV23 3.87 5.04 4.09 64.67 0.06 0.077 0.063
Vaswani et al. TRANS12 12.81 33.51 16.93 7.09 1.806 4.724 2.386
TRANS23 16.92 22.3 14.41 6.63 2.552 3.364 2.173
Paulus et al. PGRL12 3.89 9.7 5.48 26.52 0.146 0.366 0.207
PGRL23 6.23 8.57 6.22 71.07 0.088 0.121 0.088
Table 4: Data efficiency scores of the models on OAGS experiments.σXis computed based on the corresponding RXscore. Similarly,Xis computed based onσXandθ.
are computed. A graphical representation of the
R1trends for each method is depicted in Figure2
(left).R2andRL(not shown) behave similarly.
Results on OAGS are listed on the right side of Table 2. We could not run some of the models on OAGS data. The extractive part of FASTRL
could not be easily adapted to perform word-level extraction of OAGS abstracts. Furthermore, NATS
and GLOBENran out of memory very frequently. From the remaining four, PGRLis again the most accurate. TRANSfollows and ABSis the weakest.
R1score trends are shown in the Figure2(right).
Regarding training speed, on CNNDM we can see that FASTRLis absolutely the best, with a con-siderable difference from the second (PGRL). The
slowest is GLOBEN with training times at least 17x higher than those of FASTRL. In fact, it took more than ten days to train GLOBEN on the full
CNNDM data.
OAGS training times are lower than CNNDM ones, although OAGS data splits are 5.2 times big-ger in number of training samples. This happens
because OAGS source and target samples are actu-ally much shorter. We see that PCOVis the fastest and TRANSis the slowest.
5.4 Efficiency Results
Using Equations 4, 5 and 6 of Section 2.2 we computed the relative efficiency metrics for every method. The values for CNNDM experiments are shown in Table3. We see that TRANSis clearly the most efficient, with highestσ, lowestθand highest
. Its scores grow quickly (despite being relatively low) and training times grow slowly (despite being high) in both data intervals.
PCOVand GLOBENmanifest the slowest accu-racy score gains (lowestσ), but GLOBEN comes second in time efficiency. NATSon the other hand, is very time inefficient, with highestθand lowest
. OAGS scores of Table4reflect a similar situa-tion. TRANS leads and PCOVis again the worst. The values of the other two models appear some-where in between.
efficiency of TRANS. GLOBEN is also time effi-cient but not score effieffi-cient. Both of them are the biggest (highest number of parameters) and deep-est (many layers) networks we tried. The exclu-sive feature of TRANSis the lack of any recurrent structure. GLOBEN and the other five make use of at least one RNN in a certain phase. It is still hasty to infer that recurrent networks hinder score efficiency or that more attention boosts it.
An intuitive explanation could be the fact that in general, performance of deeper networks scales better with more data. It could also be that high-capacity networks are faster in interpreting large additions of training samples (thus lowθ). In fact, using more layers and bigger training datasets is what has driven the progress of deep learning so-lutions in many application areas.
We plan to investigate this issue further in the future. One step could be to run more experiments on even bigger data sizes and smaller data inter-vals for checking at what point do accuracy scores keep growing. Transformer implementations with varying number of layers and other parameter se-tups can be further examined.
Investigating data efficiency of similar solu-tions to tasks like QA (Question Answering, Cor-reia et al., 2018) with standard datasets such as SQuAD (Rajpurkar et al., 2018) could also be valuable.
6 Conclusions
In this paper, we defined three data efficiency met-rics for a better evaluation of data-driven learning models. We also proposed a simple scheme for computing and reporting them, in addition to the basic accuracy scores. Text summarization and ti-tle generation tasks were chosen as a case study to see what insights the proposed scheme and met-rics could reveal. For title generation, we also pro-cessed a dataset of about 35 million scientific titles and abstracts, released with this paper.
We applied seven recent ATS methods on the two tasks. According to our results, the two meth-ods that mix RL concepts into the encoder-decoder framework are the fastest and the most accurate. A surprising result is the excellent efficiency of the popular Transformer model. As future work, we want to perform similar studies in analogous tasks like MT or QA. We would also like to investigate more in depth the Transformer model.
Acknowledgments
This research work was supported by the project No. CZ.02.2.69/0.0/0.0/16 027/0008495 (Inter-national Mobility of Researchers at Charles Uni-versity) of the Operational Programme Research, Development and Education, the project no. 19-26934X (NEUREM3) of the Czech Science Foun-dation and ELITR (H2020-ICT-2018-2-825460) of the EU.
References
O. Y. Al-Jarrah, Paul D. Yoo, Sami Muhaidat, George K. Karagiannidis, and Kamal Taha. 2015. Efficient machine learning for big data: A review. CoRR, abs/1503.05296.
Dzmitry Bahdanau, Philemon Brakel, Kelvin Xu, Anirudh Goyal, Ryan Lowe, Joelle Pineau, Aaron Courville, and Yoshua Bengio. 2016. An actor-critic algorithm for sequence prediction. arXiv e-prints, abs/1607.07086.
Dzmitry Bahdanau, Kyunghyun Cho, and Yoshua Bengio. 2014. Neural machine translation by jointly learning to align and translate. CoRR, abs/1409.0473.
Cedric De Boom, Sam Leroux, Steven Bohez, Pieter Simoens, Thomas Demeester, and Bart Dhoedt. 2016. Efficiency evaluation of character-level RNN training schedules.CoRR, abs/1605.02486.
Yen-Chun Chen and Mohit Bansal. 2018. Fast abstrac-tive summarization with reinforce-selected sentence rewriting. InProceedings of the 56th Annual Meet-ing of the Association for Computational LMeet-inguistics (Volume 1: Long Papers), pages 675–686. Associa-tion for ComputaAssocia-tional Linguistics.
Alvaro Henrique Chaim Correia, Jorge Luiz Mor-eira Silva, Thiago de Castro Martins, and Fábio Gagliardi Cozman. 2018. A fully attention-based information retriever.CoRR, abs/1810.09580.
Daniel Dahlmeier and Hwee Tou Ng. 2012. A beam-search decoder for grammatical error correction. In Proceedings of the 2012 Joint Conference on Empirical Methods in Natural Language Process-ing and Computational Natural Language LearnProcess-ing, EMNLP-CoNLL ’12, pages 568–578, Stroudsburg, PA, USA. Association for Computational Linguis-tics.
Jiatao Gu, Zhengdong Lu, Hang Li, and Victor O.K. Li. 2016. Incorporating copying mechanism in sequence-to-sequence learning. In Proceedings of the 54th Annual Meeting of the Association for Com-putational Linguistics (Volume 1: Long Papers), pages 1631–1640, Berlin, Germany. Association for Computational Linguistics.
Caglar Gulcehre, Sungjin Ahn, Ramesh Nallapati, Bowen Zhou, and Yoshua Bengio. 2016. Pointing the unknown words. In Proceedings of the 54th Annual Meeting of the Association for Computa-tional Linguistics (Volume 1: Long Papers), pages 140–149, Berlin, Germany. Association for Compu-tational Linguistics.
Hlynur Davíð Hlynsson., Alberto N. Escalante-B.., and Laurenz Wiskott. 2019. Measuring the data ef-ficiency of deep learning methods. In Proceed-ings of the 8th International Conference on Pattern Recognition Applications and Methods - Volume 1: ICPRAM,, pages 691–698. INSTICC, SciTePress.
Sepp Hochreiter and Jürgen Schmidhuber. 1997. Long short-term memory. Neural computation, 9(8):1735–1780.
Yaser Keneshloo, Tian Shi, Naren Ramakrishnan, and Chandan K. Reddy. 2018. Deep reinforcement learning for sequence to sequence models. CoRR, abs/1805.09461.
Diederik P. Kingma and Jimmy Ba. 2014. Adam: A method for stochastic optimization. Cite arxiv:1412.6980, Comment: Published as a confer-ence paper at the 3rd International Conferconfer-ence for Learning Representations, San Diego, 2015.
Steve Lawrence, C Lee Giles, and Ah Chung Tsoi. 1998. What size neural network gives optimal gen-eralization? convergence properties of backpropaga-tion. Technical report.
Chin-Yew Lin. 2004. Rouge: A package for automatic evaluation of summaries. InProc. ACL workshop on Text Summarization Branches Out, page 10.
Junyang Lin, Xu SUN, Shuming Ma, and Qi Su. 2018. Global encoding for abstractive summariza-tion. InProceedings of the 56th Annual Meeting of the Association for Computational Linguistics (Vol-ume 2: Short Papers), pages 163–169. Association for Computational Linguistics.
Christopher D. Manning, Mihai Surdeanu, John Bauer, Jenny Finkel, Steven J. Bethard, and David Mc-Closky. 2014. The Stanford CoreNLP natural lan-guage processing toolkit. InAssociation for Compu-tational Linguistics (ACL) System Demonstrations, pages 55–60.
Rui Meng, Sanqiang Zhao, Shuguang Han, Daqing He, Peter Brusilovsky, and Yu Chi. 2017. Deep keyphrase generation. In Proceedings of the 55th Annual Meeting of the Association for Computa-tional Linguistics, pages 582–592. Association for Computational Linguistics.
Ramesh Nallapati, Bowen Zhou, Cicero dos Santos, Caglar Gulcehre, and Bing Xiang. 2016. Ab-stractive text summarization using sequence-to-sequence rnns and beyond. InProceedings of The 20th SIGNLL Conference on Computational Natural Language Learning, pages 280–290. Association for Computational Linguistics.
Courtney Napoles, Matthew Gormley, and Benjamin Van Durme. 2012. Annotated gigaword. In Pro-ceedings of the Joint Workshop on Automatic Knowl-edge Base Construction and Web-scale KnowlKnowl-edge Extraction, AKBC-WEKEX ’12, pages 95–100, Stroudsburg, PA, USA. Association for Computa-tional Linguistics.
Romain Paulus, Caiming Xiong, and Richard Socher. 2017.A deep reinforced model for abstractive sum-marization.CoRR, abs/1705.04304.
Martin Popel and Ondˇrej Bojar. 2018. Training Tips for the Transformer Model. The Prague Bulletin of Mathematical Linguistics, 110(1):43–70.
Pranav Rajpurkar, Robin Jia, and Percy Liang. 2018. Know what you don’t know: Unanswerable ques-tions for squad. In Proceedings of the 56th An-nual Meeting of the Association for Computational Linguistics (Volume 2: Short Papers), pages 784– 789, Melbourne, Australia. Association for Compu-tational Linguistics.
Steven J. Rennie, Etienne Marcheret, Youssef Mroueh, Jarret Ross, and Vaibhava Goel. 2017. Self-critical sequence training for image captioning. 2017 IEEE Conference on Computer Vision and Pattern Recog-nition (CVPR), pages 1179–1195.
Matthieu Riou, Bassam Jabaian, Stéphane Huet, and Fabrice Lefèvre. 2019. Reinforcement adaptation of an attention-based neural natural language genera-tor for spoken dialogue systems. Dialogue & Dis-course, 10:1–19.
Alexander M. Rush, Sumit Chopra, and Jason Weston. 2015. A neural attention model for abstractive sen-tence summarization. In Proceedings of the 2015 Conference on Empirical Methods in Natural Lan-guage Processing, pages 379–389. Association for Computational Linguistics.
Abigail See, Peter J. Liu, and Christopher D. Manning. 2017.Get to the point: Summarization with pointer-generator networks. InProceedings of the 55th An-nual Meeting of the Association for Computational Linguistics, pages 1073–1083. Association for Com-putational Linguistics.
Tian Shi, Yaser Keneshloo, Naren Ramakrishnan, and Chandan K. Reddy. 2018. Neural abstractive text summarization with sequence-to-sequence models. CoRR, abs/1812.02303.
2015. An overview of microsoft academic ser-vice (mas) and applications. InProceedings of the 24th International Conference on World Wide Web, WWW ’15 Companion, pages 243–246, New York, NY, USA. ACM.
Jie Tang, Jing Zhang, Limin Yao, Juanzi Li, Li Zhang, and Zhong Su. 2008. Arnetminer: Extraction and mining of academic social networks. InProceedings of the 14th ACM SIGKDD International Conference on Knowledge Discovery and Data Mining, KDD ’08, pages 990–998, New York, NY, USA. ACM.
Zhaopeng Tu, Zhengdong Lu, Yang Liu, Xiaohua Liu, and Hang Li. 2016. Modeling coverage for neural machine translation. InProceedings of the 54th An-nual Meeting of the Association for Computational Linguistics, pages 76–85. Association for Computa-tional Linguistics.