Original Article
Correlation of the ferrum and VEGF with magnetic
resonance imaging in chronic subdural
hematomas: a prospective study
Ronggang Li1*, Yuandang Zhao1*, Yufeng Yan1, Yan Dong2, Li Fei1, Ersong Wang1
Departments of 1Neurosurgery, 2Ultrasonography, Jinshan Hospital, Fudan University, Shanghai, China. *Equal
contributors.
Received September 18, 2016; Accepted January 26, 2017; Epub March 15, 2017; Published March 30, 2017
Abstract: In this study, we measured the level of ferrum ion and VEGF from the hematoma cavity fluid in chronic
subdural hematoma (CSDH), and analyzed the relationship between these values with the CSDH diagnosis by MRI.
The cranial MRI appearance of each CSDH were classified as hypodense, isodense, hyperdense, or mixed density. The concentrations of ferrum ions in serum and hematoma cavity fluid were measured before and after operation,
and the VEGF level in hematoma cavity was examined by ELISA. Totally, the ferrum ion concentration in
hema-toma cavity fluid was higher than that in periphery serum. In hypodense hemahema-tomas (n=5), ferrum and VEGF was 55.24±12.57 μmol/L, 7254.40±575.88 pg/ml, respectively. In isodense hematomas (n=6), ferrum and VEGF was 65.18±8.63 μmol/L, 8194.17±619.47 pg/ml, respectively. In hyperdense hematomas (n=7), ferrum and VEGF was 38.96±6.37 μmol/L and 6142.43±549.87 pg/ml, respectively. In mixed-density hemotomas (n=7), ferrum and VEGF was 45.99±10.11 μmol/L, 6861.00±686.89 pg/ml, respectively. There was significant difference of ferrum
and VEGF between 4 classes of MRI appearance (P<0.05). Meanwhile, earlier age and shorter onset days were found in hyperdense hematomas with lower ferrum and VEGF. The ferrum concentration and VEGF level was cor-related with the MRI signal density in CSDH.
Keywords: Chronic subdural hematoma, ferrum ions, VEGF, MRI, diagnosis
Introduction
Chronic subdural hematoma (CSDH) is a com-mon neurological disorders, and especially prevalent among the elderly individuals [1]. Minor head trauma preceding development of CSH is documented in 2/3 of patients; howev-er, a CSDH may also occur without such an obvious insult [2]. Clinically, patients present with neurological impairment of varying
inten-sity, which is classified using the scoring sys -tem suggested by Markwalder some 30 years ago [3]. The diagnosis of CSDH has evolved in the last 20-30 years together with the introduc-tion of the CT scan, the MRI and the access of the patients to this type of explorations. There are studies concerning the CSDH, which also demonstrate the superiority of the MRI exami-nation in comparison with the CT. The MRI examination better shows the location of the chronic subdural haematoma and evidences its
dimensions much clearer together with the mass effect of the adjacent structures. Moreover, it is more useful in cases of bilateral and isodense chronic subdural haematomas [4].
In order to optimize patient care and outcomes, early diagnosis and subtype the patient is important. The pathophysiology of CSDH is not yet clear [5], which is mainly caused by the mutual effects from the damage of the
mem-brane and pro-inflammatory stimulating factor
relat-ed with cerebral injury [10]. Iron chelator des-ferrioxamine could cure cerebral injury through reducing the formation of hydrocephalus. It is unknown that was there any relationship between Fe and CSDH and whether Fe could interfere the MRI signal. According to the
classi-cal classification system proposed by Park et
al, CSDH images may appear as hypodense, isodense, hyperdense, or mixed density types [11]. Given the well-established permeability-promoting effect of VEGF and Fe, we evaluated our patient database and related the
concen-trations of VEGF and Fe in hematoma fluid to
the MRI characteristics.
Patients and methods
Patient selection
Between January 2014 and January 2015, 25 consecutive patients (17 males and 8 females) had been admitted to Jinshan Hospital of Fudan University for surgical management of CSDH, and they provided written informed con-sent to participate in the study. All of these patients had light injury history before surgery and onset time was recorded. All of the chosen patients were performed MRI scanning before surgery, including T1 and T2 MRI. After MRI scanning, patients were performed routine drill-ing drainage in order to eliminate the possibility that the patients with vascular disease, tumor, anemia and blood coagulation dysfunction. The inclusion criteria were as following: the patients were diagnosed with CSDH by using cranium CT scan and MRI, suffered from head-ache or activity obstacle, with a history of head trauma. All of the recruited patients were treat-ed with drilling drainage.
The exclusion criteria were as following: the patients suffered severe trauma in recent 6
months, or cerebrovascular accident, or men- tal diseases, or severe liver and kidney dys- function, or heart failure, or diabetes, or blood system diseases, or autoimmune diseases, or tumors, or patients with drilling drainage contraindication.
The study was approved by the ethics commit-tee of our hospital, and the patients’ families signed the informed consent.
Specimen collection
During the operation, the thickest layer of hematoma should be chosen as the drilling point. For the routine surgical drilling, syringe of
5 ml was used to collect hematoma cavity fluid
before opening dura mater, and the corre-sponding periphery blood was collected to put in anticoagulation tubes. All samples were col-lected into siliconized vacuum tubes containing protamine sulfate and ethylenediamine tet-raacetic acid and were immediately centrifuged at 3000 rpm for 10 minutes. The supernatants were stored in sealed polypropylene tubes at -70°C until analysis.
Measurement of VEGF and by ELASA
The levels of VEGF in hematoma fluid were
measured using ELISA kit according to manu-facturer’s instruction. The VEGF ELISA kit was purchased from Shanghai ViAo biotechnology
Co.Ltd. The ferrum of hematoma fluid and
periphery blood were measured by ELISA kit (Roche Diagnosis Co.Ltd, Germany) and chro-matometry was performed with HITACHI 7600 automatic biochemistry analyzer (Japan). Statistical analysis
Statistical analysis was performed using SPSS 13.0 statistical software. All the data were expressed as the mean ± standard deviation. Concentration of VEGF and Fe in hematoma
fluid was related to the MRI classes of appear -ance and to the mean exudation rates avail-able. Differences of mean concentrations between groups were evaluated using one-way analysis of variance. Differences between means were assessed using Student’s t-test, ANOVA, or X2-tests. Significant differences were
determined by ANOVA followed by pos hoc
com-parisons with Fisher’s protected least signifi -cant difference test. Data were considered
[image:2.612.91.289.96.177.2]sta-tistically significant at P<0.05.
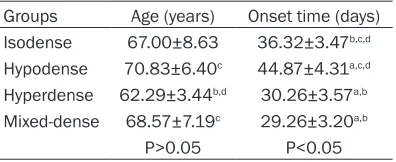
Table 1. Comparison of onset age and onset time
Groups Age (years) Onset time (days) Isodense 67.00±8.63 36.32±3.47b,c,d
Hypodense 70.83±6.40c 44.87±4.31a,c,d
Hyperdense 62.29±3.44b,d 30.26±3.57a,b
Mixed-dense 68.57±7.19c 29.26±3.20a,b
P>0.05 P<0.05
aCompared with Isodense group; bCompared with
Results
Epidemiological and clinical data of the patients were presented in Table 1. There were 17
males and 8 females who fulfilled the inclusion
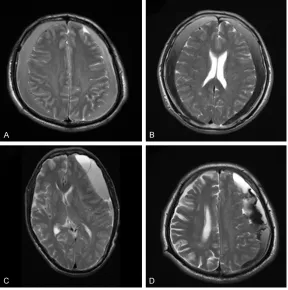
criteria. According to the MRI T2 signal, the 25
patients were classified into 4 groups, hypodense hematoma (n=5), isodense hema
-toma (n=6), hyperdense hema-toma (n=7) and mixed-dense hematoma (n=7) (Figure 1). The
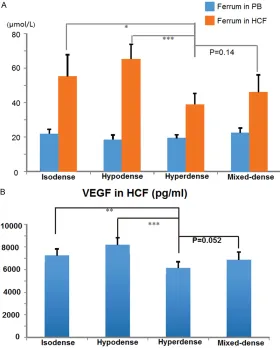
dense group and in hyperdense group (from high to low) (Figure 2). These results suggested that the concentrations of ferrum and VEGF in
hematoma cavity fluid were closely related with
the MRI intensity.
Discussion
CSDH is a common clinical disease widely found among elderly people, of which patho-Figure 1. Axial T2-weighted magnetic resonance imaging showing an
[image:3.612.90.378.73.363.2]isodense type (A), hypodense type (B), hyperdense type (C) and mixed-dense type (D).
Table 2. The ferrum and VEGF levels in chronic subdural
hema-toma and peripheral blood by classification of MRI pattern
Groups Ferrum in PB μmol/L Ferrum in HCB μmol/L VEGF pg/ml Isodense 21.78±2.78b 55.24±12.57c 7254.40±575.88b,c
Hypodense 18.32±2.91a,d 65.18±8.63c,d 8194.17±619.47a,c,d
Hyperdense 19.43±1.98d 38.96±6.37a,b 6142.43±549.87a,b,d
Mixed-dense 22.43±2.83b,c 45.99±10.11b 6861.00±686.89b,c
F 3.427 9.329 12.489
P 0.036 0.000 0.000
PB: peripheral blood. HCB: hematoma cavity fluid. aCompared with iso, P<0.05; bCompared with low, P<0.05; cCompared with high, P<0.05; dCompared with mixed,
P<0.05.
differences of average age between groups were not
sig-nificant (P>0.05). The differ -ences of onset time between
groups were significant (P< 0.05). Briefly, the onset time
of hyperdense or mixed-den- se hematoma was much sh- orter than that of isodense or hypodense hematoma (P< 0.05), and the onset time was longest in hypodense hema-toma (44.87 days) and short-est in mixed-dense hemato-ma (29.26 days).
All concentrations of ferrum from the CSDHs were higher than those in the peripheral venous blood (P<0.05) (Table 2). For T2-WI MRI, the mean concentrations of ferrum and VEGF in hematoma cavity
fluid for the hyperdense group
were 38.96±6.37 μmol/L and 6142.43±549.87 pg/ml, res-
pectively, which were signifi -cantly lower than those in
non-hyperdense groups (P= 0.000 and P=0.000).
Mean-while, the mean concentrati- ons of ferrum and VEGF in he-
matoma cavity fluid for the
hy-podense group were 65.18± 8.63 μmol/L and 8194.17± 619.47 pg/ml, respectively,
which were significantly high -er than those in non-hypo-
[image:3.612.91.374.448.549.2]mixed-geneses is remain unclear [12]. Surgery opera-tion could reduce clinical progression of subdu-ral effusion [13]. However, injury of blood vessel secreted angiogenic growth factors, stimulated
the expression of inflammatory cytokine like
IL-8, were considered as the main factor in the CSDH formation and development [14, 15]. In 2007, Tokmak found that the VEGF concentra-tions in hematoma cavity from CSDH patients closely related with the formation of hematoma in brain CT images [16]. The increase of VEGF level could stimulate the formation and pro-gression of hematoma [10]. VEGF mainly took part in formation of new vessels, of which over-expression was related to many factors [8]. Otherwise, it was found that increase of Ferrum concentration could stimulate the formation of new vessel, which was mainly correlated with over-expression of VEGF [14]. Ferrum was
[image:4.612.92.372.73.423.2]wide-the transudations in vessels came into CSDH hematoma cavity. CSDH formation was a long process, which could range from several months to several years. The different stage showed different MRI signals. As a usual, the classical CSDH indicated high signal on T1 and T2 weighted images. It could also be showed with low, iso or mixed density signals because of the discovering time difference [17]. Hosoda performed a study with 20 CSDH patients [18] and patients with T1 image showed isodensity or low density signals occupy 30%. They specu-lated that that there was fresh hemorrhage in the hematoma cavity of above patients. For the patients with high density signals, researchers speculated that most of arterin had become methaemoglobin, indicated bleed several days ago. According to the changing process of hematoma of intracerebral hemorrhage, it Figure 2. Ferrum concentration of PB (peripheral blood) and HCF (hematoma
cavity fluid) in patients of each groups (A); VEGF concentration in HCF. VEGF
concentration in HCF of the isodense group, hypodense group, hyperdense group and mixed-dense group (B).
ly distributed in the brain and located at the white matter. Ferrum played important ro- les in many physiological functions such as brain oxy-gen transport, electron trans-port, neurotransmitter and myelin synthesis [10]. Ferrum mainly existed in hemoglobin, occupying approximately 2/3 of total ferrum element in the human body. During the for-mation process of chronic hematoma, Fe concentration increase gradually as the hemoglobin increase in hema-toma cavity. In our study, the
Table 2 showed that among the CSDH patients, Ferrum
concentration showed signifi -cant difference between the
hematoma cavity fluid and
could be showed by MRI signals. In Table 1,
onset time had significant difference among all groups (P<0.05). If it was the only reason that caused CSDH enlargement by the repeatedly micro hemorrhage in new vessel of hematoma outer membrane. Most of CSDH should show low, iso or mixed density signal on T1 MRI. MRI indicated that brain Fe precipitation shortened the T2 time, while did not change the T1 time. The ferrum in cell had a high magnetic suscep-tibility, so the ferrum over precipitation in brain could cause hypo magnetic susceptibility in the cell and low magnetic susceptibility out of the
cell. The uneven local magnetic field shortened
T2 time and showed low density signals on T2 weighted images. Although ferrum existed in
normal cells, it was not sufficient to exhibit the
obvious low density signal on MRI, especially
on low field MR facility. In the early stage of
CSDH, cavity substance had different content. Gore existence caused the signal uneven. Different ferrum concentration caused mag-netic resonance signal density uneven. In this
research, it showed that there was significant
difference on onset time (P<0.05). If no haem-orrhage in CSDH, it showed low density signals. If the patients were with blooding, it would show mixed density signals because of varied haemorrhage times. In this study, through immunohistochemistry analysis on VEGF con-centration, it was found that the patients with high Fe also had high VEGF level (P<0.05). According to this results, the increase of Fe concentration further stimulated VEGF over-expression, while VEGF could further stimulate immature new vessels formation. It was report-ed that the enlargreport-ed gap of immature new ves-sels of CSDH hematoma, caused the higher
concentration of VEGF in the fluid. It was con -sidered that ferrum ion related to tissue toxici-ty, including apoptosis and oxidative damage, which aggravated the secondary brain injury. It was also found that the ferric ion was overload-ed in the group of serious overload-edema.
Conclusion
In conclusion, it was found that ferrum ion played certain effects in the process of
hema-tomal formation, and confirmed that VEGF
could stimulate the CSDH formation. Ferrum ion may stimulate CSDH hematomal formation through promoting the VEGF over-expression. The detailed mechanism would be investigated further.
Disclosure of conflict of interest
None.
Address correspondence to: Li Fei and Ersong Wang, Department of Neurosurgery, Jinshan Hospital, Fudan University, Shanghai 201500, China. Tel: +86 34189990; Fax: +86 021-34189991; E-mail: [email protected] (LF); [email protected] (ESW)
References
[1] Lee KS. Natural history of chronic subdural haematoma. Brain Inj 2004; 18: 351-358. [2] Nedugov GV. [Forensic medical assessment
of health status dynamics in a victim of fatal traumatic subdural hematomas]. Sud Med Ekspert 2008; 51: 18-21.
[3] Markwalder TM. Chronic subdural hemato-mas: a review. J Neurosurg 1981; 54: 637-645.
[4] Iliescu IA. Current diagnosis and treatment of chronic subdural haematomas. J Med Life 2015; 8: 278-284.
[5] Kolias AG, Chari A, Santarius T and Hutchinson PJ. Chronic subdural haematoma: modern management and emerging therapies. Nat Rev Neurol 2014; 10: 570-578.
[6] Wang Y, Wang C and Liu Y. Chronic subdural haematoma evolving from traumatic subdural hydroma. Brain Inj 2015; 29: 462-465. [7] Park KS, Park SH, Hwang SK, Kim C and Hwang
JH. Correlation of the beta-trace protein and
inflammatory cytokines with magnetic reso
-nance imaging in chronic subdural hemato-mas : a prospective study. J Korean Neurosurg Soc 2015; 57: 235.
[8] Vaquero J, Zurita M and Cincu R. Vascular en-dothelial growth-permeability factor in granula-tion tissue of chronic subdural haematomas. Acta Neurochir (Wien) 2002; 144: 343-346; discussion 347.
[9] Shono T, Inamura T, Morioka T, Matsumoto K, Suzuki SO, Ikezaki K, Iwaki T and Fukui M. Vas-cular endothelial growth factor in chronic sub-dural haematomas. J Clin Neurosci 2001; 8: 411-415.
[10] Saghiri MA, Asatourian A, Orangi J, Sorenson CM and Sheibani N. Functional role of inorgan-ic trace elements in angiogenesis-part I: N, Fe, Se, P, Au, and Ca. Crit Rev Oncol Hematol 2015; 96: 129-142.
[11] Park SH, Kang DH, Park J, Hwang JH, Hwang SK, Sung JK and Hamm IS. Fibrinogen and D-dimer analysis of chronic subdural
hemato-mas and computed tomography findings: a
[12] Sangondimath G, Chhabra HS, Venkatesh R, Nanda A and Tandon V. A rare case of chronic subdural haematoma presenting with parapa-resis: a case report and review of literature. J Clin Orthop Trauma 2015; 6: 265-268. [13] Wang H, Zhao J, Li Y, Feng Y and Bie L. Surgical
management of the patients with chronic sub-dural haematoma and contralateral subsub-dural effusion: operation or no-operation? Brain Inj 2015; 29: 618-622.
[14] Bobrovnikova-Marjon EV, Marjon PL, Barbash O, Vander Jagt DL and Abcouwer SF. Expres-sion of angiogenic factors vascular endothelial growth factor and interleukin-8/CXCL8 is high-ly responsive to ambient glutamine availability: role of nuclear factor-kappaB and activating protein-1. Cancer Res 2004; 64: 4858-4869. [15] Hong HJ, Kim YJ, Yi HJ, Ko Y, Oh SJ and Kim JM.
Role of angiogenic growth factors and inflam
-matory cytokine on recurrence of chronic sub-dural hematoma. Surg Neurol 2009; 71: 161-165; discussion 165-166.
[16] Tokmak M, Iplikcioglu AC, Bek S, Gokduman CA and Erdal M. The role of exudation in chron-ic subdural hematomas. J Neurosurg 2007; 107: 290-295.
[17] Lin CC, Lu YM, Chen TH, Wang SP, Hsiao SH and Lin MS. Quantitative assessment of post-operative recurrence of chronic subdural hae-matoma using mean haehae-matoma density. Brain Inj 2014; 28: 1082-1086.