Second Language Acquisition Modeling: An Ensemble Approach
Anton Osika, Susanna Nilsson, Andrii Sydorchuk, Faruk Sahin, Anders Huss Sana Labs, Nybrogatan 8, 114 34 Stockholm, Sweden
{anton, susanna, andrii, faruk, anders}@sanalabs.com
Abstract
Accurate prediction of students knowledge is a fundamental building block of personalized learning systems. Here, we propose a novel ensemble model to predict student knowl-edge gaps. Applying our approach to student trace data from the online educational platform Duolingo we achieved highest score on both evaluation metrics for all three datasets in the 2018 Shared Task on Second Language Acqui-sition Modeling. We describe our model and discuss relevance of the task compared to how it would be setup in a production environment for personalized education.
1 Introduction
Understanding how students learn over time holds the key to unlock the full potential of adaptive learning. Indeed, personalizing the learning ex-perience, so that educational content is recom-mended based on individual need in real time, promises to continuously stimulate motivation and the learning process (Bauman and Tuzhilin, 2014a). Accurate detection of students’ knowl-edge gaps is a fundamental building block of per-sonalized learning systems (Bauman and Tuzhilin, 2014b) (Lindsey et al., 2014). A number of ap-proaches exists for modeling student knowledge and predicting student performance on future ex-ercises including IRT (Lord, 1952), BKT (David et al.,2016) and DKT (Piech et al.,2015). Here we propose an ensemble approach to predict student knowledge gaps which achieved highest score on both evaluation metrics for all three datasets in the 2018 Shared Task on Second Language Ac-quisition Modeling (SLAM) (Settles et al.,2018). We analyze in what cases our models’ predictions could be improved and discuss the relevance of the task setup for real-time delivery of personalized content within an educational setting.
2 Data and Evaluation Setup
The 2018 Shared Task on SLAM provides student trace data from users on the online educational platform Duolingo (Settles et al., 2018). Three different datasets are given representing users re-sponses to exercises completed over the first 30 days of learning English, French and Spanish as a second language. Common for all exercises is that the user responds with a sentence in the lan-guage learnt. Importantly, the raw input sentence from the user is not available but instead the best matching sentence among a set of correct answer sentences. The prediction task is to predict the word-level mistakes made by the user, given the best matching sentence and a number of additional features provided. The matching between user re-sponse and correct sentence was derived by the finite-state transducer method (Mohri,1997).
All datasets were pre-partitioned into train-ing, development and test subsets, where approx-imately the last 10 % of the events for each user is used for testing and the last 10 % of the remain-ing events used for development . Target labels for token level mistakes are provided for the training and development set but not for the test set. Ag-gregated metrics for the test set were obtained by submitting predictions to an evaluation server pro-vided by Duolingo. The performance for this bi-nary classification task is measured by area under the ROC curve (AUC) and F1-score.
Although the dataset provided represents real user interactions on the Duolingo platform, the model evaluation setup does not represent a realis-tic scenario where the predictive modelling would be used for personalizing the content presented to a user. The reason for this is threefold: Firstly, predictions are made given the best matching cor-rect sentence which would not be known prior to the user answering the question for questions that
have multiple correct answers. Secondly, there are a number of variables available at each point in time which represent information from the fu-ture creating a form of data leakage. Finally, the fact that interactions from each student span all data partitions means that we can always train on the same users that the model is evaluated for and hence there are never first time users, where we would need to infer student mistakes solely from sequential behaviour. To estimate predic-tion performance in an educapredic-tional producpredic-tion set-ting where next-step recommendations must be in-ferred from past observations, the evaluation pro-cedure would have to be adjusted accordingly.
3 Method
To predict word-level mistakes we build an ensem-ble model which combines the predictions from a Gradient Boosted Decision Tree (GBDT) and a recurrent neural network model (RNN). Our rea-soning behind this approach lies in the observa-tion that RNNs have been shown to achieve good results for sequential prediction tasks (Piech et al., 2015) whereas GBDTs have consistently achieved state of the art results on various benchmarks for tabular data (Li, 2012). Even though the data in this case is fundamentally sequential, the number of features and the fact that interactions for each user are available during training make us expect that both models will generate accurate predic-tions. Details of our model implementations are given below.
3.1 The Recurrent Neural Network
The recurrent neural network model that we use is a generalisation of the model introduced by Piech (2015), based on the popular LSTM architecture, with the following key modifications:
• All available categorical and numerical fea-tures are fed as input to the network and at multiple input points in the graph of the net-work (seeA.1)
• The network operates on a word level, where words from different sentences are concate-nated to form a single sequence
• Information is propagated backward (as well as forward) in time, making it possible to pre-dict the correctness of a word given all the surrounding words within the sentence
• Multiple ordinary- as well as recurrent lay-ers are stacked, with the information from each level cascaded through skip-connections (Bishop,1995) to form the final prediction
In model training, subsequences of up to 256 interactions are sampled from each user history in the train dataset, and only the second half of each subsequence is included in the loss function. The binary target variable representing word-level mistakes is expanded to a categorical variable and set tounknownfor the second half of each subse-quence in order to match the evaluation setup.
Log loss of predictions for each subsequence is minimised using adaptive moment estimation
(Kingma and Ba, 2014) with a batch size of
32. Regularisation with dropout (Srivastava et al., 2014) and L2 regularisation (Schmidhuber,2014) is used for embeddings, recurrent and feed for-ward layers. Data points are used once over each of 80 epochs, and performance continuously evaluated on 70 % of the dev data after each epoch. The model with highest performance over all epochs is then selected after training has fin-ished. Finally, Gaussian Process Bandit Optimiza-tion (Desautels et al., 2014) is used to tune the hyperparameters learning rate, number of units in each layer, dropout probability and L2 coeffi-cients.
3.2 The Gradient Boosted Decision Tree
The decision tree model is built using the Light-GBM framework (Ke et al., 2017) which imple-ments a way of optimally partitioning categori-cal features, leaf-wise tree growth, as well as his-togram binning for continuous variables (Titov, 2018). In addition to the variables provided in the student trace data we engineer a number of fea-tures which we anticipate should have relevance for predicting the word level mistakes
• How many times the current token has been practiced
• Time since token was last seen
• Position index of token within the best matching sentence
• The total number of tokens in the best match-ing sentence
• Preceding token
• A unique identifier of the best matching sen-tence as a proxy for exercise id
Optimal model parameters are learned through a grid search by training the model on the training set and evaluating on the development set to opti-mize AUC. The optimal GBDT parameter settings for each dataset can be found in the Supplemen-tary MaterialA.2.
3.3 Ensemble Approach
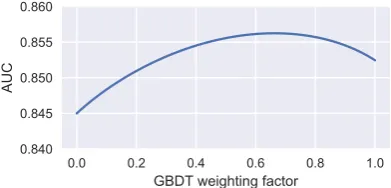
The predictions generated by the recurrent neural network model and the GBDT model are com-bined through a weighted average. We train each model using its optimal hyperparameter setting on the train dataset and generate predictions on the dev set. The optimal ensemble weights are then found by varying the proportion of each model prediction and choosing the weight combi-nation which yields optimal AUC score (Figure1).
Finally, the RNN and GBDT were trained using their respective optimal hyperparameter settings on the training and development datasets to gen-erate predictions on the test sets. The individual model test set predictions were then combined us-ing the optimal ensemble weights to generate the final test set predictions for task submission.
0.0 0.2 0.4 0.6 0.8 1.0
GBDT weighting factor
0.840 0.845 0.850 0.855 0.860
AUC
Figure 1: Ensemble model performance as a func-tion of the GBDT ensemble weight parameter for the en es dataset. 0.0 is equivalent to using only the neu-ral network model while 1.0 is equivalent to using only GBDT.
4 Discussion
Our ensemble approach yielded superior predic-tion performance on the test set compared to the individual performances of the ensemble compo-nents (Table 1). The F1 scores of our ensemble are reported in Table2. We note that although the within-ensemble prediction correlations are high
(Table 3), the prediction diversity evidently suf-fices for the ensemble combination to outperform the underlying models. This suggests that the RNN and the GBDT differ in performance on dif-ferent word mistakes. Most likely, the temporal dynamics modelled by the neural network model complement the GBDT predictions enabling the ensemble to generalise better to unseen user events than its component parts. Notably, none of our in-dividual models would have yielded first place in the Shared Task.
Model fr_en es_en en_es
RNN 0.841 0.830 0.851
GBDT 0.853 0.836 0.856
[image:3.595.335.500.218.262.2]Ensemble 0.857 0.838 0.861
Table 1: Model AUC scores on the test partition for all datasets.
fr_en es_en en_es
Ensemble 0.573 0.530 0.561
Table 2: Model F1 scores on the test partition for all datasets.
Data partition fr_en es_en en_es
dev 0.881 0.901 0.896
[image:3.595.326.505.385.416.2]test 0.884 0.894 0.898
Table 3: Pearson correlations coefficients between the GBDT and RNN predictions on the dev and test set for all datasets.
4.1 Feature Importance
Given the predictive power of our model we can use the model components to gain insight into what features are most valuable when inferring student mistake patterns. When ranking GBDT features by information gain, we note that 4 out of 5 features overlap between the three datasets (Figure4). The unique user identifier is ranked as second on all datasets, suggesting that very often a separate subtree can be built for each user. This implies that generalisation to new users for the GBDT model would result in performance degra-dation.
4.2 Relevance for Real Time Prediction Delivery
[image:3.595.83.279.473.567.2]fr_en es_en en_es token token token user user user format format format exercise id exercise id exercise id time token attempt time
Table 4: The top 5 GBDT model features by informa-tion gain.
setup where there is no need to generalize to new users this is not an issue. In a production setting however, the model has to serve new users, which would then have to be handled separately. Fre-quent retraining of the model would also be nec-essary to prevent performance degradation. This means that the unique user identifier is typically replaced by engineered features that represent the user history. An alternative would be to apply state based models such as Recurrent Neural Networks which by default encode user history without com-putational overhead or extra engineering effort.
4.3 Error Analysis
Although the predictive power of our model is high, there are mistake patterns that our model is not able to capture. The following sections cover two ways of characterizing subsets of the data where the model performs worse than on average. These observations could potentially be used to improve the overall model performance.
4.3.1 Performance Decay over Time
Due to the sequential partitioning of the training, development and test subsets, the model does not have information about each user’s mistakes for the most recent events. In Figure 2we note that this lack of information results in a degradation in performance as the predictions get further away from the horizon of labeled data points. Effects which drive this phenomenon include:
1. The data is non-stationary, i.e. the distribu-tion it comes from varies over time
2. The model has seen less relevant information about each user when the prediction is far away from the label horizon
3. The model is overconfident far away from the label horizon since it has never experienced missing information on a user level during training
We note that 3 would not be an issue if the model setup did not include a unique user iden-tifier, which would be desirable in a production setting. For models that do include a unique user identifier as a feature, one way to potentially over-come this performance degradation would be to systematically sample subsequences of the train-ing dataset on a user level, train models separately for each sample and then combine the models. In this way each submodel should be less reliant on the most recent exercise answers at any point in time and thus generalise better to the evaluation setup. This is in effect bagging with a sampling strategy taking consecutive time steps into account (Breiman,1996). We did not attempt to apply this error correction here but leave it for future work.
0.28 0.29
Log Loss
0.0 0.2 0.4 0.6 0.8 1.0 Fraction of max time
100000 200000 300000
Count
Figure 2: Performance decays as instances further away from the label horizon are considered. Log Loss is computed considering only instances before a given fraction of time, where time is normalized by the max-imum time for each user. Here performance decay for the en es dataset.
4.3.2 The Influence of Rare Words
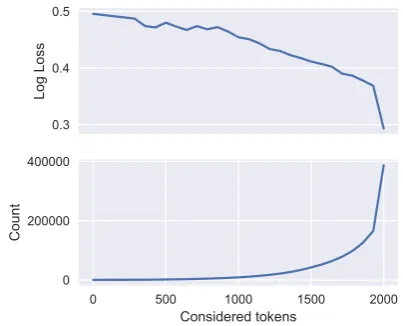
We note that the 4% of instances with the least common words contribute to 10% of the predic-tion error measured in Log Loss, Figure3. This insight gives opportunity to increase prediction performance. Although not attempted here, future work includes building another ensemble compo-nent specialized in predicting mistake patterns of words not previously encountered.
[image:4.595.314.515.291.451.2]pre-0.3 0.4 0.5
Log Loss
0 500 1000 1500 2000 Considered tokens
0 200000 400000
[image:5.595.79.281.64.227.2]Count
Figure 3: Log loss is high when considering only thex most rare tokens and low when considering all tokens on the en es dev partition.
dictive performance and allows insights about stu-dent mistake patterns. Thus our approach provides a foundation for further research on knowledge ac-quisition modeling applicable to any educational domain.
References
K. Bauman and A. Tuzhilin. 2014a. Recommending learning materials to students by identifying their knowledge gaps. In RecSys 2014 Poster Proceed-ings, pages 6–10, Foster City, Silicon Valley, USA.
Konstantin Bauman and Alexander Tuzhilin. 2014b. Recommending learning materials to students by identifying their knowledge gaps. InRecSys Posters.
Christopher M Bishop. 1995. Neural networks for pat-tern recognition. Oxford university press.
Leo Breiman. 1996. Bagging predictors. Machine Learning, 24(2):123–140.
Yossi Ben David, Avi Segal, and Ya’akov Kobi Gal. 2016. Sequencing educational content in class-rooms using bayesian knowledge tracing. In Pro-ceedings of the sixth international conference on Learning Analytics & Knowledge, pages 354–363. ACM.
Thomas Desautels, Andreas Krause, and Joel W. Bur-dick. 2014. Parallelizing exploration-exploitation tradeoffs in gaussian process bandit optimization. Journal of Machine Learning Research, 15:4053– 4103.
Guolin Ke, Qi Meng, Thomas Finley, Taifeng Wang, Wei Chen, Weidong Ma, Qiwei Ye, and Tie-Yan Liu. 2017. Lightgbm: A highly efficient gradient boosting decision tree. In I. Guyon, U. V. Luxburg, S. Bengio, H. Wallach, R. Fergus, S. Vishwanathan,
and R. Garnett, editors, Advances in Neural Infor-mation Processing Systems 30, pages 3146–3154. Curran Associates, Inc.
Diederik P. Kingma and Jimmy Ba. 2014. Adam: A method for stochastic optimization. CoRR, abs/1412.6980.
Ping Li. 2012. Robust logitboost and adap-tive base class (abc) logitboost. arXiv preprint arXiv:1203.3491.
Robert V Lindsey, Jeffery D Shroyer, Harold Pashler, and Michael C Mozer. 2014. Improving students long-term knowledge retention through personalized review.Psychological science, 25(3):639–647.
Frederic Lord. 1952. A theory of test scores. Psycho-metric monographs.
Mehryar Mohri. 1997. Finite-state transducers in lan-guage and speech processing. Computational lin-guistics, 23(2):269–311.
Chris Piech, Jonathan Spencer, Jonathan Huang, Surya Ganguli, Mehran Sahami, Leonidas J. Guibas, and Jascha Sohl-Dickstein. 2015. Deep knowledge trac-ing.CoRR, abs/1506.05908.
J¨urgen Schmidhuber. 2014. Deep learning in neural networks: An overview. CoRR, abs/1404.7828.
B. Settles, C. Brust, E. Gustafson, M. Hagiwara, and N. Madnani. 2018. Second language acquisition modeling. InProceedings of the NAACL-HLT Work-shop on Innovative Use of NLP for Building Educa-tional Applications (BEA). ACL.
Nitish Srivastava, Geoffrey Hinton, Alex Krizhevsky, Ilya Sutskever, and Ruslan Salakhutdinov. 2014.
Dropout: A simple way to prevent neural networks from overfitting. Journal of Machine Learning Re-search, 15:1929–1958.
Nikita Titov. 2018. LightGBM Features.
http://lightgbm.readthedocs.io/
en/latest/Features.html. [Online;
A Supplemental Material
A.1 The recurrent neural network model design
Our neural network model desisgn is described be-low:
1. For each word the network takes as input all available categorical features, excluding mor-phological features for each word. The exclu-sion was motivated by the fact that predictive ability added by morphological features was low when evaluated by a decision tree model.
2. Preprocessed numerical features fordaysand
time are concatenated to an input vector. (Preprocessing in this case means to normal-ize to mean zero, variance 1, remove outliers that are larger than 100, and concatenate the value itself with the value exponentiated to 0.5 as well as 2.0)
3. The categoriestoken,part of speech,format,
correctandexercise id(as described in3.2), are each mapped to an embedding vector of length 15.
4. The above categorical features are further combined with the feature correct by using the cartesian product, and then mapping each category to an embedding vector.
5. All categorical embeddings and numerical features are concatenated together forming an input vector.
6. The input vector is fed through a two layer bidirectional recurrent neural network, where the input to both of the layers are summed with the output, forming a user state vector.
7. Another input vector is formed by concate-nating categorical embeddings for the fea-tures token, part of speech, format, depen-dency label, dependency token, user id as well as preprocessed numerical features.
8. The user state vector is then projected to two scalars. This is done by dot multiplying it with a vector of trainable variables, as well as dot multiplying it with the second input vec-tor from step 7. The second part accounts for the original operation done by (Piech et al., 2015).
9. We furthermore compute one scalar for each categorical feature, that is specific for the cat-egory of the feature, similar to a logistic re-gression model.
10. Finally, the second input vector together with all computed scalars are concatenated and fed to a 3 layer feed forward neural network.
11. The sum of all scalar values and the output of the feed forward network forms our logit, which is fed through a sigmoid function out-putting the probability of a token level mis-take.
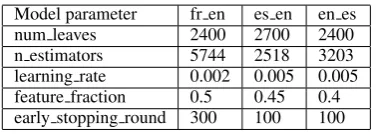
A.2 GBDT Hyperparameters
Model parameter fr en es en en es
num leaves 2400 2700 2400
[image:6.595.323.512.279.346.2]n estimators 5744 2518 3203 learning rate 0.002 0.005 0.005 feature fraction 0.5 0.45 0.4 early stopping round 300 100 100