THE
ECONOMIC & SOCIAL
RESEARCH INSTITUTE
Irish Input--Output Structures
I964 and I968
E. W. HENRY
THE ECONOMIC AND SOCIAL RESEARCH INSTITUTE
COUNCIL ~972 - 73
*T. K. WHITAKER, M.SC. (ECON.), D.ECON.SC., President of the Institute. *o. O’BRmN, D.LITT., LITT.D., Chairman of the Council.
T. j. BARRmGTON, Director, Institute of Public Administration.
*j. P. BEDDY, D.ECGN.SC., LL.D. (H.C.).
R. D. C. BLACK, PH.D., Professor, Department of Economics, The Queen’s University, Belfast.
*F. B. CHUBB, M.A., D.PmL., Professor, Department of Political Science, Trinity College, Dublin.
VERY REV. D. CREGAN, C.M., President, St. Patrick’s Training College, Drumcondra, Dublin.
G. DEAN, M.D., F.R.C.P., Director, ll/Iedico-Social Research Board.
REV. PETER DEMPSEY, O.F.M.CAP., M.A., PH.D., Professor, Department of Applied Psychology, University College, Cork.
N. J. GmSGN, B.SC. (.ECON.), PH.D., Professor, Department of Economics, The New University of Ulster, Colermne.
*w. A. HONOHAN, M.A., F.I.A., Secretary, Department of Social Welfare.
*REV. JAMES KAVANAOH, M.A., S.T.L., Professor, Department of Social Science, University College, Dublin.
*KIERAN A. KENNEDY, M°ECON.SC., B.PHIL., PH.D., Director of the Institute.
IVOR KENNY, M.A., Director, Irish lkIanagement Institute. T. P. LINEHAN, B.E., B.SC., Director, Central Statistics Office.
p. LYNCH, M.A., Associate Professor of Political Economy, University College, Dublin. CItARLES MCCARTHY, B.L., Chairman, Human Sciences Committee.
*M. D. MCCARTHY, M.A., PH.D., D.SC., President, University College, Cork. j. j. MCELLmOTT, U.A., LL.D., Past President of the Institute.
o. A. ~aEAGIIER, B.COMM., D.P.A., Deputy Secretary, Department of Local Government. *j. F. MEENAN, M.A., B.L., Professor of Political Economy, University College, Dublin. *c. H. ~IURRAY, Secretary, Department of Finance.
J. c. ,NAGLE, M.CGMM.
D. NEWN, Assistant General Secreta(y, Irish Congress of Trade Unions.
RIGHT REV. lvIGNSIGNGR j. NEWMAN, M.A., D.PI-I., President, St. Patrick’s College,
May-nooth. ,
TADHO 6 CEARnHA~LL, Secretary, Department of Labour.
REV. E. F. O’DOHERTY, M.A., ~.D., PH.D., Professor, Department of Logic and Psychology, Uuiversity College, Dublin.
D. P. O’MAHONY, M.A., PH.D., B.L., Professor, Department of Economics, University College, Cork.
LABHRAS 6 NUALLAIN, D.ECON.SC., Professor of Economics, University College, Galway. *w. j. L. RYAN, M.A., PH.D., Professor of Political Economy, Trinity College, Dublin.
P. G. SHERRY, M.SC., PH.D., Confederation of Irish Industry. T. WALSH, D.SC., Director, An Foras Taluntais.
IRISH INPUT - OUTPUT
STRUCTURES I964 and I968
E. W. HENRY
Copies of this paper may be obtained from
the Economic and Social Research Institute, 4 Burlington Road, Dublin 4.
Price £i.oo
CONTENTS
SUMMARY
Section I: Import Classification used; Input-Ontput Table for I968 corresponding to 1964 Published Table
Section 2: Final Demands i964 and i968 broken down into their Primary Input Components
Section 3 : Allocations of Imports for i964 and i968
Section 4: Changes in Inter-Industry Direct Input Coefficients between 1964 and 1968
Page 7 9
I2
i8
24
LIST OF TABLES Table
I. Primary Input Content of Final Demand 1964 and 1968
Direct plus Indirect Import Content of Selected Final Demands 1964 and 1968
3- Listed Items of Similar Imports completely or mainly Inter-Industry Inputs, 1964 and 1968
4. Listed Items of Similar Imports completely or mainly Final Demand Inputs, i964 and 1968
5. Changes 1964 to 1968 of Direct InpUt Coefficients, by size of change and size of coefficient, at current prices
6. Changes 1964 to 1968 of I 16 Direct Input Coefficients exceeding o.o2 for 1964, by size of change and size of coefficient, at 1968 prices REFERENCES
Page 14 16
2O 22
27
3°
Table
I.I Primary Input Components of Final Demand I964 1.2 Primary Input Components of Final Demand 1968
Page 34 35 Total Primary Input Requirements per:£ i unit of Final Demand,
1964 and 1968, 33 sectors Fadngpage 36 Inter-Industry inputs of Similar Imports comparedwith com-bined Similar Imports and Domestic Outputs, Inter-lndustry,
I964 and I968; 33’ sectors ,~ ~- : : " .... ~ 37 Direct flows of similar Imports tO Final Demand;~ 1964 and1968, 33~sectors ~ ~ ~ : ~ 38 Allocations of Complementary Imports, 1964 and i 968, 33 sectors 39
33--sector Input-Output Transactions 1968 ~ :(i), (ii) 33,,-sector Direct Input Coefficients 1968 ’ , (iii)
33--sector I--A Inverse (InterdependenceCoefficients) 1968 (iv)
ACKNOWLEDGMENTS
While responsibility for the content of the paper is entirely his own the author wishes to thank Dr K. A. Kennedy, Dr R. C. Geary and Professor R. O’Connor of the Economic and Social Research Institute for valuable comments and suggestions on the draft report at all stages of its preparation.
He wishes also to express his sincere thanks to the Director of the Central Statistics Office for permission to use and publish the 1968 Input-Output Table and all the related statistical data which are the subject matter of the paper.
Irish Input-Output Structures 1964 and 1968
E. W. HENRY*
SUMMARY
This paper is divided into four main sections as follows:
(I) Import classification used; input-output table for 1968 corresponding to 1964 published table.
(2) Final demands 1964 and 1968 broken down into their primary input components.
(3) Allocations of imports for 1964 and 1968.
(4) Changes in inter-industry direct input coefficients between i964 and 1968.
The text contains six tables and in addition there are three appendices. The 1968 input-output table described in Section i of the text appears in Appendix
3, which gives the transactions the direct input coefficients and the inter-dependence coefficients (I--A Inverse). Primary input components of final demand 1964 and 1968 form Appendix I. Part I of Appendix 2 has 1964 and 1968 unit final demand broken down into the primary input components, for each of the 33 productive sectors. Parts 2, 3 and 4 of Appendix 2 show 1964 and 1968 allocations of similar and complementary imports to aggregate pro-ductive sectors and to various columns of final demand.
Import Classification Used
If one requires detailed analysis of the import content of parts of final demand for a given transactions table, then imports must be fully allocated in detail to each column of the transactions table and all imports are treated as primary inputs. The alternative treatment distributes "similar" imports along the inter-industry rows with domestic products and thus permits substitution to occur, the combined flow being relatively stable, as a proportion of total input to each column of a productive sector. This latter treatment of similar imports makes for easier compilation of transactions tables and the derived coefficients have certain advantages.
Input-Output Table for x968
¯ This table matches that for 1964 published in [4], apart from extension of the 1964 list of similar imports for 1968 and a transfer of tourist expenditure from 1964 invisible exports to 1968 personal expenditure column of final
demand. Some data deficiencies of the 1968 results are discussed.
Primary Input Components of Final Demand z964 and z968
At the level of the four main sub-aggregates of final demand, the direct plus indirect content for major primary inputs is fairly stable for the two years. Personal expenditure 1968 has 27 per cent imports, 21 per cent indirect taxes, 29 per cent wages etc. and 27 per cent gross’profits. Government current expenditure shows i o per cent imports, 73 per cent wages etc. and 15 per cent gross profits for 1968. Gross fixed capital formation 1968 has 47 per cent imports, 37 per cent wages etc. and I I per cent gross profits. Exports except tourism have 3° per cent imports, 27 per cent wages etc. and: 44 per cent gross profits 1968. For this latter sub-aggregate of final demand, imports increased by 5 per cent and gross profits decreased by 6 per cent over the four-year interval.
Allocations of imports for Yc964 and z968
For inputs of similar imports to productive sectors (i.e. total inter-industry) the changes between 1964 and 1968 are examined in some detail by means of permanent importsof commodities known to be wholly or mainly used by the productive sectors. Some measures of the changes caused by the I968 extension of the lists of 19641 similar imports are shown. A paral!el assessment of final demand commodities is also made. The complementary import patterns are then analysed and compared for the two years.
Changes in Directlnput Coejfieients between z964 and 1968
IRISH INPUT-OUTPUT STRUCTURES 1964 AND 1968 9
of coefficients. A detailed analysis of the underlying causes of large changes in some nine large coefficients is given as an illustration of the causes at work throughout the system. Conclusions are drawn, as to the need for better data on input structures of some sectors, the importance of only one coefficient in four, and the difficulty of obtaining a fully satisfactory list of similar imports.
SECTION i: IMPORT CLASSIFICATION USED; INPUT-OUTPUT TABLE FOR i968 CORRESPONDING TO PUBLISHED 1964 TABLE
Input-Output Results for x956, x96o and x964
The first input-output results for Ireland were for the year i956 and con-sisted of a transactions table of 36 sectors, having competitive imports
distri-buted along with domestic commodities. This table was prepared in the Central Statistics Office (CSO) but the results were not released officially. Later they were unofficially published in a paper by J. McGilvray [I]. A table for 196o, also compiled at CSO, appeared unofficially in R. C. Geary’s "Lectures on Input-Output" [2]. This table had all imports distributed along a single row, but otherwise was of the same design as that of 1956. A curtailed version of the 1960 table, having 9 productive sectors, appeared in Dr Geary’s paper on an Input-Output Decision Model [3]. The first official CSO input-output publica-tion, "Input-Output Tables for 1964" [4], contained tables of 92, 33 and 17 productive sectors, with similar imports distributed along with domestic commodities.
Two Systems for Classifying Imports
In the Irish input-output compilations two systems for classifying imports have been in use. The first system for classifying imports by type subdivides them into competitive and non-competitive categories. Competitive imports are those kinds which compete directly with domestic products on the home market and are close substitutes for domestic items. Examples are furnished by woollen piece goods, biscuits, assembled motor cars etc. Non-competitive imports include those goods which have no domestic equivalent (e.g. crude petroleum, tea, aircraft components) as well as all items not defined as com-petitive.
petro-leum, tea and aircraft components referred to above as non-competitive: The 1968 list of items is restricted to items which could not be domestically produced or which are unlikely to be produced at home for some years ahead, this 1968 list being somewhat smaller than that of 1964.¯ ~31e complementary imports of 1968 include most components of unassembled vehicles and many kinds of machinery parts.
The system which has the similar and complementary import classification is considered the more satisfactory for Irish conditions. It is likely that the 1968 listing of similar imports will change only slightly over 6 to 8 years although the range of home-manufactured goods becomes extended via growth and diversification of the manufacturing sector. A relatively stable pattern of input per £I unit of output of purchasing sectors is obtained by combining domestic commodities with similar imports, since substitution between domes-tic and imported comm0ditles can occur along a row of the transactions table without significantly changing the input structures. The assumption of a 0ne-to-one value substitution is unlikely to be seriously ill error.
This treatment of similar imports has one further main advantage. In compiling the transactions table, Census of Industrial Production data for materials used, such as woollen piece goods purchased by the clothing industries, do not need to be broken down between domestic and imported components. The total supply, consisting of domestic and imported item-groups, can thus be distributed to known or estimated purchasers without breakdown of each transaction between domestic and imported shares.
There is one serious disadvantage of this treatment of similar imports, namely that the direct plus indirect import content of final demand is avail-able only for final demand as a whole, not for ally of its rows or columns. That final demand as a whole directly and indirectly absorbs all imports is
obvious.
It is not the purpose of this essay to go into the algebraic explanation of estimation of import content and a technical discussion is contained in[5]-In
fact,
the highest possible precision is needed (using all available detailed information) as tothe amounts of similar and complementary imports absorbed directly by each column of the transactions table, ill order to get a precise estimate of the total import content per unit of final demand for the domestic output of a particular row. For a detailed answer, one must use detailedinformation.
Thus for this latter kind of result, which is of some importance, it is necessary to allocate the similar imports ill exactly the same way as complementary imports--to estimate the amounts purchased by each input Column. Both kinds of imports are now primary inputs and the I--A inverse relates only to purely domestic coeificients. An analysis Of this kind for 1964 and 1968* is described in Section 2 below.
IRISH INPUT-OUTPUT STRUCTURES i964 AND 1968
Input-Output Results for x968 corresponding to published x964 Table of 33 Sectors
A transactions table for I968, compiled at CSO and having 33 productive sectors and similar imports distributed with domestic commodities along the first i6 rows, appears as part I of Appendix 3. The aggregates of the similar imports distributed along these I6 rows appear as the first I6 entries of the column "Merchandise Imports" and are subtracted off each corresponding total flow to give domestic flow for each of the I6 rows in question. Except for tourist expenditure i968 being included with households in personal expenditure, whereas tourist expenditure i964 was included in invisible exports, the design corresponds with that of the 33-sector table for I964 published in [4]. Part 2 of Appendix 3 has the direct input coefficients, which sum to unity for each column of the 33 columns, showing the inputs to (purchases by) the productive sectors, for £I worth of domestic output. In part 3 of Appendix 2 are given the interdependence coefficients, showing the direct plus indirect costs of inputs per £I of domestic output to final demand. For £I of final demand for the output of the domestic sector named at the head of the column, the direct plus indirect costs of required inputs are shown in that column. The interdependence coefficients are sometimes referred to as "total requirement coefficients" or as the I--A inverse. Various algebraic models for des-cription of direct input and interdependence coefficients appearin [ I ], [2] and
[5]-It is to be noted that the i968 interdependence coefficients as calculated assume that the flows along the first 16 rows are completely domestic, although there are, in fact, flows of similar imports included in these transactions. Thus the coefficients, as shown, assume similar imports for i968 behaving like domestic activities and requiring direct plus indirect inputs for their produc-tion. Such over-estimation is corrected for by subtracting total similar imports for a row from total final demand for that row, and using the difference to multiply up the corresponding column of interdependence coefficients so as to obtain the vector of domestic outputs required. The similar imports can be thought of as negative exports having a uniform shrinkage effect on aggregate final demand for a particular row, for the purpose of any application of final demand multipliers to the columns of the I--A inverse.
Once the domestic outputs of the sectors have been calculated for any pattern of final demand less similar imports, via use of the columns of the I---A inverse, the primary input coefficients of part 2 of Appendix 3 can be applied to give complementary import requirements, wages/pensions arising, and so on, for such levels of domestic outputs. The primary input flows direct to final demand are outside the scope of the input-output (denoted by I--O below) model as shown in parts 2 and 3 of Appendix 3 and have to be added on to any solutions derived from such a model.
Data Deficiencies of the I968 Transactions Table
similar import classification. The figures, however, havesome limitations which make certain sections :of the 1968 table not comparable with 1964 data apart from effects of changes in similar import lists. For 1968, profits and depreciation data were not available for individual sectors within transport-able goods and had to be distributed pro rata remainder of net output, as given by the Census of Industrial Production for 1968. Thus the rows for profits, depreciation and artificial sectors n.e.s, within columns 5-16 inclusive have less precise entries than those of the 1964 table. Otherwise, less detail was used for compilation row-wise than in the case of I9641 The 33-sector 1968 table is considered to be a fair approximation to what would emerge from the detailed level of treatment used in compiling I964 I--O results.
In the 33 × 33 matrix of inter-industry transactions, there were 333 non-zero entries for 1964 and395 non-non-zero entries for i968. For 29 entries of 1964,there are blanks for 1968, these 29 having an aggregate of ~I 5"7 million and in thousand pound units, an average value of 541 which is about one-fifthof the average transactions value for the other 304 non-zero 1964 co-efficients. There are 91 non-zero 1968 transactions corresponding to blanks in I964, their aggregate being £21.4 million and in thousand pound units, their average value being i~35, which is about one-seventeenth that of the other 304 non-zero 1968 entries. Thus the 120 transactions which are matched by blank cells of the table in either 1964 or 1968 are of relatively small average size. Thelrappearances or disappearances result from incomplete or incon-sistent information and necessarily arbitrary allocations. Some four kinds of data problem can explain them. In the detailed listing of materials used as given by the census of industrial production, certain minor inputs may appear in one year and not in another, the degree of detail to some extent depending on the respondents. In the same context, relatively trivial inputs may be described as "other" i.e. unspecified and in compiling the transactions table a reasonable but~ arbitrary guess is required to specify the kind of input in question. For certain relatively small sectors such as forestry, fishing, farmers’ peat (part Of solid fuel), the 1964 input structure was revised to appear more likely for 1968, on the basis of improved information or second thoughts on
costings. Finally, recourse had to be made to sample data for input patterns of certain service sectors and it was decided touse the structures available for 1968 rather than adhere rigidly to those used for 1964. In summary, these I";’0 entries unmatchedby non-zero entries in either year are of minor importance in the overall scheme, although they portray weaknesses in the data.
SECTION 2: FINAL DEMANDS I964 and I968 broken down into their PRIMARY INPUT COMPONENTS
IRISH INPUT-OUTPUT STRUCTURES I964 AND I968 13
of final demand in terms of primary inputs, 33-sector I--O tables for i964 and i968 have been compiled at CSO in which all similar imports have been extracted from combined flows for rows I-I 6 and, like complementary imports, treated as primary inputs. The similar imports were extracted by examining
the kinds of commodities in considerable detail, with reference to Census of Industrial Production "material used~’ and taking the imports pro rata the total input of a commodity, if more than one user occurred. By using the primary input coefficients and I--A inverse derived from these transactions tables, each column of final demands can be analysed into its primary input com-ponents. Part i of Appendix i gives such an analysis for i964 and similar results for i968 appear in part 2 of Appendix I. The primary input components are also shown in percentage form. Table i brings together the summarised results and derived percentages for I964 and I968. The pattern for personal expenditure shows little change for i968 compared with i964, with gross profits reduced by 2 per cent and imports reduced by I per cent, for a 3 per cent increase in indirect taxes. Government current expenditure for the later year shows smaller wages (3 per cent) with profits and imports increasing. Gross fixed capital formation for I968 has a 2 per cent increase in indirect taxes and a I per cent increase in imports with compensating reductions in wages and profits. The I968 exports show a sizeable (5 per cent) increase in imports, which indicates less reliance upon agriculture and food industries (which have relatively small import content) and development of exports from expansions in other sectors of manufacturing. The i968 exports also show a 4 per cent increase in wages and a 2 per cent increase in subsidies, by contrast with a 6 per cent reduction in gross profits.
That the pattern is fairly stable, but showing certain noticeable changes over a four year span is one general conclusion. That the import content of exports would likely be reduced by a major expansion of exports from agricul-ture and certain food industries (as might happen via the Common Market), with increased profits content is a further conclusion. Reduction in the subsidy on exports is likely also as we move towards full Common Market Membership. Part I of Appendix 2 compares the primary input analysis of a £i unit of i964 and 1968 domestic output to final demand, from each of the 33 productive sectors of the transactions table. The primary input components add to unity for each productive sector and include direct and indirect requirements for each primary input. It is these coefficients, when weighted by the corresponding domestic components of each column of final demand, which give the entries denoted "Via intermediate" in Appendix I. Each £I of final output of i968 agricultural crops, for instance, requires £o.2i9 of imports, as against only £o.o97 for livestock. Metal etc. needs £o.7o7 of imports directly and indirectly per £ I of final demand. By means of these "Total requirement" coefficients it is possible to analyse any pattern of final demand for domestic outputs.
a~
o o
oo
~h
~o
~o
~o
~o
~o
~-.o ~"r. ~--’9 ~.
.~’~ ~- ,~-~ ~’~ o
co~ co~. ~-...c~. t-.co
v ~.v L~ 0 ~,~
°
0~u’~O
~0
0 CO 0~-~.
M
°
0 v
O
~.o ~*~ ~*~ ,., c~
v
0
IRISH INPUT-OUTPUT STRUCTURES i964 AND 1968
15
catering margin, because of known changes in assumed input structures and, for (6), growth of metal mining which was negligible for 1964. For these one might regard the 1968 coefficients as being the best available. Two sets of coefficients are hardly sufficient for precise prediction of future values but at least indicate, for the other sectors, the variability over a four-year span. For the coefficients under discussion, the two most important causes of change are (a) changes of relative importance of sub-sectors within sectors e.g. animal slaughtering within food (b) incomplete information on input structures which involves either assumptions of structure or use of small sample results. Section 4-following will consider these and other causes of changes in coefficients.
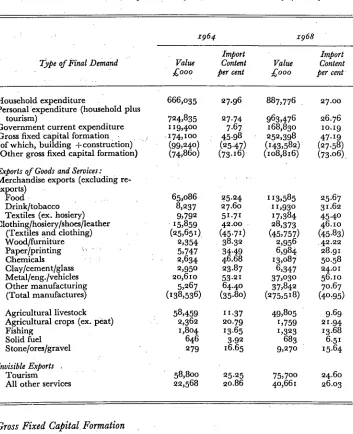
Comparison of x964 and x968 Import Content of Selected Final Demands
Because the direct plus indirect import content of components of final demand or aggregates of the latter is important for balance of payments purposes, Table 2 has been compiled to show such results. The constancy or change of the import content, as a percentage of each final demand value, for 1968 compared with 1964, shows how stable or otherwise is the import ingredient. There is also some interest in the magnitudes of the final demand components themselves. If the import percentage is relatively stable for the two years although the value of the item has increased considerably between 1964 and 1968, then that import percentage is likely to be a fairly reliable estimator, for applications to the corresponding item of final demand for some other year.
Household Expenditure
The import content of household expenditure and of personal expenditure (household plus purchases by tourists) is 28 per cent for 1964 and 27 per cent for 1968, although the value of these items has increased by about one-third over the four years. Thus an import estimator of 27 per cent should be fairly reliable, with an error of I per cent giving rise to an import error of the order of£Io million.
Government Current Expenditure
Government current expenditure increased by some 4° per cent over the four-year span, with the import content increasing from 7"7 to lO.2 per cent, mainly because of increases in medical supplies for local authority hospitals etc. The import percentage might increase further in years following 1968,
TABLE 2 : Direct Plus Indirect Import Content of Selected Final Demands x964 and x968
x964 x968
Import Import Type of Final Demand Value Content Value Content ¯ ~,ooo per cent ~ooo per cent
Household expenditure
Personal expenditure (household plus tourism)
Government current expenditure Gross fixed capital formation
(of which, building +construction) .... ( (Other gross fixed capital formation) Exports of Goods and Services:
Merchandise exports (excluding re-exports)
Food
Drink/tobacco Textiles (ex. hosiery) Clothing~hosiery/shoes/leather
(Textiles and clothing) Wood/furniture Paper/printing ~’ ’ Chemicals : : Clay/cement/glass Metal/eng./vehicles Other manufacturing (Total manufactures) Agricultural livestock Agricultural crops (ex. peat) Fishing
Solid fuel S tone/ores/gravel Invisible Exports .
Tourism
All other services
666,o35
724,835 Ix9,4oo -174,xoo (99,24°) (74,860)
27.96 887,776 27.0o 27.74 963,476 26.76
7.67 I68,83o 1o.I9 45.98 252,398 47.I9 (25.47) (I43,582) (27.58) (73.x6) (io8,816) (73.06).
65,o86 85.24 i 13,585 25.67 8,237 27.6° 11,93o 31.6~ 9,792 51.71 x7,384 45.4° . I5,859 42.oo 28,373 46.Io (25,65I). (45-7I) (45,757) (45.83) 2,354 38.32 2,956 .4~.22 5,747 34.49 6,984 ~8.9I 2,634 46.68 I3,O87 5o.58 2,95o 23.87 6,347 24.oI 2o,6io 53.2I 37,o3o 56.IO 5,267 64.4o 37,842 7o.67 (I38,536) (35.8o) (275,518) (40.95)
58,459 x i .37 49,8o5 9.69 2,362 2o.79 1,759 21.94 1,8o4 x3.65 1,323 I3.68 646 3.92 683 6.5I 279 I6.65 9,27o 15.64
58,8o0 25.25 75,7oo 24.6o 22,568 2o.86 4o,66I 26.o3
Gross Fixed Capital Formation
IRISH INPUT-OUTPUT STRUCTURES I964 AND i968 17
inputs of metallic materials such as those for central heating, plumbing and electrical wiring etc. This increase might continue for some years ahead. The remainder of GFCF had the remarkably high import content of 73 per cent in both years. This residual GFCF is mainly plant, machinery and vehicles and consists of imported assembled or unassembled components which have very little domestic value added after import. The 73 per cent level is considered un-likely to increase. The overall GFCF import level of about 47 per cent was kept stable by the same 45 per cent growth rate for both building and the residue. For any predictions of import content of GFCF it is clearly desirable to treat the two components separately, since the import content of the aggregate will depend significantly on the relative weights of the two components.
Merchandise Exports
Since Table 2 shows the details, the following comments will be limited to a few salient points. The exports in question are the domestic outputs of the sectors, with re-exports excluded, the latter, however, being included in results of Table I. Values are shown at producers’ prices, thus the results of Table 2 exclude import content of trade and transport margins arising between the factory and the port.
For individual items within the fifteen separate kinds shown, the import percentage shows increases or decreases of up to 6 per cent e.g. textiles (ex. hosiery): 51.7 for 1964 and 45"4 for 1968, other manufacturing: 64.4 for 1964 and 70.7 for 1968. No recommendations will be made here on methods of projecting the import percentages. The two sets of figures at least illustrate the range of difference one can expect over four years. By far the highest percentage is that of other manufacturing, at 70.7 per cent for 1968, an increase of 6.3 per cent since 1964. This sector is a group of industries of very diverse nature, depending heavily upon imported material inputs and in some instances being included in the sector for reasons of data confidentiality. Petroleum refining, rubber goods, tyre re-treading, plastic products including packaging, as well as certain kinds of light engineering, all form parts of the sector. By referring to the 73 per cent import content of other GFCF mentioned above, one might surmise that the import content of other manufacturing is unlikely to exceed the order of 75 per cent.
For exports of total manufactures the growth over the four years was
99 per cent, a remarkable achievement. The import content increased from 36 to 41 per cent. The extra 5"2 per cent of the 1968 level of£276 million means some £i4 million extra imports, whereas £23 million is due to the increase of £32"5 million of exports from other manufacturing, having a I968 import content of 7o.7 per cent. So that the increased weight of the latter import-intensive sector accounts for a larger part of the overall increase of £63 million than does the increase of 5 per cent in the rate of import content per unit, for total manufactures.
only some i o per cent for livestock is due to the former directly and indirectly absorbing imported fertilisers and materials for fertilisers.
A final general comment on the variations in import proportions for each separate kind as listed is that the variation may be due to changes in relative weights of sub-sectors within the sector listed. Some of these changes in weighting pattern are considered below in Section 4 of the paper. If one were treating 5° separate sectors of manufacturing, rather than the lO sectors used in Table 2 and elsewhere, one might find stable import percentages for many of the 5° sectors.
Invisible Exports
At about 25 per cent for both years, the import content of tourism expendi-ture appears to be stable. The breakdown of this expendiexpendi-ture among purchases of goods and services is of doubtful reliability and thus the figure of 25 per cent is to be regarded as of the right order of magnitude, rather than precise. It is roughly the same as that of personal expenditure, which showed some 27 per cent for 1968.
The main component of all other services is transport, which formed about two-thirds of the export for I964 and about three-quarters for I968. The import content of transport was 24"3 per cent for I964 and 29"4 per cent for I968, the increase of 5 per cent arising from increasing relative weight of air transport. This double effect is the main cause of the increase from 21 to 26 per cent import content of all other services, i964 to I968. It is difficult to predict whether the 26 per cent level of I968 is likely to increase in later years. One could use levels such as 30 or 33 per cent for alternate estimates of import content.
SECTION 3: ALLOCATIONS of IMPORTS for I964 and I968
Comparison of x964 and z968 Similar Imports Allocated to Productive Sectors (i.e. aggregate Inter-Industry)
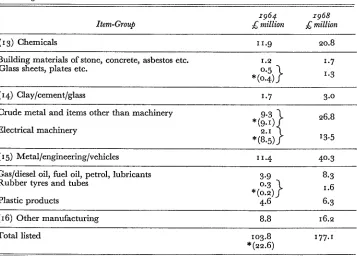
The expansion of the list of domestic products between 1964 and 1968 revealed that some imports treated as complementary for 1964 should change their status for 1968 and become similar. It was decided that tile 1964 listing of similar was particularly restrictive for (15) metals/engineering/vehicles and (16) other manufacturing, with less need of extension for the other manu-facturing sectors. Accordingly, the list of similar imports was extended for 1968 with the intention of making it sufficiently comprehensive to cater for new domestic products in the foreseeable future. Thus the combined flows of domestic products and similar imports as specified for 1968 rows (I) to (16) are expected to have improved stability for some years ahead.
IRISH INPUT-OUTPUT STRUCTURES 1964 AND 1968 19
productive sectors is summarised in Part 2 of Appendix 2. For 1964 the aggre-gate value was £IO2.8 million, forming 20.0 per cent of the combined flow of rows (I) to (I6) absorbed by sectors (i) to (33). The corresponding similar import flow for I968 was of value £I84.5 million, at the level of 23.6 per cent. Table 3 goes some way towards showing changes in levels ’of similar imports between i964 and i968 as well as the effects of expanding the list for i968. As far as is practicable the item-groups shown are of goods wholly or mainly used as inputs to productive sectors rather than goods for final demand. Although the entries in Table 3 exclude parcel post, temporary transactions and Shannon trade, being confined to permanent import values shown in the main body of the Official Import List, the changes in general explain those appearing in Part 2 of Appendix 2. The 1964 entries which were treated as complementary and thus not matching the fuller i968 list are shown in brackets and marked with an asterisk and not included in the i964 sector aggregates.
The decrease of £2 million inputs of agricultural livestock is shown in the permanent imports of live animals except greyhounds. The £4 million increase for agricultural crops arises in imports of unmilled cereals and cereal seeds. Some £2 "8 million increase in animal feed imports explains the like increase in food imports. For textiles except hosiery about £7 million of the £Io million increase is shown by the items listed in Table 3. Of the total £4.2 million increase in clothing etc. similar imports, £2"4 million appears in Table 3, as does £4 million of the overall £5.6 million increase in wood manufactures. Of the £6.4 million increase in paper imports, £2.6 million for pulp and waste paper is due to expansion of the i964 list of similar imports to include this item-group. The apparent increase of £3° million for metal items and
electrical components would be reduced to some £I2 million if listing of items for 1964 was consistent with that of 1968. About half of the £8.6 million increase for other manufacturing is likely to be due to petroleum products and tyres etc., after allowing some of the former to final demand, with the latter absorbed by productive sectors including an artificial sector for vehicle repairs. The overall aggregates of £Io4 million for I964 and £i77 million for I968 approximate the £io3 million and £I85 million respectively of Appendix 2 (Part 2). Some £23 million extra for i964 would have entered the lists, on the basis of I968 similar import definitions. The Table 3 results for textiles (ex. hosiery), clothing etc. and metal etc. would show somewhat greater increases between I964 and i968 if Shannon trade had been included. The allocations in Parts 2, 3 and 4 of Appendix 2 include all relevant items, namely the permanent and temporary imports treated as similar, together with estimates of parcel post and Shannon components.
Comparison off964 and 1968 Similar Imports Allocated to Final Demand
TABLE 3: Listed Items of Similar Imports Completely or Mainly Inter-Industry Inputs, r964 and,z968.¯ (Values exclude ParcelPost, 2~emporaiyTransactions, Shannon Trade).
. . , , . x964 5r968
Item-Group : .... £ million £ million ¯ Live animals excludir/g greyhounds " ! I7.2 15.o~
Wool and hair 3.7 i 3.6
(I) Agricultural livestock "2o.9 x8.6
Unmilled cebeals and seeds of cereals :
. : 9.3 13.3 (2) Agricultural crops " 9.3 13.3
. , . : ,
Animal feed excluding dog food : 5.o 7.8 Hides and skins, undressed o.7 0.8
(7) Food 5.7 8.6
Wool tops, noils, shoddy etc. Synthetic fibres
Woollen and worsted yarn Yam of cotton, flax, hemp Synthetic yarn
Cotton and linen piece goods Woollen piece goods Synthetic piece goods Coated piece goods
1.5
*(i.o)
3-7 1.6 2.9
5.5¯ 1.5 2.3 o.9
1.9 ¯ I.4 2.6 1.6 5"9
5.6 2.1 ~. 4.3
I..4
(9) Textiles (except hosiery) : 19.9 ~6.8
¯ Knitted fabric : o.7 2.5
Leather x .5 0. I
(ro) Clothing etc. 2.2 4.6
Sawn lumber 6. x 9.3
Wood sheets, plywood etc. 1.2 2. I
(I x) Wood/furniture 7.3 I 1.4 Pulp and waste paper
Newsprint and other printing and writing paper Paper for packaging
Bags, boxes etc.
*(2.i)
2.8 3.1 o.82.6 3.0 6.4 1.5 (x 2) Paper/printing 6.7 . 13.5
Manufactured fertilisers Fixed vegetable oils and fats Medical and veterinary
items
Insecticides, fungicides, weed-killers etc.
6.9 1.3
o.4
9.I
IRISH INPUT-OUTPUT STRUOTURES 1964 AND 1968 2I TABLE 3--continued
x964 x968 Item-Group £ million £ million
(I3) Chemicals 1 I.9 2o.8
Building materials of stone, concrete, asbestos etc. 1.2 x.7
0.5
Glass sheets, plates etc.
. (o.4) } I.3
(I4) Clay/cement/glass 1.7 3.o
Crude metal and items other than machinery
.(9"3)7 26.8 Electrical machinery
*(8.5)f
i3.5
(I5) Metal/engineering]vehlcles I 1.4 4o.3
Gas/diesel oil, fuel oil, petrol, lubricants 3.9 8.3
0.3
Rubber tyres and tubes
* (o.2)~J 1.6
Plastic products 4.6 6.3
(I6) Other manufacturing 8.8 I6.2
Total listed i o3.8 177. I
*(22.6)
* Treated as Complementary for 1964 and value excluded from sub-aggregates shown above.
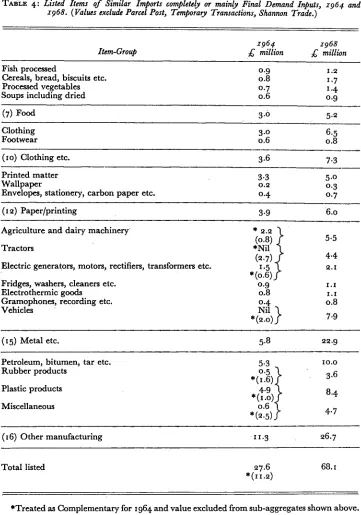
increased from £45"9 million for 1964 to £I IO.8 million for I968 i.e. by some £65 million with Table 4 having five selected sectors explaining about £4o million of this increase. The item-groups used for Table 4 are confined to permanent imports of goods wholly or mainly for Final Demand.
TABLE 4: Listed Items of Similar Imports completely or mainly Final Demand Inputs, x964 and x968. (Values exclude Parcel Post, Temporary Transactions, Shannon Trade.)
x964 x968 Item-Group £ million ;~ million
Fish processed o.9 1.2
Cereals, bread, biscuits etc. o.8 x.7 Processed vegetables o.7 1.4 Soups including dried o.6 o.9
(7) Food ~.0 5.2
Clothing 3.0 6.5
Footwear o.6 o.8
(Io) Clothing etc. 3.6 7.3
Printed matter 3.3 5.o
Wallpaper o.2 o.3
Envelopes, stationery, carbon paper etc. o.4 o.7
(x 2) Paper/printing 3.9 6.o
Agriculture and dairy machinery
(~) 5"5
Tractors *Nil ~.
Electric generators, motors, rectifiers, transformers etc. ~. 2.x *(o.6)f
Fridges, washers, cleaners etc. o.9 x.i
Electrothermlc goods o.8 I. x
Gramophones, recording etc. o.4 o.8
Vehicles Nil "~
*(2.o)f 7.9
(x5) Metal etc. 5.8 22.9
Petroleum, bitumen, tar etc. 5.3 o’5 Rubber products
* (1.6)
Plastic products 4.9 L
Miscellaneous
* (I.~O)
(
*(2.5)f
IO,O
3.6
8.4
4.7
(I6) Other manufacturing I 1,3 26.7
Total listed 07.6 68. I
*(ii.2)
IRISH INPUT-OUTPUT STRUCTURES 1964 AND 1968
The general impression obtained from the comparisons is indeed like that given by Table 3:1968 levels generally are higher, because of increases in matched items and extension of the list and there may be some inconsistent entries here and there, due to compilation problems.
Comparison ofz964 and z968 Complementary Import Allocations
Part 4 of Appendix 2 shows the allocations of the complementary imports for the two years under eleven descriptions, for five kinds of final demand and a summary column, as weU as summary columns for total inter-industry and the overall row aggregates. The total increased from £23o million for i964 to £273 million for I968, that is by £43 million which consisted of an increase of £49 million to inter-industry and a decrease of £6 million to final demand. A few comments on the comparisons for individual rows follow the obvious remark that the 1968 levels are reduced by the increased listing of items as similar, compared with I964.
The first row, for food, wines, raw tobacco is comparable for both years, the food being citrous fruits, grapes etc., raw sugar, tea, coffee and cocoa beans, hops, sago etc. The increase between i964 and I968 is mainly inter-industry. The second row has two item-groups for 1964 which were treated as similar imports for 1968, namely pulp and waste paper (£2"1 million) and synthetic fibres (£I "o million), exclusion of which makes £6.5 million for 1964 inter-industry versus £6.8 million for I968. Row (3) for non-metallic minerals is fairly comparable, with £3"6 million extra for 1968 inter-industry.
Bituminous coal, row (4), suggests inconsistent treatment in the I--O compilations for the two years, with inter-industry levels of £4"9 million for
1964 versus £o.6 million for 1968 and for the latter year some £3 million allocated to apparent surplus/deficit. There is no indication in the Census of Industrial Production how coal inputs to the industries should be subdivided between native anthracite, similar imports and bituminous coal (treated as complementary). A further problem arises in deciding how to subdivide "heating" inputs to service sectors between coal, peat, oil and electricity. There is a case to be made for treating all coal as a similar import and "forcing" coal into the services in sufficient amounts to leave just enough for known or firmly estimated inputs, the latter including households.
Row (5), petroleum, crude and refined, is consistently treated for the two years, the refined kinds being kerosene, tractor vaporising oil and aviation fuels. With the prospect of several new refineries there might be a case for
classifying all refined petroleum as a similar import.
Row (6), chemicals not elsewhere specified, is fairly comparable for I964 and 1968, the inter-industry part consisting of the basic organic and inorganic chemicals and diverse products unlike domestic items. Some £7 million increase is shown over the four years.
inter-industry part, after reduction by the £9.i million shown in Table 3 for i964 as being similar for i968, gives some £6 million for I964 comparable with £xo million for i968.
Row (8) treats machinery, both electrical and other. The final demand figure for both years is roughly £3o million but Table 4 suggests reduction of I964 level by some ~4 million for comparability. The inter-industry level of
£I8"5 million should be reduced by about £8.5 million to give £io million for I964 versus £27.5 million for i968 and accounts for parts and components for all kinds of machinery, other than vehicles.
Component parts of vehicles form the inter-industry share of row (9), which increased by £5"4 million between !964 and i968. The final demand section should include aircraft for both years but has some £2 million for 1964 relating to ships andland vehicles, treated as similar for1968. ¯ ,
Other visible imports, row (io), has a collection of items not :really com-parable for the two years, due to import re-classification. Final demand 1968 is £ 12 million below that of 1964 whereas inter-industry allocation shows £i 3 million extra for I968. There is little point in examining the details of the changes.
The big item of invisibles, row (I I), for final demand is the expenditure on travel abroad, being £26 million for i964 and £30 million for i968. The inter-industry i964 level of £9"7 million compares with £20.6 million for 1968, the growth being due to increased purchases by some productive sectors of goods and services not; entering the merchandise or visible Categories.
SECTION 4: CHANGES in INTER-INDUSTRY DIRECT INPUT COEFFICIENTS BETWEEN i964 and I968
Causes of Changes in Inter-Industry Coeficients
For a fixed listing of similar imports, or for all imports treated as primary inputs, the main causes of changes in the inter-industry major coefficients
based on reliable information (Census of Production) are the following:
(i) Changes in the levels of price relatives. Let a’ tj and a°,j be the direct input coefficient at Current prices for row i of column j in years I and o respectively, with the a ~j being the cost of an identical physical input of type i required to produce an identical physical output of type j, costing £i in year o. Also let p~ and pl be the price index for year I, based on unity for year o, of the domestic output sectors i andj respectively, each producing one homogeneous commodity. For this illustration the a ~j coefficient is taken as
containing only domestic output.
Then a1 ~ j = p la° ~ j/p j.
IRISH INPUT-OUTPUT STRUCTURES 1964 AND 1968
(2) Changes in product mix, whereby in smallish tables subsectors such as animal slaughter and flour milling are included in the food sector. A relatively fast growth of the meat sub-sector will cause a growth in the livestock input relative to the crops input.
(3) Substitution of similar imports for domestic inputs, to be largely avoided if both are included in a joint coefficient but still causing some price distortion unless there is a one-to-one value substitution.
(4) Technical change, due to substitutions such as those of oil or electricity for coal, synthetic fibres for wool or cotton and so on.
(5) Changes arising from economies (or dis-economies) of scale in the production process. One kind of such change is a reduction in the factor inputs relative to the material inputs, per unit of output. Another is a reduction in the fuel and electricity coefficients due to more efficient use of these items in newer processes on a larger scale.
(6) Changes in methods of agriculture such as increased use of fertilisers to produce non-proportional increases in output of crops.
(7) Changes due to industrial development within a fairly aggregate sector of a smallish table. Suppose that imports of some textile yarns (classified as similar imports of the textile sector) for use in weaving by the textile sector are replaced by raw cotton etc. (complementary imports) which is now spun within the country. It is clear that the aggregate textile sector now has com-plementary imports where there were none before.
(8) There are effects of varying weather conditions on fixed inputs to agricultural crops. Increased amounts of coal and oil are needed to produce a given output of electricity when drought reduces the output of hydro-electric power stations. Labour strikes affect production processes. Such disturbances of a stochastic nature will cause either variations in output for given inputs or variations in inputs for a specified output. To allow for such variations requires considerable detail in a number of sectors together with input structure for various levels of the factor causing the variations e.g. a separate sector for hydro-electricity with input structure for various degrees of annual rainfall. Fairly obviously, detail of this kind is in the province of specialised studies of sub-sectors of the economy for special purposes.
Some Solutions to the Problem of Changes in Coefficients
import coefficients at constant prices. Up to some reasonable limit the more detail (by commodity) in which the deflation is done, the better will be the results, as the commodity mix may vary considerably within a fairly aggregate row as one moves from sector to sector along the row.
With a sufficiently detailed table there are less problems of product mix, as each sector has a fairly homogeneous output. By changing the weighting pattern of sub-sectors within a sector such as food one could considerably improve the expected input structure of the food sector. This, of course, requires estimation of the weighting to bc given to the various sub-sectors.
After separate deflation to constant-price levels, the combined similar import plus domestic coefficient may be more stable than either of its com-ponents. This is especially true of the Irish economy which shows large inputs of similar imports, with these fairly readily available for substitution in conditions of failure of native grainl crops etc. The stability is lessened by lack of perfect substitution even at constant prices, if one is using values rather than
quantities, as is usual.
Technical change must be specifically allowed for, in predicting coefficients, as it is quite different from the substitution of similar imports for domestic items. It requires detailed study of past observed behaviour as well as possible consultation with technologists concerning future trends. Of relevance also is the level of detail of the structure to be projected. Coal, oil and electricity are likely to be part of three or more separate rows, even in fairly small tables (e.g. the Irish 33-sector table). Thus more oil for less coal will cause coefficient changes even at this level of aggregation. The substitution of synthetic fibres for wool and cotton, however, might occur within the textile sector, if that sector has a single aggregate row and column, and thus would be a similar import or even domestic substitution of newer products for older kinds, all within textiles.
Comparison of x964 and x968 Direct Input Coeffcients at Current Prices
The coefficients in question are of the 33-sector model, with i964 figures appearing in Table B2 Of [4], and 1968 figures given below in Part 2 of Appendix 3. For the first 16 rows the coefficients contain the similar imports as listed in the transactions tables in question and thus rows (15) and (i6), at least, have considerably extended lists of similar imports for 1968. All the other causes of change referred to above make differences between the two sets of figures, so that the area for valid comparison is rather limited.
o->
co o~
8
~4
F~
IRISH INPUT-OUTPUT STRUCTURES 1964 AND 1968
0~.~
~o
0 0
"o
o$
qq~o
0 0
t".- 0
0 0 0 0¯ . 0 0
0 0
~o
0 ~0 0
qq i
0 0 0 0
e~ 0~ o o
o
...o
o
~
o. o.0 0 0 0 0 0 0
lists. The last column of Table 5 has the mean value of the size of the change for some rows and for row aggregates.
The 304 matched coefficients havean average size of change o.oi 19, and the change increases with coefficient size, being 0.0043 on average for the 188 coefficients not exceeding 0.02 for 1964 and 0"0242 for the 116 coefficients exceeding 0.02 in 1964. These latter coefficients have 51 of the 55 changes exceeding 0.02 in size; and 21 of the 22 changes iexceeding 0.04. By contrast the 188 coefficients not exceeding 0"02 in size have 184 of the 249 changes at or below the 0.02 level and 155 of the 188 changes at or below the 0.007 level. The 12o unmatched coefficients, which have a change from zero identical with size, are relatively small, being on average 0.0067, with 109 not exceeding 0.02 and 88 at or below 0.007. The 29 of them which were non-zero for 1964 are much larger than those of 1968, with an average value o.o 125 and three of them exceeding 0"04, these latter three being textiles etc. input to hotels etc.,
metal etc. input to hotels etc. and artificial n.e.s, to domestic service/handi-crafts. The columns inquestion are among those having less reliable sources of information on inputs and consequent possible relatively large variation in input structure from one year to another. Only one coefficient of the unmatched set of 91 for 1968 exceeded 0.04. This is for input of transport to fishing and here also poor data on input structure is the explanation.
Thus for all 424 matched and unmatched coefficients there were 66 changes exceeding 0.02 and 26 changes exceeding 0.04, 22 of the latter arising from matched coefficients.
Row (I 5) has an average change 0.0217, about twice that for the full set of 424, and 7 of its 20 coefficients have changes exceeding 0.02. It has the largest change, 0"0999, for the input to artificial sectors n.e.s, and a further change of size 0"0904, for the input to repair construction. Both these changes are in the form of increases and at least partly due to extra import content via revised 1968 similar import list. Row (16) has an average change 0.oi 16 which is about the same as that for all 424 coefficients. There are 5 of its 29 changes in the range 0.02 to 0.07. The one change exceeding 0"04 is of magnitude 0.0513 and concerns input of petroleum fuels to fishing, for which column the un-reliable nature of the information on inputs has been mentioned above.
Thus rows (I5) and (I6) together account for ordy 12 of the 66 changes exceeding 0.02, 4 of the 26 changes exceeding 0"04 and 3 of the 9 changes exceeding 0"07. Since the effect of the changes in listings of similar imports can only be to increase these rows and correspondingly reduce the comple-mentary import row, as against that of 1964, none of the other 31 rows of coefficients, whose changes are under discussion, could be forced to have compensatory changes. Some further major possible causes of change will be examined below.
Comparison ofx964 and x968 Direct Input Goeffcients at x968 Prices
IRISH INPUT-OUTPUT STRUCTURES 1964 AND 1968
exceeding 0.02 in size, 1964, after recalculation of their 1964 values at estimated 1968 prices. Comparison of Table 6 with the corresponding section of Table 5 indicates what reduction in changes is effected by attempted elimination of changes in prices.
The process used to revalue the full set of 1964 coefficients at 1968 prices is described on pages 38-42 of [2]. Price indices for 1968 based on unity for 1964 were applied to each of the 16 rows of 1964 similar import direct input coeffi-cients, 24 rows of complementary import, 9 rows of indirect tax coefficients. Adjustments for price changes were also made to the remaining primary input rows of subsidies, wages etc., profits, depreciation coefficients. The aggregate change in total primary direct input coefficient, including similar imports, was then used with the inter-industry matrix of purely domestic coefficients to compute consistent price indices for the 33 columns of input. After all coefficients had been revalued at the new price levels, the similar imports were added back to rows I to 16. The price indices used were the best available--some came from Census of Industrial Production, some from comparison of unit prices for large items of imports and some were reasonable guesses.
The surprising result emerging from comparison of Tables 5 and 6 is that the average size of change at 1968 prices, 0"o245, is slightly larger than that at current prices, 0.0242. Thus no reduction in magnitude of change is effected by elimination of price changes. For the three largest coefficients (exceeding 0.3) the 1964 actual and repriced values were as follows: livestock to food 0"4233 and 0.4250, textiles to textiles 0.3495 and 0.3291, textiles to clothing etc. o.3137 and 0.2849. The first repricing reduced the change by a negligible amount and the latter two increased the change by 0.02 and 0.03 respectively. The conclusion may be drawn that with the available data on price changes the inflation or deflation of coefficients in order to improve comparability with those of another year looks unpromising and its theoretical improvement of structure of coefficients remains to be practically demonstrated.
Detailed analysis of large changes in some large direct input coeffcients, at current prices
For a small number of the large coefficients the following discussion illustrates changes caused by shifts in relative gross output weights of sub-sectors within sectors, by changes in technology, by severe price changes, by changes in the listing of similar imports, and by unreliable or inconsistent data on inputs. A listing by rows is used, with the position in the row (the input column) quoted. The coefficients which include similar imports are rounded to 3 decimal places and the 1964 value given first.
Row (x) Agricultural Livestock
0
o.~.
~o
o
0 0 ~t~ 0 0
~o
0 0
o.o.
0 0
go
0 0 0 0
.~,~ ~.~
~O 0 0 O0 0 O0 0 0 0
’0~, ~~O 0 0 ,t~
o... . g~
IRISH INPUT-OUTPUT STRUCTURES 1964 AND i968 31
For 1968 the input coefficient for cattle to dairying is 0.202 and for dairying milk and by-products to cattle the input coefficient is o.6o6. Corresponding 1964 coefficients, at 1964 prices, were o.164 and o.333. The huge increase in the second coefficient is due to apparently increased value of calves and cattle leaving the dairy herd, relative to sales of cattle. Thus, there is an apparent severe price inflation of the second coefficient between 1964 and 1968. The 1968 prices used for the numbers of cattle and calves involved in this coefficient may be excessive, or inconsistent with the prices used for 1964.
Column (7) Food, 0"423 and o.493: animal slaughter plus milk products (excluding chocolate etc.) as a proportion of gross output of food, increased from o.529 for 1964 to o.58o for 1968. Thus the livestock input coefficient has extra relative weighting for 1968: there is a change in product mix.
Column (9) Textiles (ex. hosiery) o.o96 and o.o5o: woollen and worsted decreased from o-5o9 of gross output for 1964 to o.441 for 1968. The input of wool, which forms the coefficient being considered, decreased from o.19o of woollen and worsted sub-sector for 1964 to o.I 12 for 1968. Thus both a change in relative weighting and an apparent switch from raw wool to either spun yarns or synthetic fibres is apparent.
Row (7) Food
Column (7) Food o.i7o and o.I2i: the inputs to animal feed decreased from o.48i for I964 to 0.225 for I968. This was compensated for by an input from crops increasing from o.34~ to 0.522. Thus there was a substitution of grain inputs for processed feeds in i968, the increase in grain inputs not showing for food as a whole, which grew in current gross output value by one-third. The decrease, however, is noticeable, being of some 0.26 multiplied by a relative weight of tenth, compared with a relative weight of one-seventh for 1964.
Row (x2) Paper and Printing
Column (12) Paper etc. 0"295 and 0.329: the weight of each of the two sub-sectors is about half the total for both years. For sub-sector paper, the input of paper and printing increased from o.29° for 1964 to o.391 for 1968. For sub-sector printing, a slight reduction, 0"299 to o’278, occurred. The input of complementary imports to sub-sector paper decreased from o.153 for 1964 to o.o26 for 1968, thus compensating for the increased domestic input. The redefinition of pulp and waste paper from being complementary for 1964 to being similar for 1968 (Table 3) gives an increase of 12 per cent in the similar import coefficient of sub-sector paper and a like decrease in the complementary coefficient. Thus the change is due to a change in definition of complementary imports.
Row (z3) Chemicals
explained by a reduction in the relative weight of fertiliser sub-sector from 0.405 to 0.355 combined with a reduction of the chemical input to fertilisers from 0.409 to 0.269; the complementary imports to the latter increased from o-x83 to o.3I3. This indicates a change in technology, with less importance of imported fertilisers for blending and more importance of crude imported chemicals and minerals.
Row ( z s ) Metal/Engineering/Vehicles
An artificial sub-sector includes all vehicle parts and tyres not used in new vehicle assembly, with retail garage margin added. This sector is very complex and expanded from £1o5"7 million gross output in 1964 to ~I52.7 million for 1968, both at current prices, i.e. by 45 per cent. Changes are, therefore, to be expected, through replacement of 1964 complementary imports by 1968 domestic products (and similar imports) and also by changes in relative weights of sub-sectors within sectors. One large change was as follows:
Column (18) Repair Construction, o.o84 and o.175. The sector almost doubled over the 4-year interval, with the metal etc., users such as plumbing, heating, electrical installation (classified as sub-sector of repair) roughly doubling and having certain 1964 complementary imports now listed as domestic plus similar imports. The complementary import coefficient decreased from 0’024 to o.ooi.
Row (z8) Repair Construction
Column (I7) New Construction, O.lO2 and 0.200: this change is due to increasing importance of plumbing, heating ’and electrical installation sub-contract work in erection of new houses and offices. The hire of sub-contractors’ plant has grown considerably since 1964. The inputs to column (I 7) and both inputs and outputs of sector (I8) involve considerable estimation and thus some of the apparent change might arise from inconsistent estimates.
Row (25) Medical Services, Private
IRISH INPUT-OUTPUT STRUCTURES 1964 AND 1968 33
CONCLUSIONS
The changes in the import listings and the set of z 20 unmatched transactions and derived coefficients go some way, but only part of the way, towards a full explanation of the changes in structure between z 964 and 1968. Allowance for distortion caused by changes in prices gave no improvement in general, but might improve structures more precisely comparable than those examined above. One important factor of change is the variation of gross outputs of sub-sectors as proportions of the sector aggregate gross output (total input). Another is technical change, examples of which appeared above for wool being replaced by textiles and processed feeds being replaced by grain. The final major source of change is inadequate information on inputs, which produces inconsistency through grossed-up results of small samples, and through revised
opinions on inputs, where not even sample results are available.
Table 5 showed that there were only 66 matched coefficients exceeding 0.05 for I964, which is only one-fifth of the full 304 matched set. Coefficient size is one measure of the importance of an entry in a tableof transactions, but a more valid measure is the size of the transaction itself. For i968, Part I of Appendix 3 shows 53 transactions exceeding £4"5 million each, yet these
account for £973 million which is 79 per cent of the total inter-industry transaction of £ 1,2 ~6 million and involving 395 transactions in all. It therefore follows that at the 33-sector level only two or three transactions per column (say ioo transactions in all) contain up to 9° per cent of the value of inter-industry transactions and it is these which merit the major part of the work of compilation.
The question of how to define similar imports remains open, any given list being to some extent subjective. If one is interested only in a particular year, then there is much to be said for keeping all imports as primary inputs. For planning exercises or model-building which is outside the scope of this essay, there is a strong case for including the similar imports with domestic trans-actions in the inter-industry part of the table. This treatment permits substitu-tion between similar imports and domestic products on the assumpsubstitu-tion of a -Jone-to-one value exchange and enables one to experiment with various patterns
of similar imports.
APPENDIX I.I: Primary Input Components of Final Demand x964, 33 All Imports treated as Primary Inputs, £ooo
Sectors, Producers’ Prices.
Net Changes
Type of Primary Personal Exports Govern- in Stocks Gross
Input Expen- and Re- ment and Fixed Total diture Exports Current Apparent Capital Final including except ~ Expon- Surplus/ Formation Demand
Tourism Tourism diture Deficit
Similar imports: via intermediate direct
Complementary imports:
via intermediate direct
Indirect taxes: via intermediate direct
Less subsidies: via intermediate direct
Wages/pensions etc. : via intermediate direct*
Profits:
via intermediate direct*
Depreciation: via intermediate direct
50,708 30,662 4,179 2,216 I4,994 xo2,759 34,I55 2,374 66 x,875 7,4io 45,880
59,I97 35,723 5,3to 1,588 °3,455 x25,273 5%oo2 9,836 --39x 4,232 34,184 Io4,863
35,736 14,188 3, I x5 215 4,65I 57,905 94,208 933 nil 752 300 96,I93 --9,39° --6,296 -- 164 --345 -- I I I-- 16,3o6 --13,1o6 --4,35x nil nil nil --17,457
2o6,29x 65,932 9%894 6,587 66,096 435,800 nil 7, 551 nil nil nil 7,55 t
169,995 88,926 IO,989 IO,761 I7,63I 298,302 nil 56,672 nil --IO,4oo nil 46#72
4%o39 I3,35o 1,7o2 919 5,49o 61,5oo nil nil 3,7oo nil nil 3,700
TOTAL 724,835 315,5oo x I9,4oo x8,4oo 174,10o 1,352,235 Summary:
Imports Indirect taxes Less subsidies Wages etc. Profits Depreciation
oo x,o6", 78,595 9,I64 9,911 80,043 378,775 I29,944 I5,I2x 3,115 967 4,951 154,o98 --22,496 --1o,647 --164 --345 --I I I --33,763 2o6,29I 73,483 90,894 6,587 66,096 443,351 I69,995 I45,598 IO,989 36x I7,63I 344,574 4o,o39 x3,35o 5,4°0 919 5,49o 65,2oo
TOTAL 724,835 315,500 I19,4oo I8,4OO I74,IOO 1,352,235 As Percentages of
Column Totals: Imports Indirect taxes Less subsidies Wages etc. Profits Depreciation
27-74 24.91 7.67 53.86 45.98 28.Ol I7-93 4.79 .2.61 5.26 2.84 11.4o --3-Io --3.37 --o.I4 --I.87 --o.o6 --2.5o 28.46 23.29 76.x3 35.8o 37.96 32.79 23.45 46.I5 9.2o 1.96 IO.13 25.48 5.52 4.23 4.52 4.99 3.15 4.82
TOTAL I OO .OO I OO .OO I OO .O0 I OO .OO I OO .OO I OO .OO
IRISH INPUT-OUTPUT STRUCTURES 1964 AND 1968 35
APPENDIX 1.2: Primary Input Components of Final Demand x968, 33 Sectors, Producers’ Prices. All Imports treated as Primary Inputs. £,ooo
Net Changes
Type of Primary Personal Exports Govern- in Stocks Gross
Input Expen- and Re- ment and Fixed Total diture Exports Current Apparent Capital Final including except Expen- Surplus] Formation Demand
Tourism Tourism diture Deficit Similar imports:
via intermediate 78,333 6x,x37 9,911 I,Io6 34,o53 i84,54o direct 64,942 9,882 nil 6,4oi 29,589 I Io,8I4 Complementary
imports:
via intermediate 66,ooi 77,539 5,993 813 24,o74 174,42o direct 48,56I 2,282 1,3oi i5,379 31,38i 98,9o4 Indirect taxes:
via intermediate 58,326 19,486 3,731 -- 76 6,212 87,679 direct I41,637 1,33o nil x,282 5,492 149,74I Less subsidies:
via intermediate -- I7,876 --I4,499 --371 --889 --353 --33,988 direct -- 13,26o -- 12,262 nil nil nil --25,522 Wages/pensions etc. :
via intermediate 274,856 I23,457 I23,IO6 I,I48 93,o82 615,649 direct* nil 1%519 nil nil nil I o,519 Profits:
via intermediate 2o8,515 I22,8o7 I7,325 6,524 21,922 377,093 direct* nil 75,349 nil -- I6,333 nil 59,oI6 Depreciation:
via intermediate 53,441 21,564 2,334 1,32I 6,946 85,6o6 direct nil nil 5,5oo nil nil 5,5oo TOTAL 963,476 498,591 I68,830 16,676 252,398 1,899,97I
Summary:
Imports 257,837 15o,84o I7,2o5 23,699 I I9,O97 568,678 Indirect taxes I99,963 2%816 3,731 i,uo6 II,7o4 237,42o Less subsidies --3I,I36 --26,76I --371 --889 --353 --59,5Io Wages etc. 274,856 I33,976 123,Io6 I,I48 93,082 626,I68 Profits 2o8,515 I98,I56 17,325 --9,809 21,922 436,io9 Depreciation 53,44I 21,564 7,834 1,32I 6,946 9I,IO6
TOTAL 963,476 498,591 I68,830 I6,676 25~,398 1,899,97I
As Percentages of Column Totals:
Imports 26.76 30.25 Io.I9 I42.I I 47.I9 29.93 Indirect taxes 2o.75 4.18 2.2I 7.23 4.64 I2.5o Less subsidies --3.23 --5.37 --0.22 --5.33 --o.I4 --3.I3 Wages etc. 28.53 26.87 72.92 6.88 36.88 32.96 Profits 21.64 39.74 Io.26 --58.82 8.69 22.95 Depreciation 5.55 4.32 4.64 7.92 2.75 4.8o
TOTAL IOO.00 IOO.OO IOO.00 IOO.OO 1OO.OO IO0.00