Detecting and Characterizing Events
Allison J. B. Chaney Princeton University [email protected]
Hanna Wallach Microsoft Research [email protected]
Matthew Connelly Columbia University [email protected]
David M. Blei Columbia University [email protected]
Abstract
Significant events are characterized by interac-tions between entities (such as countries, or-ganizations, or individuals) that deviate from typical interaction patterns. Analysts, includ-ing historians, political scientists, and journal-ists, commonly read large quantities of text to construct an accurate picture of when and where an event happened, who was involved, and in what ways. In this paper, we present theCapsulemodel for analyzing documents to detect and characterize events of potential significance. Specifically, we develop a model based on topic modeling that distinguishes be-tween topics that describe “business as usual” and topics that deviate from these patterns. To demonstrate this model, we analyze a corpus of over two million U.S. State Department cables from the 1970s. We provide an open-source im-plementation of an inference algorithm for the model and a pipeline for exploring its results.
1 Introduction
Foreign embassies of the United States government communicate with one another and with the U.S. State Department through diplomatic cables. The National Archive collects these cables in a corpus, which traces the (declassified) diplomatic history of the United States.1 The corpus contains, for example,
over two million cables sent between 1973 and 1978. Most of these cables describe diplomatic “business as usual,” such as arrangements for visiting officials,
1The National Archives’ corpus also includes messages sent by diplomatic pouch; however, for brevity, and at the risk of being imprecise, we also refer to these messages as “cables.”
recovery of lost or stolen passports, or obtaining lists of names for meetings and conferences. For example, the embassies sent 8,635 cables during the week of April 21, 1975. Here is one, selected at random:
Hoffman, UNESCO Secretariat, requested info from PermDel concerning an official in-vitation from the USG RE subject meeting scheduled 10–13 JUNE 1975, Madison, Wis-consin. Would appreciate info RE status of action to be taken in order to inform Secre-tariat. Hoffman communicating with Dr. John P. Klus RE list of persons to be invited.
But, hidden in the corpus are also cables about im-portant diplomatic events—the cables and events that are most interesting to historians, political scientists, and journalists. For example, during that same week, the U.S. was in the last moments of the Vietnam War and, on April 30, 1975, lost its hold on Saigon. This marked the end of the war and induced a mass exodus of refugees. Here is one cable about this event:
GOA program to move Vietnamese Refugees to Australia is making little progress and probably will not cover more than 100-200 persons. Press comment on smallness of program has recognized difficulty of getting Vietnamese out of Saigon, but “Canberra Times” Apr 25 sharply critical of government’s performance. [...] Labor government clearly hopes whole matter will somehow disappear.
Our goal in this paper is to develop a tool to help historians, political scientists, and journalists wade
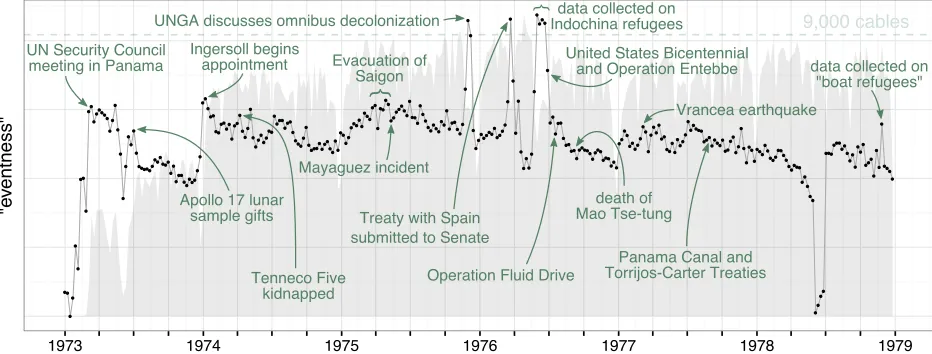
Figure 1:Capsule’s analysis (described in detail insection 5) of two million cables from the National Archives’ corpus. They-axis represents a loose measure of “eventness” (equation (5)). The gray background depicts the number of cables sent over time.
through corpora of documents to find potentially sig-nificant events and the primary sources around them. We presentCapsule, a probabilistic model for detect-ing and characterizdetect-ing important events, such as the fall of Saigon, in large corpora of historical commu-nication, such as diplomatic cables from the 1970s.
Figure 1illustrates Capsule’s analysis of two mil-lion cables from the National Archives’ corpus. The
y-axis represents “eventness,” a loose measure of
how strongly a week’s cables deviate from typical diplomatic “business as usual” to discuss some mat-ter that is common to many embassies. (We describe this measure of “eventness” in detail insection 3.)
This figure shows that Capsule detects many well-known events between 1973 and 1978, including the fall of Saigon (April 30, 1975) and the death of Mao Tse-tung (September 9, 1976). Capsule also uncovers obscure, but significant, events that have largely es-caped the attention of scholars, such as when the U.S. defended its control of the Panama Canal before the United Nations Security Council (March 19, 1973). Capsule therefore provides a new way to detect and characterize historical moments that may be of inter-est to historians, political scientists, and journalists.
The intuition behind Capsule is this: Embassies write cables throughout the year, usually describing typical diplomatic business, such as visits from gov-ernment officials. Sometimes, however, important events occur, such as the fall of Saigon, that pull em-bassies away from their typical activities and lead them to write cables that discuss these events and
their consequences. Capsule therefore operational-izes an “event” as a moment in history when multiple embassies deviate from their usual topics of discus-sion and each embassy deviates in a similar way.
Capsule embeds this intuition into a Bayesian model that uses latent variables to encode what “busi-ness as usual” means for each embassy, to character-ize the events of each week, and to identify the cables that discuss those events. Given a corpus of cables, the corresponding posterior distribution of the latent variables provides a filter for the cables that isolates important moments in diplomatic history. Figure 1
depicts the mean of this posterior distribution. We present the Capsule model insection 3, provid-ing both a formal model specification and guidance on how to use the model to detect and characterize real-world events. Insection 4, we validate Capsule using simulated data, and insection 5, we use it to analyze over two million U.S. State Department ca-bles. Although we describe Capsule in the context of diplomatic cables, it is suitable for exploring any corpus with the same underlying structure: text (or other discrete multivariate data) generated over time by known entities. This includes email, consumer behavior, social media posts, and opinion articles.
2 Related Work
We first review previous work on automatic event detection and other related concepts, to contextualize our approach in general and Capsule in particular.
ana-lysts often want to predict whether or not rare events will occur (Weiss and Hirsh, 1998;Das et al., 2008). In contrast, Capsule is intended to help analysts ex-plore and understand their data; our goal is human interpretability rather than prediction or forecasting. Events can be construed as either anomalies— temporary deviations from usual behavior—or “changepoints” that mark persistent shifts in usual behavior (Guralnik and Srivastava, 1999;Adams and MacKay, 2007). We focus on events as anomalies.
Event detection in the context of news arti-cles (Zhao et al., 2012; Zhao et al., 2007; Zhang et al., 2002;Li et al., 2005;Wang et al., 2007;Allan et al., 1998) and social media posts (Atefeh and Khre-ich, 2015;VanDam, 2012;Lau et al., 2012;Jackoway et al., 2011;Sakaki et al., 2010; Reuter and Cimi-ano, 2012;Becker et al., 2010;Sayyadi et al., 2009) usually means identifying clusters of documents. For news, the goal is to create new clusters as novel sto-ries appear; each article is assumed to be associated with one event, which does not allow for distinctions between typical content and rare events. For social media, the goal is to identify rare events, but the re-sultant methods are intended for short documents, and are not appropriate for longer documents that may contain information about a variety of subjects. Many existing methods for detecting events from text focus on individual vocabulary terms, often weighted by tf-idf values (Fung et al., 2005;Kumaran and Allan, 2004;Brants et al., 2003;Das Sarma et al., 2011;Zhao et al., 2007;Zhao et al., 2012). We characterize events by bursts in groups of terms.
Although groups of terms can be summarized di-rectly (Peng et al., 2007; Chakrabarti and Punera, 2011; Gao et al., 2012), topic models (Blei, 2012) provide a way to automatically identify groups of related terms and reduce the dimensionality of text data. Researchers have previously used topic models to detect events mentioned in social media posts (Lau et al., 2012;Dou et al., 2012) and to find posts rele-vant to particular, monitored events (VanDam, 2012). Capsule uses topics to characterize both typical diplo-matic content and potentially significant events.
In addition to modeling text over time, researchers have also used spatial information (Neill et al., 2005;
Mathioudakis et al., 2010;Liu et al., 2011) and infor-mation about authors (Zhao et al., 2007) and news outlets (Wang et al., 2007) to enhance event
detec-Figure 2:Cartoon intuition. They-axis represents the stacked proportions of cables about various topics, while thex-axis represents time. The Bangkok embassy, Hong Kong embassy, and U.S. State Department all have typical diplomatic business, about which they usually send cables. When an event occurs during time intervalt, the cables alter to cover the event before returning to “business as usual.” Capsule discovers the entities’ typical concerns, as well as the timing and content of events.
tion. We rely on author information to characterize diplomatic “business as usual” for each embassy.
Event detection is closely related to detecting and characterizing relationships between entities (Schein et al., 2015;Linderman and Adams, 2014;Das Sarma et al., 2011). Capsule can trivially use sender– receiver pairs instead of authors, and the model spec-ification can be tailored to reflect network structure.
Finally, there are connections between Capsule and recent work on Poisson processes. In particular, we can interpret Capsule as a collection of related discrete-time Poisson processes with random inten-sity measures. Further, marginalizing out the event strengths (described insection 3.1) reveals that the use of a vocabulary term by one embassy can “excite” the use of that term by another. This suggests a close relationship to Hawkes processes (Hawkes, 1971).
3 The Capsule Model
In this section, we present the Capsule model for detecting and characterizing significant diplomatic events. We first provide the intuition behind Capsule, and then formally specify the model. We also explain how to use Capsule to explore a corpus and how to learn the posterior distribution of the latent variables.
[image:3.612.315.540.66.218.2]illustrated infigure 2. We can imagine that this en-tity sends a stream of diplomatic cables over time— some to the U.S. State Department, others to other American embassies, such as the one in Hong Kong. Embassies usually write cables that describe typical diplomatic business. For example, the Bangkok em-bassy might write about topics regarding southeast Asia more generally. We can think of a topic as being a probability distribution over vocabulary terms.
Now imagine that an event, such as the capture of Saigon during the Vietnam War, occurs during a particular time intervalt. We cannot directly
serve the occurrence of this event, but we can ob-serve the stream of cables and the event’s impact on it. When the event occurs, multiple entities deviate from their usual topics of discussion simultaneously, before returning to their usual behavior, as depicted infigure 2. For example, the day after the capture of Saigon, the majority of the diplomatic cables written by the Bangkok embassy and several other entities were about Vietnam War refugees. If we think of the event as another probability distribution over vocabu-lary terms, then each entity’s stream of cables reflects its typical concerns, as well as any significant events.
3.1 Model Specification
We now define the Capsule model. Our data come fromentities (e.g., embassies) who sendmessages (e.g., diplomatic cables) overtime; specifically, we observe the number of timesndvthat each vocabulary
term v occurs in each message d. Each message
is associated with an author entity ad and a time
intervaltd within which that message was sent.
We model each message with a bank of Poisson distributions2—one for each vocabulary term:
ndv Poisson.dv/ : (1)
The ratedvblends the different influences on
mes-sage content. Specifically, it blends three types of topics, intended to capture “business-as-usual” dis-cussion and content related to significant events.
We operationalize each topic as a specialized prob-ability distribution over vocabulary terms (the set of unique words in the corpus of messages), as is com-mon in topic models (Blei et al., 2003;Canny, 2004;
2Readers familiar with topic modeling may expect a multino-mial model of term occurrences, but Poisson models of counts better capture messages with different lengths (Canny, 2004).
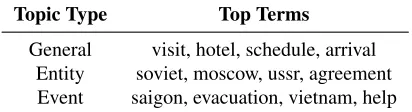
Topic Type Top Terms
[image:4.612.324.530.60.116.2]General visit, hotel, schedule, arrival Entity soviet, moscow, ussr, agreement Event saigon, evacuation, vietnam, help Table 1:The highest-probability vocabulary terms for examples of the three types of topics (general, entity, and event). These examples come from the analysis that we describesection 5.
Gopalan et al., 2014)—i.e., each term is associated with each topic, but with a different probability.
Each message blends 1) general topicsˇ1; : : : ;ˇK
about diplomacy (e.g., terms about diplomats, terms about communication), 2) an entity topicad specific
to the author of that message (e.g., terms about Hong Kong),3and 3) event topics
1; : : : ;T that are
spe-cific to the events in recent time intervals (e.g., terms about a coup, terms about the death of a dignitary).
Examples of these three types of topics are in ta-ble 1. The general topic relates to planning travel, the entity topic captures words related to the U.S.S.R., and the event topic captures words related to the evac-uation of Saigon toward the end of the Vietnam War. The messages share the three types of topics in different ways: all messages share the general topics, messages written by a single entity share an entity topic, and messages in the same time interval use the event topics in similar ways. Each message blends its corresponding topics with a set of message-specific strengths. As a result, each message captures a dif-ferent mix of general diplomacy discussion, entity-specific terms, and recent events. Specifically, the Poisson rate for vocabulary termvin messaged is
dv D
K
X
kD1
d kˇkvCdadvC
T
X
tD1
f .td; t / dtt v; (2)
whered k is messaged’s strength for general topic k, d is messaged’s strength forad’s entity topic,
anddtis messaged’s strength for event topict. The
functionf ./ensures that the events influences
de-cay over time. As we describe inappendix B, we
Figure 3: Graphical model for Capsule. Observed term counts depend on general topics ˇ1; : : : ;ˇK, entity topics
1; : : : ;A, and event topics1; : : : ;T, as well as
message-specific strengthsd,d, andd. Variables1; : : : ;Aand
1; : : : ; Arepresent entity-specific strengths, while 1; : : : ; T
allow time intervals to be more or less “eventful.” Black squares denote hyperparameters (unlabeled for visual simplicity).
compared several different decay functions (exponen-tial, linear, and step) and found that the following exponential decay function works well in practice:
f .td; t /D
(
0 t td < tC
exp .td t /
= 5
otherwise. (3)
Dividing by five means that we can interpret it as
the number of time intervals after which an event will have little impact on the content of the messages.
We place hierarchical gamma priors over the message-specific strengths, introducing entity-specific strengths1; : : : ;Aand1; : : : ; Athat
al-low different entities to focus on different topics and event strengths 1; : : : ; T that allow different time
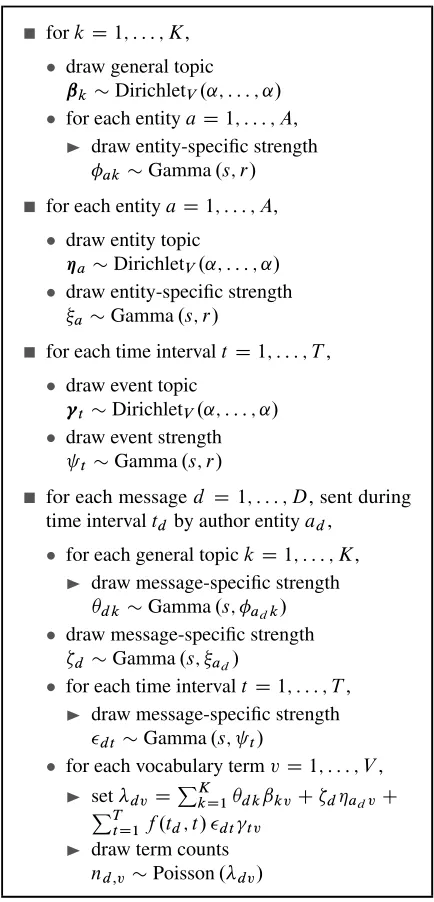
intervals to be more or less “eventful.” We place Dirichlet priors over the topics. The graphical model is infigure 3and the generative process is infigure 4.
Given a corpus of messages, learning the poste-rior distribution of the latent variables uncovers the three types of topics, the message- and entity-specific strengths, and the event strengths. Insection 3.3, we explain how an analyst can use the event strengths as a filter that isolates potentially significant messages.
3.2 Learning the Posterior Distribution
In order to use Capsule to to explore a corpus of mes-sages, we must first learn the posterior distribution of
forkD1; : : : ; K,
draw general topic
ˇkDirichletV.˛; : : : ; ˛/
for each entityaD1; : : : ; A,
I draw entity-specific strength
akGamma.s; r/
for each entityaD1; : : : ; A,
draw entity topic
aDirichletV.˛; : : : ; ˛/
draw entity-specific strength
aGamma.s; r/
for each time intervalt D1; : : : ; T,
draw event topic
tDirichletV.˛; : : : ; ˛/
draw event strength
tGamma.s; r/
for each messaged D 1; : : : ; D, sent during
time intervaltdby author entityad,
for each general topickD1; : : : ; K,
I draw message-specific strength
d kGamma.s; adk/ draw message-specific strength
d Gamma.s; ad/
for each time intervalt D1; : : : ; T,
I draw message-specific strength
dt Gamma.s; t/
for each vocabulary termvD1; : : : ; V,
I setdvDPKkD1d kˇkvCdadvC PT
tD1f .td; t / dtt v
I draw term counts
nd;vPoisson.dv/
Figure 4:Generative process for Capsule. We usesandrto denote top-level (i.e., fixed) shape and rate hyperparameters; they can be set to different values for different variables.
the latent variables—the general topics, the entity top-ics, the event toptop-ics, the message- and entity-specific strengths, and the event strengths—conditioned on the observed term counts. As for many Bayesian models, this posterior distribution is not tractable to compute; approximating it is therefore our central sta-tistical and computational problem. We introduce an approximate inference algorithm for Capsule, based on variational methods (Jordan et al., 1999),4, which
[image:5.612.318.535.55.506.2]we outline inappendix A.5This algorithm produces
a fitted variational distribution which be can then be used as a proxy for the true posterior distribution.
3.3 Detecting and Characterizing Events
We can use the mean of the fitted variational dis-tribution to explore the data. Specifically, we can explore “business-as-usual” content using the poste-rior expected values of the general topicsˇ1; : : : ;ˇK
and the entity topics1; : : : ;A, and we can detect
and characterize events using the posterior expected values of the event strengths and the event topics.
To detect events, we define an measure that quanti-fies the “eventness” of time intervalt. Specifically,
we first compute how relevant each message d is
to that time interval: mdt Df .td; t /EŒdt. Using
these relevancy values, we then compute the propor-tion of each message’s term counts that are associated with the event topic specific to time intervalt:
pdt D
mdt
P
kEŒd kCEŒdCPt0mdt0
: (4)
Finally, we aggregate these values over messages:
1
P
df .td; t / D
X
dD1
pdt; (5)
where the multiplicative fraction ensures that mes-sages that were sent during time intervals that are further fromt contribute less than than messages that
were sent during time intervals that are closer tot.
We can characterize an event t by selecting the
highest-probability vocabulary terms from EŒt.
By ordering the messages according to mdt D f .td; t /EŒdt, we can also identify the messages
that are most strongly associated with eventt.
Insection 5, we explore the cables associated with significant events in the National Archives’ corpus of diplomatic cables. To make Capsule more accessible for historians, political scientists, and journalists, we have released an open-source tool for visualizing its results.6 This tool allows analysts to browse a
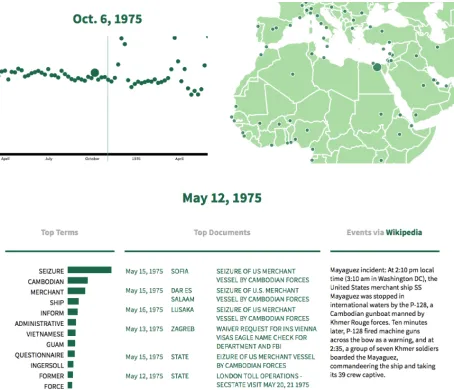
cor-pus of messages and the mean of the corresponding posterior distribution, including general topics, entity topics, and event topics. Figure 5contains several screenshots of the tool’s browsing interface.
5Appendices are in the supplemental material.
[image:6.612.313.540.57.252.2]6Source code: https://github.com/ajbc/capsule-viz; demo:http://www.princeton.edu/~achaney/capsule/.
Figure 5: Screenshots of the Capsule visualization tool used to explore U.S. State Department cables. Top left: events over time (similar tofigure 1). Top right: entities located on a map. Bottom: summary of the week of May 12, 1975, including top vocabulary terms, relevant cables, and text from Wikipedia.
4 Model Validation with Simulated Data Before using Capsule to explore a corpus of real messages (described insection 5), we provide a quan-titative validation of the model using simulated data. We used the generative process infigure 4to create ten data sets, each with 100 time intervals, ten general topics, ten entities, and roughly 20,000 messages. We then used these data sets to compare Capsule’s event detection performance to that of four baseline methods. We also compared the methods’ abilities to identify the most relevant messages for each event.
4.1 Detecting Events
For each data set, we ordered the time intervals from most to least eventful, using the “eventness” measure described insection 3.3and the simulated values of the latent variables. We then treated these ranked lists of time intervals as “ground truth” and assessed how well each method was able to recover them.
For Capsule itself, we used our approximate infer-ence algorithm to obtain a fitted variational distribu-tion for each simulated data set. We then ordered the time intervals using our “eventness” measure and the posterior expected values of the latent variables.
second terms inequation (2). We used this baseline to test whether modeling “business as usual” discussion makes it easier to detect significant events. We ob-tained a fitted variational distribution for this model using a variant of our approximate inference algo-rithm, and then ordered the time intervals using our “eventness” measure, modified appropriately, and the
posterior expected values of the latent variables. For our second baseline, we drew inspiration from previous work on event detection in the context of news articles, and focused on each time interval’s deviation in term counts from the average. Specifi-cally, we ordered the time intervals1; : : : ; T for each
simulated data set according to this measure:
V
X
vD1 D
X
dD1 tdDt ˇ ˇ ˇ ˇ ˇ
ndv 1 D
D
X
dD1 ndv
ˇ ˇ ˇ ˇ ˇ
: (6)
We added tf-idf term weights for our third baseline:
V
X
vD1
tf-idf.v/ D
X
dD1 tdDt
ˇ ˇ ˇ ˇ ˇ
ndv 1 D
D
X
dD1 ndv
ˇ ˇ ˇ ˇ ˇ
: (7)
Finally, we randomly ordered the time intervals for each data set to serve as a straw-man baseline.
We also experimented with baselines that involved term-count deviations on the entity level and topic-usage deviations on the message level (Dou et al., 2012), but found that they were not competitive.
For each data set, we compared each method’s ranked list of time intervals to the corresponding “ground-truth” list of time intervals, by dividing the sum of the lists’ actual set overlap at each rank by the sum of their maximum set overlap at each rank:
PT
rD1jSrtruth\Srmethodj
PT
rD1r
; (8)
whereSrtruthis a set of the toprtime intervals
accord-ing to the “ground-truth” list andSrmethodis a set of
[image:7.612.313.541.56.161.2]the toprtime intervals according to the method.
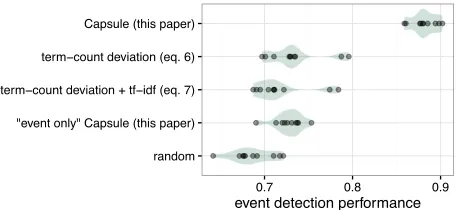
Figure 6shows that Capsule outperforms all four baseline methods. These results serve as a sanity check for both the model and its implementation.
4.2 Identifying Relevant Messages
For each data set, we created a list of the most rele-vant messages for each time intervaltby computing
Figure 6:Event detection performance using ten simulated data sets. Each dot represents the performance (equation (8); higher is better) of a single method on a single data set; each shaded green area summarizes the distribution of performance for a single method. Capsule outperforms all four baseline methods.
f .td; t / dtfor each messaged (using the simulated
values ofdt) and ordering the messages accordingly.
We then treated these ranked lists of messages as “ground truth” and assessed how well Capsule and
the baseline methods were able to recover them. For Capsule, we used our approximate inference algorithm to obtain a fitted variational distribution for each data set, and then, for each time interval, ordered the messages according tomdt D f .td; t /EŒdt.
For our second and third baselines, we ordered the messages sent during each time interval according message-specific versions ofequations (6)and(7).
For each data set, we compared each method’s ranked list of messages for each time interval to the corresponding “ground-truth” list, by computing pre-cision at ten messages. The average prepre-cision for Capsule was was 0.44, while the average precision for the “event-only” version of the model was 0.09. The other baselines recovered zero relevant messages.
5 Exploratory Analysis
Capsule is intended to help analysts explore and un-derstand their data. In this section, we demonstrate its capabilities by analyzing a corpus of over two mil-lion U.S. State Department cables from the 1970s.
5.1 Data
Univer-sity;7the subset contains cables sent between 1973
and 1978. In addition to the text of the cables, each message is labeled with its author (e.g., the U.S. State Department, a particular embassy, or an individual), the date the cable was sent, and other metadata. We used a vocabulary of 6,293 terms and omitted cables with fewer than three terms, resulting in 2,021,852 cables sent by 22,961 entities. We used weekly time intervals, as few cables were sent on weekends.
5.2 Model Settings
We ran our approximate inference algorithm for Cap-sule to obtain a fitted variational distribution. We usedK D100general topics, the exponential decay
function inequation (3)with D 4, and top-level
hyperparameterssDrD0:3. With these settings, a
single iteration of the algorithm took about an hour.8
5.3 Detecting Well-Known Events
To evaluate Capsule’s ability to detect well-known events, we used a list, provided to us by the History Lab, of thirty-nine well-known events that took place between 1973 and 1978. Each event is present in at least one of six reputable collections of historic events, such as the Office of the Historian’s Mile-stones in the History of U.S. Foreign Relations.9 We
treated this list of events as “ground truth” and as-sessed how well Capsule and each of the baselines de-scribed insection 4.1were able to recover them—or, in other words, how well the methods identify these eventful weeks, compared to more typical weeks.
Specifically, we used each method to construct a ranked list of time intervals. Then, for each method, we computed the discounted cumulative gain (DCG), which, in this context, is equivalent to computing
39
X
eD1
1
log rank e; LmethodT ; (9)
where LmethodT is the method’s ranked list of time
intervals and rank e; LmethodT is the rank of theeth
well-known event in LmethodT . Finally, we divided
the DCG by the ideal DCG—i.e.,P39
eD1log1.e/—to
7http://history-lab.org
8Each iteration of our algorithm considers all messages. Mod-ifying it to stochastically sample the data would reduce the time required to obtain an equivalent fitted variational distribution.
9https://history.state.gov/milestones/1969-1976
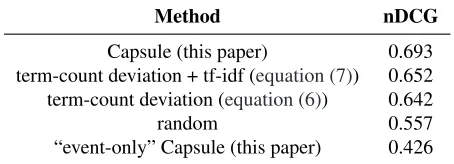
Method nDCG
Capsule (this paper) 0.693 term-count deviation + tf-idf (equation (7)) 0.652 term-count deviation (equation (6)) 0.642
random 0.557
[image:8.612.313.540.59.141.2]“event-only” Capsule (this paper) 0.426 Table 2:Event detection performance (nDCG; higher is better) using thirty-nine well-known events that took place between 1973 and 1978. Capsule outperforms all four baseline methods.
obtain the normalized DCG (nDCG).Table 2shows that Capsule outperforms all four baseline methods.
5.4 Exploration
We now turn to our primary goal—using Capsule to explore and understand a corpus of messages. Fig-ure 1shows our “eventness” measure (equation (5)) over time. One of the tallest peaks occurs during the week of December 1, 1975, when the United Nations General Assembly discussed omnibus decolonization. As described insection 3.3, we can characterize this event by computingmdt Df .td; t /EŒdtfor each
messaged and then ordering the messages
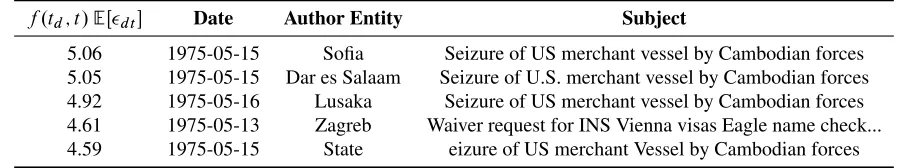
accord-ingly.Table 3lists the highest-ranked messages. Another notable event was the seizure of the S.S. Mayaguez, an American merchant vessel, during May, 1975, at the end of the Vietnam War. Table 4
lists the highest-ranked messages for this event. We can examine these messages to confirm their rele-vancy and learn more about the event. For example, here is the content of the most relevant message:
In absence of MFA Chief of Eighth Depart-ment Avramov, I informed American desk officer Yankov of circumstances surround-ing seizure and recovery of merchant ship Mayaguez and its crew. Yankov promised to inform the Foreign Minister of US statement today (May 15). Batjer
f .td; t /EŒdt Date Author Entity Subject
[image:9.612.74.534.59.141.2]4.60 1975-12-05 Canberra 30th UNGA: Item 23, Guam, Obmibus Decolonization and ... 4.26 1975-12-05 Mexico 30th UNGA-Item 23: Guam, Omnibus Decolonization and ... 4.21 1975-12-06 State 30th UNGA-Item 23: Guam, Omnibus Decolonization and ... 4.11 1975-12-03 Dakar 30th UNGA: Resolutions on American Samoa, Guam and ... 4.08 1975-12-04 Monrovia 30th UNGA: Item 23: Resolutions on decolonization and A... Table 3:Highest-ranked messages for the week of December 1, 1975, when the United Nations General Assembly discussed decolonization. Capsule accurately recovers messages related to this real-world event. Typos are intentionally copied from the data.
f .td; t /EŒdt Date Author Entity Subject
5.06 1975-05-15 Sofia Seizure of US merchant vessel by Cambodian forces 5.05 1975-05-15 Dar es Salaam Seizure of U.S. merchant vessel by Cambodian forces 4.92 1975-05-16 Lusaka Seizure of US merchant vessel by Cambodian forces 4.61 1975-05-13 Zagreb Waiver request for INS Vienna visas Eagle name check... 4.59 1975-05-15 State eizure of US merchant Vessel by Cambodian forces Table 4:Highest-ranked messages for the week of May 12, 1975, when the S.S. Mayaguez, an American merchant vessel, was captured. Capsule accurately recovers messages related to this real-world event. Typos are intentionally copied from the data.
after the event took place; the most relevant mes-sages are listed inappendix B(table 5). The cable from Stockholm describing the “Ugandan role in Air France hijacking” begins with the following content, which reveals further information about this event:
1. We provided MFA Director of Political Affairs Leifland with Evidence of Ugandan as-sistance to hijackers contained in Ref A. After reading material, Leifland described it a “quite good”, and said it would be helpful for meet-ing MFA has scheduled for early this mornmeet-ing to determine position GOS will take at July 8 UNSC consideration of Israeli Rescue Opera-tion. ...
In addition to detecting and characterizing well-known events, such the S.S. Mayaguez incident and Operation Entebbe, Capsule can detect and character-ize obscure, but significant, events, such as when Er-itrean rebels kidnapped Tenneco oil employees (April 8, 1974) and when the U.S. Navy evacuated citizens from Lebanon (“Operation Fluid Drive,” June 20, 1976). Both events appear infigure 1. Capsule uncov-ers events where analysts might not otherwise look.
Capsule also provides a way to explore
“business-time interval. This example is a clear violation of this assump-tion, but also serves to demonstrate that Capsule can successfully detect and characterize multiple events, even when they overlap.
as-usual” discussion using the posterior expected val-ues of the general topicsˇ1; : : : ;ˇK and the entity
topics1; : : : ;A. Examples of each of these types
of topics are inappendix B(tables 6and7, respec-tively); these examples illustrate that, as desired, the entity topics absorb location-specific terms, prevent-ing them from overwhelmprevent-ing the general topics. 6 Conclusion
We presented Capsule, a Bayesian model for detect-ing and characterizdetect-ing potentially significant events. We evaluated Capsule’s ability to detect events and identify relevant messages; it outperformed four base-line methods. We used Capsule to analyze a large cor-pus of U.S. State Department cables from the 1970s, demonstrating that it can discover both well-known and obscure (but significant) events, as well as rele-vant documents. We anticipate that Capsule, and our visualization tool, will be useful for historians, po-litical scientists, and journalists who wish to explore and understand large corpora of documents. This is increasingly important—the U.S. State Department alone produces around two billion e-mails annually.
Acknowledgments
[image:9.612.79.534.180.264.2]References
Ryan Prescott Adams and David JC MacKay. 2007. Bayesian online changepoint detection.arXiv preprint arXiv:0710.3742.
James Allan, Ron Papka, and Victor Lavrenko. 1998. On-line new event detection and tracking. In Proceed-ings of the ACM SIGIR Conference on Research and Development in Information Retrieval, pages 37–45. Farzindar Atefeh and Wael Khreich. 2015. A survey
of techniques for event detection in twitter. Computa-tional Intelligence, 31(1):132–164.
Hila Becker, Mor Naaman, and Luis Gravano. 2010. Learning similarity metrics for event identification in social media. InProceedings of the ACM International Conference on Web Search and Data Mining (WSDM), pages 291–300.
D. Blei, A. Ng, and M. Jordan. 2003. Latent Dirichlet allocation. The Journal of Machine Learning Research, 3:993–1022, January.
David M Blei. 2012. Probabilistic topic models. Commu-nications of the ACM, 55(4):77–84.
Thorsten Brants, Francine Chen, and Ayman Farahat. 2003. A system for new event detection. In Proceed-ings of the ACM SIGIR Conference on Research and Development in Information Retrieval, pages 330–337. John Canny. 2004. Gap: a factor model for discrete
data. InProceedings of the ACM SIGIR Conference on Research and Development in Information Retrieval, pages 122–129.
Deepayan Chakrabarti and Kunal Punera. 2011. Event summarization using tweets. Proceedings of the Inter-national AAAI Conference on Web and Social Media (ICWSM), 11:66–73.
Kaustav Das, Jeff Schneider, and Daniel B Neill. 2008. Anomaly pattern detection in categorical datasets. In Proceedings of the ACM SIGKDD International Confer-ence on Knowledge Discovery and Data Mining (KDD), pages 169–176.
Anish Das Sarma, Alpa Jain, and Cong Yu. 2011. Dy-namic relationship and event discovery. InProceedings of the ACM International Conference on Web Search and Data Mining (WSDM), pages 207–216.
Wenwen Dou, Xiaoyu Wang, Drew Skau, William Rib-arsky, and Michelle X Zhou. 2012. Leadline: Interac-tive visual analysis of text data through event identifi-cation and exploration. InVisual Analytics Science and Technology (VAST), 2012 IEEE Conference on, pages 93–102. IEEE.
Gabriel Pui Cheong Fung, Jeffrey Xu Yu, Philip S Yu, and Hongjun Lu. 2005. Parameter free bursty events detec-tion in text streams. InProceedings of the International Conference on Very Large Data Bases (VLDB), pages 181–192. VLDB Endowment.
Wei Gao, Peng Li, and Kareem Darwish. 2012. Joint topic modeling for event summarization across news and social media streams. InProceedings of the Inter-national Conference on Information and Knowledge Management (CIKM), pages 1173–1182.
Prem K Gopalan, Laurent Charlin, and David Blei. 2014. Content-based recommendations with Poisson factor-ization. In Z. Ghahramani, M. Welling, C. Cortes, N.D. Lawrence, and K.Q. Weinberger, editors,Advances in Neural Information Processing Systems (NIPS), pages 3176–3184. Curran Associates, Inc.
Valery Guralnik and Jaideep Srivastava. 1999. Event detection from time series data. InProceedings of the ACM SIGKDD International Conference on Knowledge Discovery and Data Mining (KDD), pages 33–42. Alan G Hawkes. 1971. Spectra of some self-exciting
and mutually exciting point processes. Biometrika, 58(1):83–90.
Alan Jackoway, Hanan Samet, and Jagan Sankara-narayanan. 2011. Identification of live news events using twitter. InProceedings of the 3rd ACM SIGSPA-TIAL International Workshop on Location-Based Social Networks, pages 25–32. ACM.
Michael I. Jordan, Zoubin Ghahramani, Tommi S. Jaakkola, and Lawrence K. Saul. 1999. An intro-duction to variational methods for graphical models. Machine Learning, 37(2):183–233, November. Giridhar Kumaran and James Allan. 2004. Text
classifi-cation and named entities for new event detection. In Proceedings of the ACM SIGIR Conference on Research and Development in Information Retrieval, pages 297– 304.
Jey Han Lau, Nigel Collier, and Timothy Baldwin. 2012. On-line trend analysis with topic models:n# twitter trends detection topic model online. InProceedings of the International Conference on Computational Lin-guistics (COLING), pages 1519–1534.
Zhiwei Li, Bin Wang, Mingjing Li, and Wei-Ying Ma. 2005. A probabilistic model for retrospective news event detection. In Proceedings of the ACM SIGIR Conference on Research and Development in Informa-tion Retrieval, pages 106–113.
Scott W Linderman and Ryan P Adams. 2014. Discover-ing latent network structure in point process data.arXiv preprint arXiv:1402.0914.
Xueliang Liu, Raphaël Troncy, and Benoit Huet. 2011. Using social media to identify events. InProceedings of the ACM SIGMM International Workshop on Social Media (WSM), pages 3–8.
Daniel B Neill, Andrew W Moore, Maheshkumar Sabh-nani, and Kenny Daniel. 2005. Detection of emerg-ing space-time clusters. InProceedings of the ACM SIGKDD International Conference on Knowledge Dis-covery and Data Mining (KDD), pages 218–227. Michael J Paul and Mark Dredze. 2012. A model for
mining public health topics from twitter. Health, 11:16– 6.
Wei Peng, Charles Perng, Tao Li, and Haixun Wang. 2007. Event summarization for system management. In Pro-ceedings of the ACM SIGKDD International Confer-ence on Knowledge Discovery and Data Mining (KDD), pages 1028–1032.
Timo Reuter and Philipp Cimiano. 2012. Event-based classification of social media streams. InProceedings of the 2nd ACM International Conference on Multime-dia Retrieval, page 22. ACM.
Takeshi Sakaki, Makoto Okazaki, and Yutaka Matsuo. 2010. Earthquake shakes twitter users: real-time event detection by social sensors. InProceedings of the Inter-national World Wide Web Conference (WWW), pages 851–860.
Hassan Sayyadi, Matthew Hurst, and Alexey Maykov. 2009. Event detection and tracking in social streams. InProceedings of the International AAAI Conference on Web and Social Media (ICWSM).
Aaron Schein, John Paisley, David M Blei, and Hanna Wallach. 2015. Bayesian Poisson tensor factorization for inferring multilateral relations from sparse dyadic event counts. In Proceedings of the ACM SIGKDD International Conference on Knowledge Discovery and Data Mining (KDD), pages 1045–1054.
Courtland VanDam. 2012. A probabilistic topic modeling approach for event detection in social media. Master’s thesis, Michigan State University.
Xuanhui Wang, ChengXiang Zhai, Xiao Hu, and Richard Sproat. 2007. Mining correlated bursty topic patterns from coordinated text streams. InProceedings of the ACM SIGKDD International Conference on Knowledge Discovery and Data Mining (KDD), pages 784–793. ACM.
Gary M Weiss and Haym Hirsh. 1998. Learning to predict rare events in event sequences. InProceedings of the ACM SIGKDD International Conference on Knowledge Discovery and Data Mining (KDD), pages 359–363. Yi Zhang, Jamie Callan, and Thomas Minka. 2002.
Nov-elty and redundancy detection in adaptive filtering. In Proceedings of the ACM SIGIR Conference on Research and Development in Information Retrieval, pages 81– 88.
Qiankun Zhao, Prasenjit Mitra, and Bi Chen. 2007. Tem-poral and information flow based event detection from
social text streams. InProceedings of the AAAI Confer-ence on Artificial IntelligConfer-ence, volume 7, pages 1501– 1506.