Abstract—Ancient manuscript analysis is to aid historian to classify, annotate and judge the authenticity of larger collections of ancient manuscripts. Previous method was to examine the composition of manuscript such as paper support or inks by destructive sampling and chemical analysis. The aim of this paper is to present an image-based non-destructive and non-invasive method to analyze ancient manuscripts. A new unsupervised classification algorithm was designed to distinguish different type of paper support without any priori knowledge. The advantage of this classifier comparing with traditional methods such as K-means is that no pre-defined class number is needed. This is critical important in this application because no any priori knowledge about these manuscript was available before classifying. We presented the multi-model based framework of unsupervised classification, so that different statistical models can be applied to the same flow chart for different applications. This classifier enables us to study the statistical properties of these manuscripts, which is very hard to characterize due to the decay materials and bad resolutions. We evaluated this unsupervised classification performance by a specially developed algorithm. Experiment results show the potential of our unsupervised classification method in ancient manuscript analysis.
Index Terms— Texture Analysis, Ancient Manuscript Analysis, Unsupervised Classification, K-means, Clustering.
I. INTRODUCTION
Ancient manuscript analysis is an important topic for historian to classify, date, annotate and judge the authenticity of large collections of ancient manuscripts. Existing methods are based on destructive testing techniques that require the physicochemical sampling of the manuscript under test. Such methods cannot be used widely mainly because of the historical
Manuscript received December 30, 2007. This work was supported by EU project Non-dEStructive Image based manuscript analysis System(no. 509145).
T.LU is with School of Computer Science, University of Westminster, Harrow ,HA1 3TP, United Kingdom; e-mail: [email protected] .
A. Psarrou is with School of Computer Science, University of Westminster, Harrow ,HA1 3TP, United Kingdom; e-mail: [email protected] .
A. Licata is with School of Computer Science, University of Westminster, Harrow ,HA1 3TP, United Kingdom; e-mail: [email protected] .
V.Konstantinou is with School of Computer Science, University of Westerminster,Harrow, Ha1 3TP, United Kingdom; e-mail: [email protected]
V.Kokla is with School of Computer Science, University of
Westerminster,Harrow, Ha1 3TP, United Kingdom; e-mail: [email protected]
and cultural values of manuscripts. Non-destructive techniques such as spectroscopy and reflectography, which examine the optical properties of the pigments under illumination beyond the visible spectrum, are more suitable for the study and conservation of old manuscripts [1][2]. Spectroscopical techniques can provide quantitative information on manuscript but are very hard to use in manuscript analysis. On the other hand, reflectography is a qualitative method of analysis, which allows us to make important observations on the optical characteristics of manuscripts, but it does not give quantitative results, and it is therefore not accurate.
With the development of image analysis and imaging technology, ancient manuscript analysis can be replaced by non-destructive and non-invasive image based method to prevent the original old and fragile manuscripts from being damaged. The EU funded project NOn dEStructive Image
based manuscript analysis System (NOISES) was set up to
implement this idea. The objective of this project is to develop the computational profiles of ink and support (paper, papytus, etc) and study the image properties of the materials exhibited due to the physical characters of their composition and their manufacturing process so that we can classify manuscript ink and supports according to these computational models by statistical classification techniques and verify homogeneity of ink and support to aid authentication and dating of manuscripts.
Some image-based methods have been introduced in inks and manuscript analysis. At the beginning, most of the image-based research in artifacts was focused in the generation rather than analysis and were mainly applied in the restoration of colors in paintings[3]. Recent years feature analysis[4][5][7] and statistical analysis[6] were more and more introduced in this application.
Since our purpose is to classify different sort of manuscripts, we mainly focused on classification methods for ancient manuscript or document analysis. Basically there are usually two types of classification methods, supervised classification with human intervention, or unsupervised classification. Both already studied by many researchers in relevant applications. Li applied Hidden Markov Random Model in wavelet domain to form digital signature of ancient paintings to assist database
Unsupervised Classification for Ancient
Manuscript Analysis
managers to classify and annotate large collections of images for effective retrieval purpose and automatic analysis of ancient paintings[6]. This Multi-resolution Hidden Markov Model (MHMM) has the advantage to analyses large region of images so that it can capture properties of painting strokes and classify paintings and compare paintings or artists, however, it is a supervised method and therefore require learning stage to establish the mixtures of 2d MHMM models for different artists. Some other researchers presented unsupervised method to
restore a particular type of degradation related to ancient document images[8]. More unsupervised classification methods were presented in image database browsing and management[10][9],which provided us good reference for ancient manuscript classification. There are mainly two types of unsupervised classification methods, one is bottom up (agglomerative), which begins with each element as a separate cluster and merge them into successively larger clusters. The other is top-down which begins with the whole set and then divide it into successively smaller clusters. Chen[10] proposed a hierarchal tree structure based strategy in classification in order to achieve both top down process(search by query) and bottom up process(organizing database for effective browsing). The advantage of this method is the quick and effective search process based upon hierarchal browsing. Other researches also presented unsupervised image-set clustering based upon information bottleneck principal[9]. These jobs provided searching strategies in unsupervised classification, and are valuable for ancient manuscript analysis.
Due to the lack of information about the ancient manuscripts, supervised classification cannot work. We therefore focused on unsupervised statistical method in manuscript classification. We discussed the manuscript classification by unsupervised method to classify different type of paper support from different areas such as Cyprus, Greek and Mediterranean in different time(11th to 17th century) (see figure 1 for two samples of paper support from Cyprus and Greek). Different band of spectral images such as infrared, ultra-violet, visual etc, were used to well display the textures of the paper support. Moreover the statistical properties of these manuscripts are unknown and we cannot judge which statistical models can play better role in this application. This paper will work out a system in which we can classify different type of manuscripts without predefined class number, and compare the classification performance of different statistical models by inputting different statistical descriptors into the classifier and summarizing which features and models are suitable for this application. The work can be extended to the large collection database of all sorts of ancient manuscripts and provide other researchers useful guidance to develop new methods of manuscript analysis.
[image:2.595.112.233.678.734.2]
Figure 1. Samples of paper support from Cyprus and Greek
II. MULTI-MODEL BASED UNSUPERVISED CLASSIFICATION ALGORITHM
Comparing with supervised classification, unsupervised classification requires fewer inputs to the classification process. The algorithm separates the original data into subsets so that the subsets can share some common trait. Frequently used unsupervised algorithms are K-means[11] and ISODATA[12] [13], K-means algorithm set fix number of classes, and keep this number constant in the whole process, while ISODATA has some further refinements to solve this problem by splitting and merging of clusters. Clusters are merged if either the number of members in a cluster is less than a certain threshold or if the centers of two clusters are closer than a certain threshold. Clusters are split into two different clusters if the cluster standard deviation exceeds a predefined value and the number of members is twice the threshold for the minimum number of members. The advantage of ISODATA is that it doesn’t require a priori known class number, but the number of class on this algorithm is hardly optimal especially when the initialized K is not large enough. For the sake of computing cost, a large K is obviously not a good option. Moreover, both K-means and ISODATAis only work well when all the classes have similar variance. This is usually not true in ancient manuscript analysis. In this paper, we present our approach to do unsupervised classification by multiple statistical models. Our unsupervised classification algorithm was developed based upon traditional k-means method, but the way of getting class number is different from ISODATA. Let’s start with the most popular and frequently used unsupervised classification algorithm K-means. As we have known, K-means is an algorithm to cluster objects based on attributes into k partitions. It is an iteration process similar to the expectation-maximization algorithm for mixtures of Gaussians and they both attempt to find the centres of natural clusters in the data. The procedure follows a simple and easy way to classify the given data set through a certain number of clusters (assume k clusters). The main idea is to define k centres, which we call HUT, one for each cluster.These HUTs should be placed carefully because different locations of centres cause different result. The better choice is to place them as far away as possible from each other. The next step is to take each point belonging to a given data set and associate it to the nearest HUT. When no point is pending, the first step is completed and an early grouping is done. Then re-calculate k new HUTs as centres of the clusters resulting from the previous step. A new grouping process will be done based on these k new HUTs. Such a loop will continue and the location of the k HUTs will change step by step until this change is smaller than a predefined threshold. The objective of the K-means algorithm is to minimize the total intra-cluster variance. The objective function (which is to be minimized) is the sums of squares
distances (errors) between each pixel and its assigned cluster
∑ ∑
= ∈− = k
i x S i j
i j
x V
1
2 )
( µ (1)
Where there are k clustersS ,i i=1,2,...,k, and µi is the
centre or mean point (HUT) of all the points xj∈Si.
Minimizing the V is equivalent to minimize the Mean Squared Error (MSE). The MSE is a measure of the within cluster variability.
From description of K-means algorithm, we can see this iterative procedure including the following four steps:
1. Define initial class and HUTs: place k points into the space represented by the objects that are being classified. 2. Assign each object to the group that has the closest HUT. 3. When all objects have been assigned, recalculate the positions of the k HUT based on all the pixels in each class.
4. Repeat step 2 and 3 until the change between iterations is smaller than a predefined threshold.
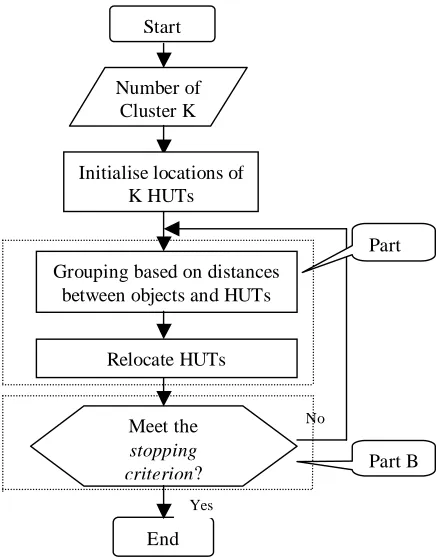
In step 4, it gives the criterion whether to stop the loop for classification or not, so we call it stopping criterion. If stopping criterion is satisfied, the algorithm will end the loop and settle the final classification result. Figure 2 shows the flow chart of the algorithm.
K-means is frequently used unsupervised classification method, but it requires predefined class number, which we don’t have in ancient manuscript classification, so we need to
develop new unsupervised classification method to solve this problem.
From the flow chart in figure 2, we can see that basically K-means method includes two parts of work: 1.Re-classifying (relocating HUTs and re-assigning objects) (part A); 2.Judging whether to stop the loop or not based on stopping criterion (part B). It was proved that K-means algorithm can converge to local minimum [11], so after some loops of part A and part B, the algorithm will finally reach a stage that all the objects belong to a class and keep in this class, therefore the stopping criterion for K-means can be whether the HUTs of classes fixed between each loop or not. Moreover, the iteration of K-means aims to minimize the cost of objective function (equation1).
In our algorithm, we applied a new stopping criterion. It is a statistical model based unsupervised classification algorithm. Instead of objective function, we assume a statistical model for every potential class and then evaluating the probability of the samples. The whole procedure is similar to K-means algorithm, but no predefined class number is needed and the
stopping criterion is based upon the sample probability rather
than the constancy of HUT locations. Referring to the K-means algorithm, we actually define a statistical model for the re-classifying stage (part A), such as Gaussian models, thus the re-classifying becomes the EM (Expectation Maximum) process. After this EM process converges, we do the judge process to decide whether to continue the iteration or stop by the stopping criterion (part B).
As for the number of classes, if there are m objects to be classified, our unsupervised classification algorithm assumes minimum of 2 clusters and a maximum of m clusters need to be classified. At the beginning of the procedure, we set the number of class as 2. From the set of objects (data points), choose any one to be the first HUT, and then find the point that is farthest from this HUT, and make it the second HUT. For each remaining object, find the distance from the object to each HUT and assign the object to the HUT to which it is closer. Then the algorithm will determine whether it is necessary to find a third HUT based on the probability of this classification. If the probability is bigger than a predefined threshold, the iteration will stop, otherwise, find another farthest point from the previous two HUTs and repeat the whole process.
The flow chat of our algorithm includes two layers of iteration (figure 3). Assume in one outer loop, there are k classes, and there are a group of probability distributions
θ
D parameterized by unknown parametersθ={θ1,θ2,...,θk}. The group of probability distributions is associated with probabilities density functions fθ . The whole set of objects
n
x x
x1, 2,..., in one class is a sample of n value from one of these distributions, so the probability density associated with the observed sample is f(x1,x2,...,xn |θk) . Therefore the likelihood function is as follows:
) | ,..., , ( )
(θk = f x1 x2 xn θk
l (2) Start
Number of Cluster K
Initialise locations of K HUTs
Grouping based on distances between objects and HUTs
Relocate HUTs
Meet the
stopping criterion?
End
No
Yes
Part
[image:3.595.55.275.404.684.2]Part B
The maximum likelihood estimates (MLE) of θk can be determined by finding the value of θkthat maximizesl(θk): θˆk =argθ maxl(θk) (3) There are similar procedures for other classes. Thus, each inner loop is a Maximum estimation process to get the parametersθ. When the inner loop is converged and the stopping criterion can still not be satisfied, the new class will be created and the loop will go outside circle. The loops will continue until the stopping criterion is satisfied (Figure 3).
Assume the whole set of objects x1,x2,...,xn in one class follow a multivariate normal distribution as follows:
)) ( ) ( 2 1 exp( 2 1 ) ,..., , ( 1 2 / 1 2 / 2
1 θ θ
π
θ − − Σ −
Σ
= x − x
x x x f T n n (4)
Here Σ is the k×kcovariance matrix. For the time being, we simplify this process and fix the covariance matrixΣ, so only parameters θneed to be evaluated. Here the parameters
k
θ can be the means of each normal distribution (locations of each HUTs) or any other hidden variables to simplify the estimation problem.
Theoretically, there can be as many parameters as the statistical model requires, but the computation cost can be very expensive. We need optimization process such as Genetic Algorithm to estimate these parameters. We’ll do this work in next step.
With this framework of unsupervised classification, the statistical model can be multivariant Gaussian model, Hidden Markov Model or any others suitable models based on the specific application. When we work on ancient manuscript classification, we need texture feature for the classification. As we know, spatial connection and scale are the two main factors to affect texture pattern, so multi-scale Hidden Markov model has its advantage on this application, and it will be our next effort as well.
We also tried Fisher’s Discriminant Analysis instead of the evaluation of probability based on statistical models. The intra-class variance is defined in equation (5):
∑∑
= = − − = k j j n i T j j i j ji c x c
x J 1 ) ( 1 ) ( ) ( ) ( * )
( (5)
Here xi(j) −cj 2is a chosen distance measure between a data point xi( j)and the cluster centrec . It is an indicator of the j
distance of the m data points from their respective cluster centres. n(j)is the number of objects in j cluster.
Assume the center of whole data set is call , then the inter-class variance is defined in equation (6):
∑
= − = k j all j erclass n j c cV
1
int ( )*( ) (6)
Therefore, the stopping criterion was defined as follows based on Fisher’s Discriminant Analysis. It is the ratio between intra-class variance and inter-class variance (equation 7). erclass raclass V V FD int int
= (7) From equation (5) (6) and (7), we can get the stopping criterion in fisher’s discriminant analysis is as follows:
∑
∑∑
= = = − − − = k j all j k j j n i T j j i j j i c c j n c x c x FD 1 1 ) ( 1 ) ( ) ( ) ( * ) ( ) ( * ) ( (8)So we can generalize our unsupervised classification algorithm as follows:
1. From the set of objects (data points), choose any one to be the first hub.
2. Find the point that is farthest from this hub, and make it the second hub.
3. Classify remaining object either by statistical model or distance measurement(Fisher’s Discriminant Analysis). 4. Evaluate the probability of the sample objects or calculate
the Fisher discriminant intra-class and interclass ratio as
stopping criterion. If the stopping criterion is satisfied,
stop otherwise repeat 3 and 4 until HUTs not moved anymore.
5. If still not satisfy stopping criterion, create new HUT, and repeat 3 and 4.
Figure 3. Flow chart of our unsupervised classification algorithm Start
Set Number of Cluster as K= 2
Initialise locations of K HUTs
Grouping based on distances between objects and HUTs
Relocate HUTs Probability < threshold? End No Yes HUTs still change? Yes No K=K+1 Create new HUT
III. PERFORMANCE EVALULATION
For unsupervised classification, we don’t have any labeled output. Instead, the output is a clustering result. Objects with similar features clustered together and no labeled information is available. Even we can label the output clusters, these labels are not correspondent to the input labels, so the performance evaluation of the algorithm should be different from supervised methods, where we have predefined label set and the output label set, so the correct label ratio can be used to judge the performance of the algorithm. For unsupervised classification, we need a special algorithm to achieve the evaluation procedure.
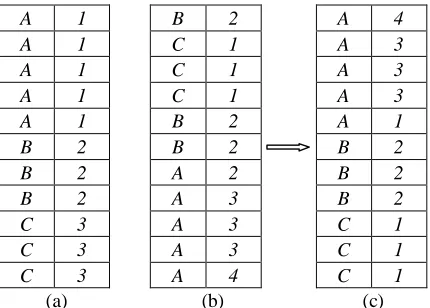
Assume we have a data collection from historian with information about the paper support that we can use to test our classification algorithm. We have a group of clustering results from our unsupervised classification algorithm, which we also labeled but these labels are not correspondent to the input labels. Let’s see figure 4 for an example.
A 1 B 2 A 4
A 1 C 1 A 3
A 1 C 1 A 3
A 1 C 1 A 3
A 1 B 2 A 1
B 2 B 2 B 2
B 2 A 2 B 2
B 2 A 3 B 2
C 3 A 3 C 1
C 3 A 3 C 1
C 3 A 4 C 1
[image:5.595.53.268.345.499.2](a) (b) (c) Figure 4. Illustration of Input labels and output labels Assume the data collection includes 3 types of paper supports
A, B and C, and we labeled them as {1,2,3}(table a). The output
of our unsupervised classification algorithm may get any number of classes, let’s assume we got four classes labeled as 1,
2 , 3 and 4(table b). The labels in table (b) don’t correspond to
labels in table (a), so we can’t evaluate the classification results by normal supervised method.
Our method to evaluate the performance of unsupervised classification algorithm starts with a reorganization process to make the output have the same sequence as the input (from table (b) to table (c)).
After reorganization, there is a label grouping process for the output of unsupervised classification algorithm. From figure 4 input side (table a) we can see, all the labels for the same manuscript support have the same label, but it is not the case on output size (table(c)). In table (c) the same type of manuscript
support may have different labels. For example in table (a), the labels for type A are all 1, while in table (c) the labels for type A are 1 , 3 and 4. Grouping process just groups the objects with the same labels together and records the number for each label. Still the same example, for type A on the input side, there are four label-1s, while on the output side, there are one label-4, one label-1 and three label-3s. After this grouping process, we choose the largest number of labels on output side for one type of manuscript support. In this example, we have three label-3s, which is the largest number of label, so we would think the correct labels for type A are the three label-3s and the other two labels, label-1 and label-4 are wrong labels. We do the same for the rest type of manuscript support and got all the correct labeled objects. The number of correct labeled objects divided by the whole number of objects (manuscript support), we will get the performance evaluation of our unsupervised classification algorithm.
In short, this evaluation process includes the following steps: 1. Reorganizing process to make input and output have the
same sample sequence.
2. Grouping process for each type of sample and fine the largest number of labels.
3. Calculate the number of correct labels for each type and sum them together.
4. Calculate the correct label ratio by the following equation:
all correct
n n
r= (9)
IV. RESULTS
We used 7 groups of manuscript support to test our unsupervised classification method. These manuscripts are from Cyprus, Greek and Mediterranean and were generated in different time from 11th to 17th century. We have 4 groups of manuscripts from Cyprus in different time, 1679(Cyky12), 1671(Cyky5) and 1649(Cyp6) respectively (first 3 rows of table1) and 2 groups of manuscripts from Mediterranean area in 14th (Miet4) and 11th (Mb5), and one group manuscript from Greek in 13th (Grnl47). See table 1.
Table 1. Manuscripts we used in unsupervised classification experiment:
Manuscripts Date Number
Cyky12 1679 10
Cyky5 1671 11
Cyp6 1649 10
Cyp1 -- 10
Miet4 14th 29
Mb5 11th 11
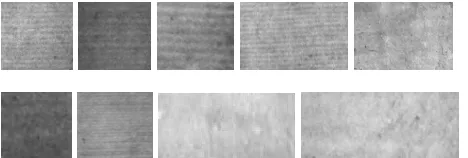
[image:5.595.317.519.639.739.2]All together, we tested 105 manuscripts, and numbers of each type of manuscript support are listed in table 1. One group of manuscripts has no clear date information but it was from Cyprus and labeled as Cyp1.Figure 5 shows some sample images of these manuscripts support.
Figure 5. Sample images of ancient manuscripts used to test our algorithm.
We tested our unsupervised classification method based on both multivariate Gaussian model and Fisher’s Discriminant analysis on these images. Most of other algorithms are learning based, so we just tested our two algorithms. The results showed that the paper of manuscript from Cyprus has the similar features(Cyky12, Cyky6,Cyp6,Cyp1). According to the dates and historical information, they are from the same century. On the other hand the paper of manuscript from Greece (Grn1147) has similar features as the papers of manuscript mb5. According to relevant history information on these two papers, they both have the same kind of fabrication: bombycid. Based on the 3 types of manuscript supports, we run our unsupervised classification algorithms, and get the correct classification ratio according to equation (9)(table2).
Table 2. Correction ratio of the unsupervised method Multivariate Gaussian model 91.876% Fisher’s Discriminant analysis 89.467%
The results showed some potential of our algorithms in this application though further improvement is under going.
V. CONCLUSION AND FUTURE WORK
In this paper we explored a multi-model based framework of unsupervised classification method. The method is unsupervised in the flowing senses:
1. It does not require a priori knowledge on the texture of the images and no learning stage is needed.
2. Number of classes is not needed.
For ancient manuscript classification, we don’t have any priori knowledge about the images, and no class number is available before classification, so it is rather important to develop this kind of unsupervised classification method. This method provides a framework for unsupervised classification. Under this framework different statistical models can be applied based on specific application. It brought us a large space to develop flexible algorithms for different applications. It also makes it possible to study the statistical
properties systematically so that we can choose the right statistical model for a specific application.
Multivariate Gaussian model and Distance based Fisher Discriminant analysis have been applied in our algorithm and showed their potential in Ancient Manuscript analysis. Moreover, we are working on Hidden Markov Model and other models so that we could choose the right model for ancient manuscript classification.
For complex statistical model, Parameters optimization and selection need to be studied. We are going to apply Genetic Algorithm in this process so that we can get the optimized model and optimized parameters to achieve the high performance unsupervised classification.
We only used visible light images in the tests for this paper. It gave us a chance to see how much visible light images can do in this classification. Different spectral band images are already ready and will be used in ancient manuscript classification soon to further enhance the classification performance.
The method presented in this paper showed its potential in ancient manuscript classification. It can also apply to other classification applications.
REFERENCES
[1] Y.Cryssoulakis,J.M. Chassery, “The application of Physicochemical methods of analysis and image processing techniques to painted works of art” , ERASMUS project..
[2] K.Janssens et al, “Use of Microscopic XRF for Non-destructive Analysis in Art and Archaeometry”, X-Ray Spectrometry 29,2000, pp. 73-91 [3] M.Pappas, I. Pitas, “Digital Color Restoration of Old Paintings” IEEE
Trans. On Image Processing, Vol. 9 No. 2, Feb. 2000, pp291-294.
[4] S.Pei, , Y. Chiu., “Background Adjustment and Saturation Enhancement in Ancient Chinese Paintings” IEEE Trans. On Image processing, Volume 15, Issue 10, Oct. 2006 Page(s):3230 – 3234
[5] I.Giakoumis,N. Nikolaidis,I.Pitas, “Digital Image Processing Techniques for the detection and removal of cracks in digitized paintings”, IEEE Trans.
On Image processing ,Volume 15, Issue 1, Jan. 2006 Page(s):178 - 188.
[6] J. Li, J.Z.Wang, “Studying digital imagery of ancient paintings by mixtures of stochastic models”, IEEE Trans. On Image processing, Volume 13, Issue 3, March 2004 pp:340 – 353.
[7] C.paodysseus.M.Exarhos, “Identification of geometrical shapes in paintings and its application to demonstrate the foundations of geometry in 1650 B.C”, IEEE Trans. On Image processing ,Volume 14, Issue 7 July 2005 pp:862 – 873
[8] D.Fadoua,F.L. Bourgeois and H.Emptoz,Restoring “Ink Bleed-Through
Degraded Document Images Using a Recursive Unsupervised Classification
Technique”, 7th International Workshop, DAS 2006, Nelson, New
Zealand, February 13-15, 2006. Proceedings
[9] J.Goldberger, S. Gordon, and H. Greenspan, “Unsupervised Image Set
Clustering Using an Information Theoretic Framework”, IEEE Trans. On
Image processing, Volume 15, Issue 2, February 2006 pp:449 – 458.
[10] J.Y.Chen,C.A.Bouman,J.C.Dalton, “Hierarchical browsing and search of
large image database”, IEEE Trans. On Image processing,Volume 9, Issue
3, March 2000 pp:442 – 455.
[11] S.Z.Selim and M.A.Ismail,”K-Means-Type Algorithms: A Generalized
Convergence Theorem and Characterization of Local Optimality”,
IEEE tran. PAMI(6), No. 1, January 1984, pp. 81-87.
[12] S.Z.Selim and M.A.Ismail,”On the Local Optimality of Fuzzy ISODATA
Clustering Algorithm”, IEEE tran. PAMI(8) No.2, March
1986,pp284-288.