TALSMANDENS GRUPPE - SPRECHERGRUPPE - SPOKESMAN'S GROUP- GROUPE DU PORTE-AI\ROLE OMAM EKnPOH)nOY TYOO'i' - GRUPPO DEL PORTAVOCE - BUREAU VAN DE WOORDVOERDER
••
..
•
.
•
.
••
.
••
.
••
.
...
•
•
••
.
•
..
•
.
••
..
•
.
.
•
·-·.
••
•
••
•
•
••
•
• • • • • •
•
•
• • •
•
•
• •
•
•
• • •
•
• •
•
•
•
• •
•
•
•
•
•
• • •
•
•
•
• •
•
•
•
• • • • •
•
••
•
•
••
•
• •
• •
•• ••
•••
•
•
•
•
•
•
•
••
••
•
• ••
•••••
••••
•
•
•
••
••
•
•
•
•
• •••
•
• •
•
PRISSl·MIDDIUlSI • MITTHlUNG AN OIi PRISSI • PRISS·RIUASI • INFORMATION A lA PRISSI
ANAIOINDIH
rlA TON TYOO •
INFORMAZIDNI AllA STAMPA • MIDIDlllNG AAN DI PIRS
Brussels, 9 September 1982
COMMISSION OIL BULLETIN NR. 161
The
weekly
o;l bullet;n, published by the Comm;ssion,
g;ves the latest
ava;table date relating to pr;ce development ;n the Member States and
for the Community as a whole. The Commission considers that the bulletin
contributEs to improved transparency as regards Community oil markets.
The figures given in each bulletin follow the development over time of
certain prices. They permit a comparison at any instant in time between
Member States but such a comparison may not be representative of
international price relationships over a longer period. Moreover, it is
evident th~t such
a
comparison is limited even if fluctuations in
exchange
rates are ignored; although valid for identical products sold to the same
categories of consumer no account is taken of market structures, (the
produc~ categories reported
are
not in
every
case representative of the bulk
of sales for each product in each country), quality specifications and
methods of distribution which are unique to each Member State. In this
context the essentially indicative nature of some elements of table 2 is
emphasised.
A detailed methodology will be appended to
the
bulletin published at the
beginning of each quarter.
The Commission Oil Bulletin is freely
available
on demand (telephone 235.34.~0.~
J
Weekly
summary:
I
Evolution Cin %) of Community
indications for:
1°> Weighted average pre-tax prices
for principal oil products (Table 2)
compared with 15.12.78
compared with previous week
2°) Weighted average CIF cost of
crude
oil supplies (Table 3)
compared with 15.12.78
-2,47X
+136,40%
KOMMISSIONEN FOR DE EUROPJEISKE F.tELLESSKABER - KOMMISSK)N DER EUROPAISCHEN GEMEINSCHAFTEN ..
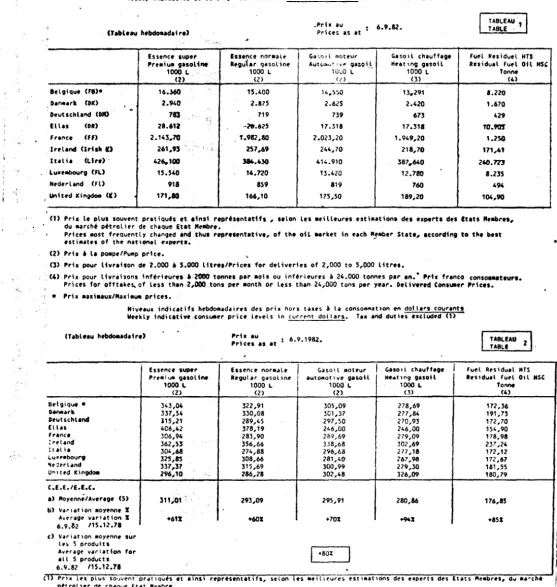
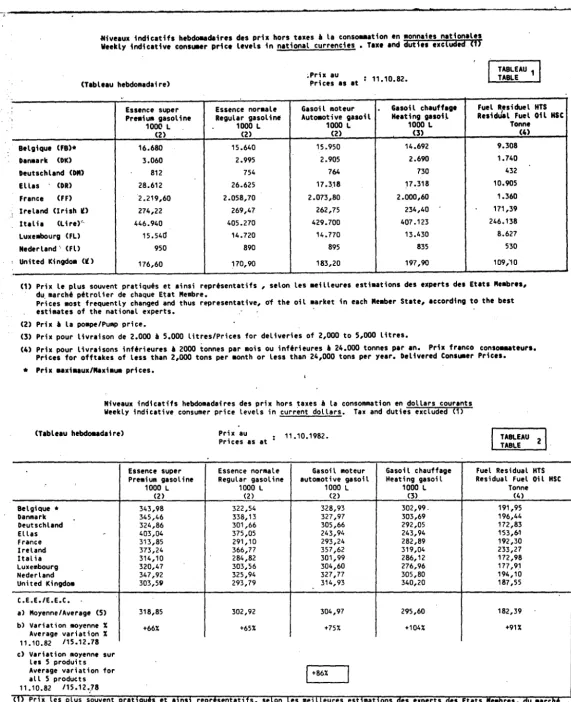
~;ve•u• ;nd;c•tifs hebdOllida;res des prix hors taxes
t la consc•11ation en ~onnaies natic~a,es
Week.Ly ind;c•tive consuiaer pr;ce levels in national currencies. T11e and duties exc,uded
Ci)
.Pri1
IUPrices
11 at:30.8.82.
· TABLEAU 1
I
I
TABL!___:.J
Essence super
Esnnce norHle
611oil 110Uur
61so;l ch1uff19e
Fuel Residuel HTS
Prea;u•
911olineRegular gasoline
Autoaot;ve 911oil
Heatfot gasoH
Ruidual · Fuet Oil HSC
1000 L
1000 L
1000 L
1000 L
Tonne
(2)
(2)
(2)
(3)(4)
'
.
1tl9iQUt (fl)•
15.720
14.840
14.262
13.000
8.220
... 111
<N>2.940
2.875
2.625
2.420
1.670
Deuttc,land
<DII>
783
719
737
666
431
Ell11
(DR)28.612
26.625
17.318
17.318
10.905
Fr•nce (Ff)
2.143,70
1.982,80
2.023,20
1.949,20
1.250
lrel•nd
<Irish
It>.261,93
257,69
244,70
218,70
171,41
lteli• (Lire>
426.100
384.430
409.700
388.080
241.827
LuHllbourt (FL)
15.540
14.720
13.420
12.780
8.235
llnerland (Ft)
907
856
807
749
497
United lingdoa (It)
173,70
168,00
175,50
189,20
105,50
(1)
Pri1 le plus souvent pr1t;quts et •insi reprtsent1tif1, 1elon le1 aeilleure1 e1ti••tions des experts des Et1t1 ,.._.,res,
du aarcht pttrolier de chaque Et•t
Nellbre.Prices aost frequently changed and thus representative, of the oil Hrket in e•ch Netlber State, according to the best
esti111tesof the national experts.
., .. ,,.. •··
<Z> Pris
6la
poape/Pulllpprice.
<3> Pris pour livr1ison de 2.000 • 5.000 litres/Prices for deliveries of 2,000 to 5,000 litres.
(4)
Pris pour livr•isons inftr;eures • 2000 tonnes par
aoisou inftrieures • 24.000 tonnes par an. Prix franco cons011111teur1.
Prices for offtakes. o! less than 2,000 tons per aonth
or less th•n 24~000 tons per ye•r. Delivered Consumer Prices.
• Pris
11a1i111ux/N•1i11uaprices.
rtiveau1 indicatifs hebdoaad1ires de~ pria hors t••es • la conso1111ation en dollars courants
Weekly indicative consumer price levels in current dollars. T•• 1nd·dutie1 excluded
(1)Prh IU
Prices IS
at30.8.1982.
TABLE
TABLEAU
z
•t•lgtque •
.,
"
,
.,,..,111
•utschland
llH
••nee
: •rland
'!al 11 111t'11bour9
• .. dt'rl•nd
IJ .,ited Klngdoa
-'·
.E.E.IE.E.C.
>
Noyenne/Aver19e (5)•
..
,
Variation ffloyenne I
Average variation I
30.8.82
/15.12.71
,:, variation 11oyenne sur
l ts 5 produitl
Avt'rage variation
forall 5 products
•11.8.82
/15.1Z.78
Essence·
superEssence nor11ale
Pre11iu11
gasol.iMRegular gasoline
1000
L1000
L(2)
(2)
329,49
311,04
338,12
330,64
314,71
288,98
405,44
377,28
307,73
284,63
361,63
355,77
303,43
273,76
325,71
308,53
332,41
313,72
299,74
289,90
.311,02
.
293,22
+61% +60X
.
Gasoil
aoteurGasoil chauff19e
I
Fuel Residual HTS
•ut011otive
911oilHuting gasoil
Residual fuel Oil HSC
1000
L1000
LTonne
(2)
(3)i
(4)
298,93
272,47
172,29
301,89
278-32
192,06
296,22
267,68
173,23
245,40
245,40
154,52
290,.43
279,81
179,44
337,84
301,94
236,65
291,7$
27'.6,36
172,21
281,28
267,86
172,60
295,76
274,50
182, 15
302,84
326,48
182,05
294,11
279,26
177, 26
+69X +93X +86X
+79X
·ffi;;.,x les plus souvent prat1quis
et•ins\ representatifs, selon les aeilleures est;aations des experts des Etats Meabres, du 11archt
·
pttrolier de chaque Etat
Membre. ,rr,ces aost frequently charged
andthus representative of the oil 11arket in each
Me11berState, according to the best esti11ates of
the national experts.
'')Prix~ la poaor/ Pump
price· •, l'rix pour llvraison de 2.000 • 5.000 litres~/ PricPs for deliveries of 2,000 to ~,000
u,re,.
,,J
r,,x pour livrlison inftrieure • 2000 tonnes par '"ois ou inftr,cure
i24.000 tonnes par an. Prix franco consoa11ateur1.
rri~~s fa., oc-'~akes of less than 2,000 tons per "'onth ,:,r less th~n ~~.OCJ ton~ per year,
!>elivered Consulfter Prices.
'',) '.... ,r·n, ..
re, te d'une ponderation des quantites .. • .: ···: :
•J·•cna·: •. produtt c,.,;er~.e a .. cours de •'
a~nee1981
·1,, •· .. u•
~ .:f :.1ighting the prices of the i,.,o::uct~ c·~: .. , .. · ..
Jb: thr. ..:.,n:ities consu!!led
cu•'"9 the period 1981
...
-·
---·--
··-·
. ·--:i
coOt.CAf d'allltl'CWistelfflWN1tt en·brut
cw
la C-..ut .. · , CIP Cost of Coaaunity cruN oil IIIPPliH,.Prb au Price aa at
Prb au
Price as at
1S,12.78
Evolution Cl> 30.8.82 /15,12,78
1',·:,. dt .,,.,,,, dts roduits o~trol ;,,., ,~ monnaiH nationalts
e ~1n9 Prices o Petroleue·Products 1n Nat;onal currencies,
!!!
13,87
32,79
TAil.EAU 3 TAfll.[
!!!
107,76
+/-242,48
••
(Tableau aensuel)
Prix
110yens pratiquts auAverage
of prices ruli119as at
15.7.1982. TI.D!.EAU 4 TABLE1.,ftioue CFI)
...
CKD>'"IIIICllland CDII)
1111 (DR)
rence (FF> · rtland· · Cl.ll>
•ulia (Lfrt) ,uellbourt <FL> f•,ttrlaad CFL)
,. ltingdoe <It>
·••tolcaue
<Fa> •• ,, .. •rk (KD>.,..,,, ~• hlend (DIO 11es (DR)
, •ncf (FF)
•Pt end <I .It>
tel le (Lire> ,uPabourg (FL)
••
,.,f•rl•nd (FL)• ltlngdOII (It)
Essence supe~ Essence Noraale
PremiUII Gasoline
Regular Gasoline1000 L (1) 1000 L (1)
texts Hors taxes Pr1• de vente Tues I Hors taxes Prix de vente w;thout TaxH Sellinq Pric•
!
Without Tues S1-llinq Pr;c,15.820 ' 16.2811 32.100 15.600 15.400 31.000
3.382,46 2.897,54 6.280 3.368,04 2.831,96 6.200
615,26 761,24 1.436,50 666,90 696,90 1.363,80
15.187,72 28.612,28 43,800 13.074,43 26.625,57 39.700
2.352,20 2.067,80. 4,420 2.20~,10 1.906,90 4.110
266,50 244,80 511,30 265,85 241,25
.
507, 10593.900 426.100 . 1.azo.000 586.270 383.730 970.000
10.860 15.540 26.400 10.780 14.720 25.500
862,12 947,U 1.816 859,57 900,43 1.760
203,70 167,00 370,70 202,80 160,40 363,20
GasoH Cllauffage Fuel Lourd HTS
HeaHnt G110H H,avy, Fuel HSC
1000 L (3) Tonn, <3)
TalH Hors taHs Prix de vente Taxes
I
Hors taxes . Prix de ventt Without Taxts Sell ina Pr-ice Without Taxes Sellinq Price2.092 12.308 14.400
-
8.397 8.397962,30 2.377,70 3,340 410 1.668 2.078
102, 14 641,40 , 743,54 15 434,25 449,25
2.381,67 17.318,33' 19.700 405 10.905 11.310
526,36 1.898.30 "2.424,66 47 1.220 1.267
15,30 205,60 .220,.90. 10, 14 140,76 150,90
91.558 378.089 469.647 1.000 240.830 241.830
640 12.780. 13.A.2Q 100 8.235 8.335
173,09 736,10 909,19 11,11 529,19 540,30
7,70 189,20 196,90 7,93 1C8,98 116,91
(1) Pr1x a la poape/Puap pr1ce
<2> Livreisons dt ?000 • 5000 L./D1Hveries of 2,ooo··to S,000 L.
(3) Livraisons de aoins 2000 tonn,s par mois et de moins de 24.000 ~onnes par an Offtakes of less then 2,000 tons per month or less than 24,000 tons per y1.r,
Gasoil l'l.>tcur · Autoaotiv~ Gasoil
1000 l (1)
Taxes Hors taxts
I
Pru de vent, Without t '11'1'~ Sell in,J Pric,8.670 13.430 22. 100
1.007,38 2.582,62 3.590
593,71 724,99 1.318,70
-
17 • .:.'18,33-1.397,t.O 1.972,60 3.370
197,15 229,95 427,10
94.480 397.520 492,000
4.420 13.420 17 .840
380,99 797 ,01 1.178
178,80 176,70 I 355,50
I • 47,62 FB - 8,6350 CD 2,4975 DM 6,9435 FF -0,7254 It irl. 1,395 Lires -2,7548 Fl - 0,5803 It angl.-70,27 DR
tcu• 45,0955 FB - 8,17722 CD 2,3651 DM 6,5754 Ff -0,686968 It irl - 1.321,05 Lire: 2,60876 fl - 0,549615 ~ angt. 66,~447 DR
TALSMANOENS GRlJPPE-SPRECHERGRUPPE - SPOKESMAN'S GROUP - GROUPE DU PORTE-PAROL.E
OMMA EKnPOmllOI" TYllO'i' - GRUPPO DEL PORTAVOCE - BUREAU VAN DE WOORDVOEROER
••
•• • •
•
•
••
• • •
•• ••
•••••
•
• •• • •
• •• •
••
•• •
•
•
• •
••
•
••
I
• •
• •
• •
• •
•
•
•
• • • • •
• •
•
• •
•
• •
•
• •
• •
•
•
•
• •
• • •
• •
• • • • • • •
• •
• •
• •
•
•
• •
•
•••
•
•
••
• •
• • ••
•
••
•••
•
•
•
•
• •
•
••
••
•
•
••
•••••
••••
•
•
•
••
••
• • • •
• •••
•
•
•
•
PRISSl·MIDOIULSI • MITTHLUNG AN DH PRISSI • PRISS·RIUASI • INfDRMATIDN A LA PRISSI
ANHDINDIH
nA
TON
nno .
INfDRMAZIDNI ALLA STAMPA. MIOIDILING AAN DI PIRS
---
Brussels, 16 September 1982
q
't
1
1
.}t
II
COMMISSION OIL BULLETIN NR. 162
The weekly oil bulletin, published by the Commission, gives the latest
available date relating to price development in the Member States and
for the Community as a wbole. The Commission considers that the bulletin
contributes to improved transparency as regards Community oil markets.
The figures given in each bulletin follow the development over time of
certain prices. They permit a comparison at any instant in time between
Member States but such a comparison may not be representative of
international price relationships over a longer period. Moreover, it is
evident that such a comparison is limited even if fluctuations in exchange
rates are ignored; although valid for identical products sold to the same
categories of consumer no account is taken of market structures, (the
product categories reported are not in every case representative of the
bulk
of sales for each product in each country), quality specifications and
methods of distribution which are unique to each Member State. In this
context the essentially indicative nature of some elements of table 2 is
emphasised.
A detailed methodology will be appended to the bulletin published at the
beginning of each quarter.
The Commission Oil Bulletin is freely available on demand (telephone 235.34.50.)
J
Weekly
summary :
I
Evolution (in
X>
of Community indications for:
1°) Weighted average pre-tax prices
for principal oil products (Table 2)
compared
with
15.12.78
compared
with
previous
week
20>
Weighted average·c1F
cost of crude
oil supplies (Table 3)
compared
with
15.12.78
+
80%
+
1 .26X
+140,66X
KOMMISSIONEN FOR DE EUROP.IEISKE FJELLESSKABER - KOMMISSION DER EUROPAISCHEN GEMEINSCHAFTEN
COMMSSION OF THE EUROPEAN COMMUNITIES - COMMISSION DES COMMUNAUTES EUROPEENl'ES - EffiPOllH TON EYPOnAiKON KOtNOTHTON
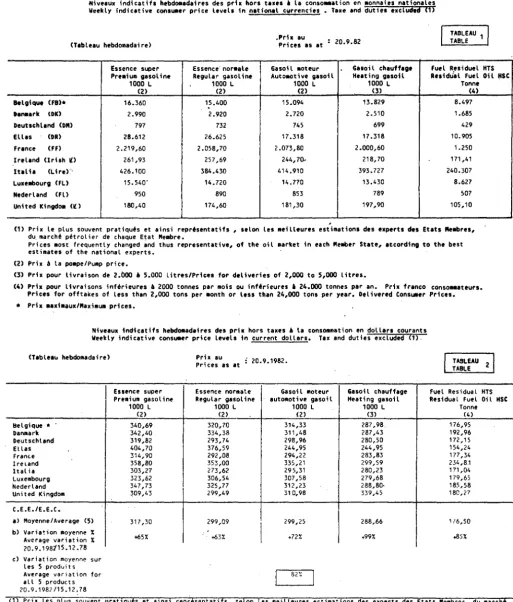
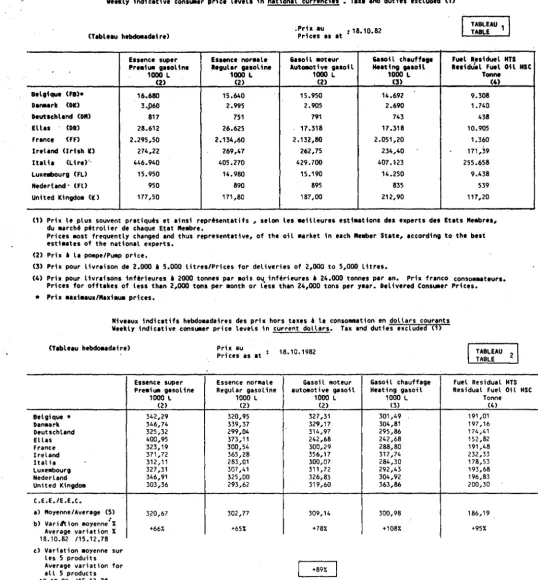
llh1uu1 iNheetih lttbdo,tadairn ~s prh hors t . . e, a la cossor:111atior, en "·:·Maies 111t;onaln Weakly lndicatiVt consuio.r prict ltvtll in natConal currencies. Ta•e end duties a1clllded (1)
Essene• 1up11r Essence noraale
Prealua gasolilllt Regular qasoline 1000 L 1000 L
(2) (2)
BelgiQut ('8)• 16.)60 15.400
hMUk (l)IC) 2.940 Z.17S
-Oeutschland (DIO 783 719
"
Ellas (DR) 28.612 -<'fJ.625 France (Ff) 2. 143,70 T.9S2,80
lr•land Uriah IU 261,93 I , t 257,69
lUlia (Llrd·· 426.100
*·•JO
Lunabovrg OL) 15.540 14.720 llederland (Fl) 918 859
Unhed ICinidOa CU
.
171,80 166, 10I
I
.Prh au Prices as at
Ga <,t) 1 l mot ~ur
Autc.i;,11. ... t 1
'v,.
gasoil_10'JO L
( t )
14,,~~o 2.62S 739 17.318 2.023,20 244,70 41~.910 13.420 819 175,SO 6.9.82.
Gasoil chauffagt Heating gas oil
1000 L
0) n.2<11 2.420 673 17.311 1.949,20 218,70 387,640 12.780 760 189,20
TABt.EAU ·,
TABLE ·
fuel Residual HTS Residual fuel Oil
Tonne (4) a.220 1.670 429 T0.90S' 1.250 171,41 240.7n 8.235 494 104,90
(1) Prix lt plus souvent pratiQuts et alnsl repttsentatlfs, stlon les aeilleures est\•at\ons des expert• des Ctats ,i.at>rts, du •archt pttrolier de chaQue Etlt "elllbre.
Prices aost frtQuently changed
•nd
thut rtprttentativt, of tha oil . . rket in each "e•ber State, eccording to t~t best esti•nes of th" nat;onal f'xnru. ;(2) Prix• le poape/Pump price.
(3) Prix pour livralson de 2.000 • S.000 lltra1/Price1 for deliveries of 2,000 to S,000 litres.
; (4) Prix pour livraisons lnferieuras •·2000 tonnes par aois ou inferieures
a
24.000 tonnes par an.• Prix franco consom . . teur1. Prices for offtakes.of less than2,000
.tons per aonth or less than 24,000 tons per year. Delivered C01'11U11er Prices. • Prix •axiaaux/Naxi•U111 prices.N;veaux indicatifs hebdomadaires des pri• hors ta&ts A la conso~~•t•on en dotla•s courantt Weakly 1ndicltivt,consuaer price levels in current dollars. Tax and duties excluded (1)
Es s,nce SuPtr
Prix au Prices as at
Essene" nor•ale
6.9.1982.
Gasoil 11oteur
I
Gaso,l chauffageI
TABUAU
z
TABLI
fuel Rtsidual NTS
HS'
I
Pre11i u11 gasol IM Regular gasoline I automotive gasoll H.,.t,ng guoH Ruidual fuel 01 l NSC
1000 L 1000 L I 1000 L 1000 L Ton,w
(2) (2)
<n
(3) (4)BelgiQue • 343,04 322,91 305,09 278,69 172,36
o-arll 337 ,S4 330,08 301,37 277 ,84 191,73
OeuUchland 115,21 289,4S 297,50 270,93 172,70
( t i n 406,42 378,19 246,00 246,00 154,90
f ranee 306,94 283,90 289,69 279,09 178,98
:re land 362,53 356,66 3.l8,6!! 302,69 237,24
It ;l la 304,61 274,88 296,68 277, 18 172, 12
4. u • f'1tb<>ur9 325,15 308,66 281,40 ;67 ,98 172,67
-.,:!rrl~nd 337,37 315,69 300,99 279,30 181,~5
U"lted ICingdoa 296,10 .. 286,28 302,48 326,09 180,79 C.E.E.IE.E.C.
•>
"oyeM•IAvertgt (5) 311i01 · 293,09 295,91 280,86 176,ISb) V•r1ation •oyenne I
A•·erag~ var1at;on I +611 +601 +70% +90 +851
6.9.t2 /15.12.78
c) v,r,at,on 11oyf'nn• sur
le• S produiU
I
J
AvPr1ge v•riation for +80X
all S products
6.9.82 /1S.12.71
.
(\) Pr1• Les plus so~vtnt prat1Quh ti ains1 repr•s•ntat1fs, selon Lu at,il lf'ures. est l•at 1ons des experts dts Etats "••bres, dv •••cha
pftrot,•r dP chaQue Etat M~mbr•.
Prices •ost freQutntly ch•rgtd and thus r•Pr•s•ntat;v, of the oil aarket in each "••btr State, according to th• b,,st esttaat•• of the national experts.
'.2) Pri• i la POMPPI Puffip price
~I Pr.a ~vvr 11vr•;son de 2.000 ~ 5.000 litres./ Prices for deliveries of 2,000 to S,000 litres •
.:.) Pr,. pour livra1-;on ,nffr1c..Jr,. I >0(10 tonn•s par 1t1ols ou 1nterH•ur• d 24.(;UJ ton."les par 1n. Pri1 fr1nco conso,..•atPu.rs.
Pr1 •, for ooftakes ot l•~s than ?,000 tons per month or tess thdn
:,,oco
:er;~ per ~~~r. OellvPrpd Consuffl~r Prices.S> lia ~--~,~""' re"sutte d'une cv.~.!1:"r•t•on Cf'S Qudnt1tes consomm1.·~~ a~ ,r,4Q .... f-' pr<.,.Ju1t ,~."1~.:rr:e .Ju ,o..,rs de l'annfe ,
981
Tn• rrsutt of _,.;g~.:ing tht pr~c•s. c,i the prc,~Jc.t:. (O:" . .:t,rri;;;j ty the Quent1t1,.· cor-i~v!'fted ouring th~ p~r,od 19o1. •
TABLEAU 3 /
TAIILE
Cout CAF d'approvisionne•ent rn brut de la C011•unaut•.
(IF Cost of Coaaunity crude oil IUlllll it1, 15.12.78 Pric• as i t
Prix au Ju,n 1982'
l'riet as at June 1982 Evolution CX) 6.9.82 /15.12.78
13,87 107 ,76
33,38 +l-24{>,43
[image:6.605.0.558.32.620.2]TALSMANDENS GRUPPE - SPRECHERGRUPPE - SPOKESMAN'S GROUP- GROUPE 00 PORTE-PAROLE OMMA EKnPOrnnov TYnoY - GRUPPO DEL PORTAi/OGE - BUREAU VAN DE WOORDVOERDER
••
..
•
.
•
.
•• ••
.
.
••
.
...
•
•
•• •
.
..
•
.
••
..
•
.
.
•
·-·.
••
•
••
•
•
• •
•
•
• • • •
•
• • • • • •
•
• • •
• •
• • •
•
•
•
•
•
•
•
• •
• •
•
•
• • •
• •
•
• •
•
•
• • • • •
•
•••
•
•
••
•
•
•
•
•
•• ••
•••
•
•
• •
•
•
•
••
••
•
•
••
•••• •
••••
•
•
•
••
••
• • • •
•
•••
•
•
•
•
PRESSE·MEDDHHSE • MITTEILUNG AN DIE PRESSE •PRESS-RELEASE• INFORMATION A LA PRESSE
ANHOINDIH
rlA TON
nno .
INFDRMAZIDNE ALLA STAMPA • MEDEDHING AAN DE PERS
Brussels, 23 September 1982.
COMMISSION OIL BULLETIN N° 163
'-/'f/7,'tll
The
weekly
oil bulletin, published by the Commission, gives the latest
available date relating to price development in the Member States and
for the Community as a whole. The Commission considers that the bulletin
contributes to improved transparency as regards Community oil markets.
The figures given in each bulletin follow the development over time of
certain prices. They permit a comparison at any instant in time between
Member States but such a comparison may not be representative of
international price relationships over a longer period. Moreover, it is
evident that such a comparison is limited even if fluctuations in exchange
rates are ignored; although valid for identical products sold to the same
categories of consumer no account is taken of market structures, (the
product categories reported
are not in every case representative of the bulk
of sales for each product in each country), quality specifications and
methods of distribution which are unique to each Member State. In this
context the essentially indicative nature of some elements of table 2 is
emphasised.
A detailed methodology will be appended to the bulletin published at the
beginning of each quarter.
The Commission Oil Bulletin is freely av,3ilable on demand (telephone 235.34.~0.)
J
Week
Ly summary :
I
Evolution (in%) of Community indications for
10) Weighted average pre_-tax prices
for principal oil products (Table
compared with 15.12.78
compared with previous week
2°) Weighted average·c1F cost of crude
oil supplies (Table
3)
compared with 15.12.78
2)
+78%
-2.50%
+140,66%
KOMMISSIONEN FOR DE EUROPJEISKE FJELLESSKABER - KOMMISSION DER EUROPAISCHEN GEMEINSCHAFTEN
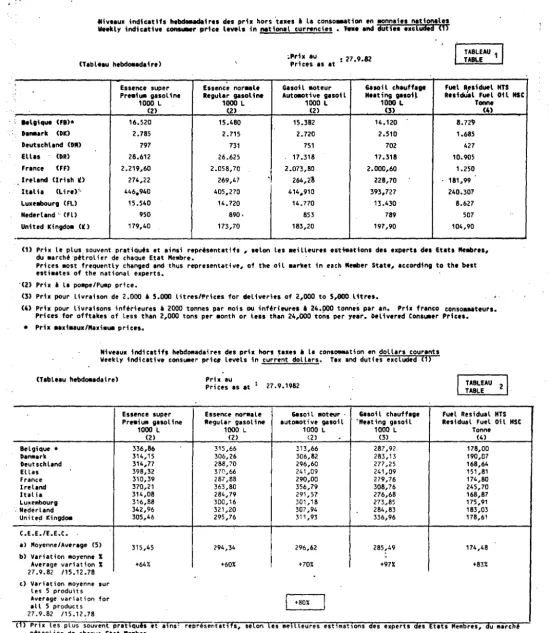
~iveaux indicatifs hebdo.,daires des prix hors ta,~s
a
la consommation en monnaies nationales Weekly indicative contuaer prict ltvtll in natiG .. al currencies, Taxe and duties excluded (1)(Tableau hebdoaadaire>
.Prix au
Pri
cu u
at 13,9,(12TABLEAU 1 TABLE
Essence super Essence normale Gasoil moteur Gasoil chauffage Fuel Residuel HTS
Preaium gasoline Regular gasoline Auto~otive gasoil Heating gasoH ResidJal Fuel Oil HSC
1000 L 1000 L 10u0 L 1000 L Tonne
(2) (2) (2) (3) (4)
Belgique (FB)* 16.360 15.400 14.822 13.564 8.220
DanHrk (DK) 2.990
..
,2.920 , . 72() 2.510 1,685Deutschland CD") 782 716 737 683 432
El las (DR) 28.61·2 26.625 17.318 17.318 10.905
I
· France (FF) 2,219,60 2.058,70 2 .073,BO 2,000,60 1.250
Ireland <Irish ll> 261,93 257,69 244,70
I
218,70 171,41Italia (Lire)" 426.100 384.430 414.910
I
394.167 241.103Luxellbourg (FL) 15 .540 14,720 13.420 12.780 8.235
Nederland (Fl) 933 873 823 760 496
United Kingdom <ll> 171,80 166,10 175,50 189,20 103,30
-(1) Prix le plus souvent pratiques et ainsi representatifs, selon Les aeilleures estiaations des experts des Etats "embres,
du marche petrolier de chaque Etat Mellbre, '
Prices most frequently changed and thus representative, of the oil market in each Member State, according to the best estimates of the national experts,
(2) Prix• la po11111e/Pump price,
(3) Prix pour livraison de 2,000 • 5,000 litres/Prices for deliveries of 2,000 to 5,000 litres.
(4) Prix pour livraisons inUrieures • 2000 tonnes par mois ou inUrieures • 24,000 tonnes par an, Prix franco consoamateurs, Prices for offtakes of Less than 2,000 tons per •onth or Less than 24,000 tons per year, Delivered Consuaer Prices,
*
Prix aaxiaaux/Maximua prices,Niveaux indlcatifs hebda11adalres des prix hors taxes• la comsommation en dollars courants Weekly indicative cons1111er price levels in current dollars, Tax and duties excluded
<1>
(Tableau hebdoaadaire>
Belgique• Danaark Deutsch land El las France Ireland Italia Luxembourg Nederland
United Kingdom
C,E,E,/E,E.C,
al Moyenne/Average (5) b) Variation aoyenne X
Average variation X
13.9.82 /15.12,78
c) Variation moyenne sur
les 5 produits
Average variation for all 5 products
13.9.82 /15.12 •. 78
Essence super Premium gasoline
1000 L.
(2) 337,85 335, 20
I
310,25I
400,59 311, 19I
355,59 300,44I
320,92337,79
I
292,87309, 09 +60X
Prix au
Prices as at 13,9. 1982
I
Essence norHle Gasoil moteur Regular gasoline I automotive gasoil
1000 L I 1000 L
(2)
I
(2) 318,03I
306,u9 327 ,35'
I 304,93 284,07I
292,40372,74 242,44 288,63
I
290,75 349,83 332,20 271,05I
292,55 304,00 I 277, 14316,07 ' ' 297,97 283,15 299,18
289,94 293,19 +58X +69%
+78X
I Gasoil chauffage I Heating gasoil
I
1000 L
!
(3)
!
280, 11
!
281,39 i270,97 242,44 280,49 296,90 277 ,92
263,92
I
275,16 !322,53
i
I 280,83
I
+94XI
iTABLEAU
z
ITABLE Fuel Residual HTS Residual Fuel Oil
Tonne (4) 169, 75 188,90 171,39 152,66 175,25 232,70 170,00 170,06 179,58 176, 10 174 ,06 +83X
.
HSC(1>
Prix Les plus souvent pratiques et a,nsi representatifs, selon Les meilleures estimations des experts des Etats Membres, du marcht petrolier de chaque Etat Membre.(2) (3) (4)
(5)
Prices most frequently charged and thus representative of the oil market in each Member State, according to the Dest est,mat~s of the national experts.
Prix
a
la pompe/ Pump pricePrix pour livraison de 2,000
a
5.000 litres./ Prices for deliveries of 2,000 to 5,000 litres.Prix pour livraison inferieure
a
2000 tonnes par mois ou inferieurea
24,000 tonnes par an. Prix franco consummateurs. Prices fur oofta~es of less than 2,000 tons per month or less than 24,000 tons per year. Delivered Cunsumer Prices. La moyennc resul te d' une ponder at ion des Quant i tes consommees de chaque produi t concerne au cours de , 'aMec ·, 981The rP.sult of weighting the prices of the products concerned by the Quantities consumed during the period 19ol
• Prix maxiM3t,x/M~ximum pr,rPS;
TABLtAU 3
TABLt
CoOt CAF d'approvisionnement en brut de la Communaute. CIF Cost of Community crude oil supplies,
Prh au
Price as at
15.12,78
Prix au iuin 198t
Price as at June 198<'
Evolution (%)
13.~.82/15.12,78
!.!.!
13,87 107, 7 633,38 +/-246,43
'
'
·!·
I
I
I. ,
'
\I
..
..
..
·...
BULLETIN PETROLIER· CEE NO'. 163
EEC OIL BULLETIN NO. 163
Pr;x
c.A.F.
•oyens de l'approvis;onnement en petrole brut de la Communaute
en I par ba r_i l •
,
Average
c.I.F. pdces pf Community supplies of crude oil in I per barrel
BEL
IEN
GERM·
4e Trim 78
13,95
13,92
14,04-4th
Q
78
1e Trim 79
14,70'
15,12
15;, 12·.
1st
Q
79
2e Trim 79
2nd
Q
79
16,65
18,20
18,44
3e Trim 79
20,10
22,42.
22,35~
3rd
Q
79
4e Trim 79
22,47
24,75
25,61
4th
Q
79
1e Trim 80
27,98
31,92
31,90
1st
Q
80
,e Trim 80
30,47
33,28
33,51
2nd
';I80
3" Trim 80
-
34,64
34,63.
3rd
Q
80
4e Trim 80
-
35,24
35,44-·
4th
Q80
1e
trim 81
-
38,50
38,40
1st
Q81
-?.e Trim 81
2nd
Q81
-
37,53
37,38
3e Trim 81
-
34,69
35,64.
3rd
Q
81
..
4e Trim 81
-
35,48
.
35,82
4th
Q81
1e
Trim.82
-
34,42
35,18
1st Q.82
?eTrim82
i
I
-
32;~0
j33,12
2nd
Qi2
l
( 1._)
-
I l-i I
Base 4e Trimestre 1978
=
100
Basis 4th Quar~~r 1978.
=
100
..
.
,,
•;
FRAN:·
IRE
ITAL
NETH
U.K.
EEC
I/bbl
.
..
;
.
,
14,19 13,88
13,29 13,84 13,83 13,87
14,84 · 14,80 14,29 15,01 14,a5 14,81
..
17,11
16,65
16,71 17,36 17,82 17,48
21,32· 20,16 20,81 21,58 21,78 21,53
24,18 23,11 23,12 24,20 24,05 24,20
'
.\
30;63 28,54 29,50 30,20 30,78 30,56
32,38 31,10 31,20. 32,06 33,25 32,45
33~90· 32,19 32,69 33,76 34,21 33,85
135,25 33,49 33,69 35,16 34,95 34,92
37,30 35,90- 36,.85 -36,70 37,5S 37,45
•
137,76 137,11 136,82 37,53 37,51 37,39
136,41
-
135,52 35,38 35,01 35,65
t
36,07
-
134,89 35,49 35,63 35,62
35,99
-
34,19 35,50 34,67 35,10
' . I
34
,lt61
-
l32,081:!2,65
I
3?,13132.97
Index(1)
Indice
100,0
106,8
126,0
155,2
174,4
220,3
233,9
'
244,-251,7
270,-269,5
257,-
253.,-:
237;-I
TALSMANOENS GRUPPE- SPRECHERGRUPPE - SPOKESMAN'S GROI.P- GROUPE OU PORTE-PAROLE OMA/J.A EKnPOronov TYllO'? - GRUPPO DEL PORTAVOCE - BUREAU VAN DE WOORDVOEROER
•• •
.. .
•
.
••
.
••
.
••
.
...
• •
•• • •
. ..
.
•• •
.. .
.
•
·-·.
•• • •• •
•
• •
• • • • •
•
• •
•
• •
•
•
• • •
• • • • •
•
• •
•
•
•
• •
• •
• • •
•
• •
•
•
• •
•
•
•
• •
• •
•
•
•
•••
•
•
••
•
•
• •
•
••
••
•••
•
•
•
•
•
•
•
••
••
•
•
•• ••••
•••••
•
•
•
••
••
•
• • •
• •••
•
•
•
•
PRISSl·MIDDHHSI • MITTHlUNG AN OIi PRHSI • PRHS·RIUASI • INFORMATION A lA PRISSI
ANHOINDIH
rlA TON TYRO •
INFDRMAZIDNI Alli STAMPA • MIDIDIUNG AAN DI PIRS
Brussels, 30 September
1982.
'IYI
7. YI/
COMMISSION OIL BULLETIN N°
164
The
weekly
oil bulletin, published by the Commission,
gives
the latest
available date relating to price development in the Member States and
for the Community
as
a
whole. The Commission considers that the bulletin
contributes to improved transparency as regards Community oil markets.
The figures given in each bulletin follow the development over time of
certain prices. They permit a comparison at any instant in time
between
Member States but such a comparison may not be representative of
international price relationships over a longer period. Moreover, it is
evident that such a comparison is. limited·even if fluctuations in
exchange
rates are ignored; although valid for identical ·products sold to the same
categories of consumer no account is taken of .market structures, (the
product categories reported are not in every case representative of the bulk
of sales for each product in each country), quality specifications and
methods of distribution which
are unique to each Member State. In this
context the essentially indicative nature of some elements of table 2 is
emphasised.
A-
detailed methodology will be appended to the bulletin published
at
the
beginning of each quarter.
The Commiision Oil Bulletin is freely available on demand (telephone
235.34.~0.>
J
Weekly summary :
I
Ev?lution (in
X>
of Community indications for:
1°) Weighted average pre-tax prices
for principal oil products (Table 2)
compared with
15.12.78
compared with previous
week
2°> Weighted
average·c1F cost of crude
oil supplies (Table 3)
compared
with
15.12.78
+82%
+5,12%
+140,66%
KOMMISSIONEN FOR DE EUROPJEISKE FJELLESSKABER - KOMMISSION DER EUROPAISCHEN GEMEINSCHAFTEN
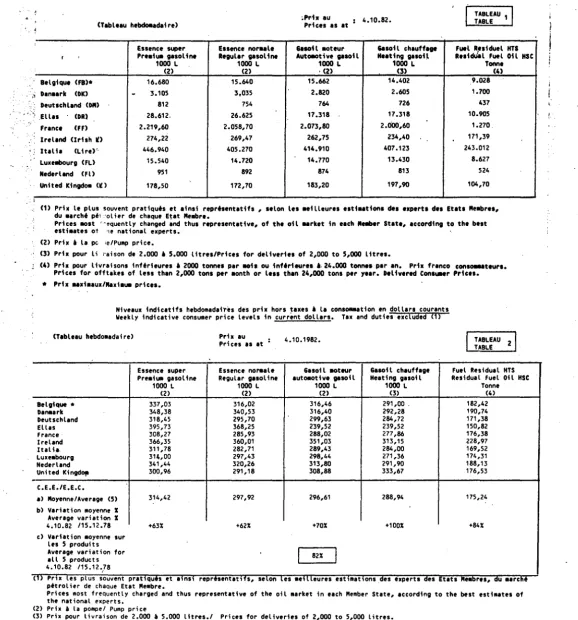
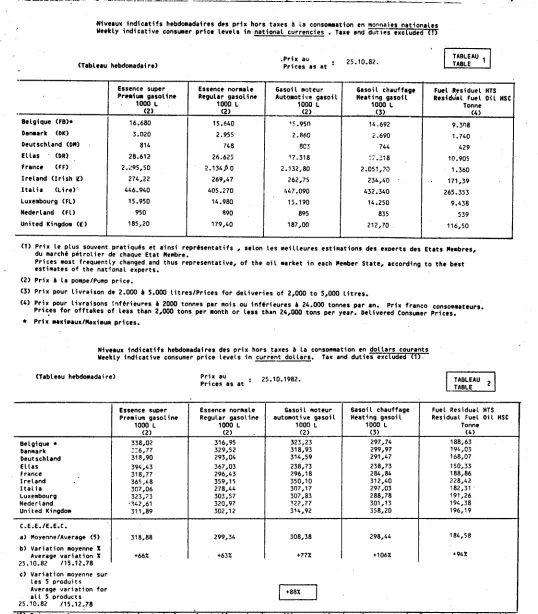
~iveaux indicatifs hebdoaadaires des prix hors taxes• la conso . . ation en aonnaies nationales Weekly indicative consuaer pdce levels in national currencies • Taxe and duties excludad (1)
(Tableau hebdomadaire)
.Prh au
Prices as at 20.9.82
TABLEAU 1 TABLE
Essence· noraale Gasoil moteur Fuel Residuel HTS Essence super Gasoil chauffage
Preaium gasoline Regular gasoline Autoaotive gasoil Heating gasoil ResidJal Fuel Oil HSC
1000 L 1000 L 1000 L 1000 L Tonne
(2) (2) (2) (3) (4)
Belgique <Fa>• 16.360 15.400
.
15.094 13.829 8.497Danaark <OK) 2.990 2.920 2.720 2.510 1.685
Oeutschland (ON) 797 732 745 699 429
El las (DR) 28,612 26.625 17.318 17.318 10.905
France (FF) 2.219,60 2.058,70 2.073,80 2.000,60 1.250
Ireland (Irish It) 261,93 257 ,69 244, 70- 218,70 171,41
Italia CL ire):·· 426.100 384.430 414.910 393.727 240.307
Luxeabourg (FL) 15. 540' 14.720 14.770 13.430 8.627
Nederland (Fl) 950 890 853 789 507
United Kingdoa (It) 180,40 174,60 181,30 197,90 105,10
,
(1) Prix le plus souvent pratiquts et ainsi reprtsentatifs, selon les meilleures estimations des experts des Etats Neabres,
du. march! petrolier de chaque Etat flleabre.
Prices aost frequently changed and thus representative, of the oil market in each flleaber State, atcording to the best
estimates of the national experts. (2) Prix~ la pompe/Pump price.
(3) Prix pour livraison de 2.000 • 5.000 litres/Prices for deliveries of 2,000 to 5,000 litres.
(4) Prix pour livraisons inftrieures • 2000 tonnes par mois ou inftrieures i 24.000 tonnes par an. Prix franco consomaateurs. Prices for offtakes of less than 2,000 tons per aonth or less than 24,000 tons per year. Delivered Consuaer Prices. • Prix aaxiaaux/Naximum prices.
Niveaux indicatifs hebdomadaires des prix hors taxes• la consommation en dollars courants Weekly indicative consuaer price levels in current dollars. Tax and duties excluded (1).
(Tableau hebdomadaire)
Essence super Premium gasoline
1000 L
(2)
Belgique• 340,69
Danmark 342,40
Deutsch land 319 ,82
El las 404,70
France 314,90
Ire,and 358,80
Italia 303,27
Luxembourg 323,62
Nederland 347,73
Un it ed Ki ngdoffl 309,43
C.E.E./E.E.C.
a> Moyenne/Average (5) 317 ,30
b) Variation moyenne X
-+65X
Average variation X
20.9.198115.12.78
c) Variation moyenne sur
Les 5 produits
Average variation for
all 5 products
20.9.1982/15.12.78
Prix au
Prices as at 20,9.1982.
Essence normale Gasoil 11oteur Regular gasoline auto11otive gasoil
1000 L 1000 L
(2) (2)
320,70 314,33
334,38 311,48
293,74 298,96
376,59 244,95
292,08 294,22
353,00 335,21
273,62 295,31
306,54 307 ,58
325, 77 312,23
299,49 31 0,98
299 ,09
I
299 ,25-163% +727.
I
82'.(I
Gasoil chauffage Heating gasoil
1000 L
[image:12.602.32.546.40.642.2](3) 287,98. 287,43 280,50 244,95 283,83 299,59 280,23 279,68 288,80· 339,45 288,66 +997. TABLEAU 2 TABLE
Fuel Residual HTS Residual Fuel Oil
Tonne (4) 176,95 192,96 172, 15 154,24 177 ,34 234,8.1 171,04 179,65 185,58 18C,27 1/6,50 +85X HSC
(1) Pr,x Les plus souvent pratiques et ainsi representat,fs, selon les me1lleures estimations des experts des Etats fllembres, du marcht petrolier de chaque Etat fllembre.
(2) (3)
(4)
(5)
•
Prices most frequently charged and thus representative of the oil market in each Member State, according to the best esti~ates of
the national e,perts. Prix a la pompe/ Pump price
Prix pour livraison de 2,000
a
5.000 litres./ Prices for deliveries of 2,GOO to 5,000 l,tres.Prix pour l1vraison inferieure
a
2000 tonnes par mois ou inferieurea
24,000 tonnes par an. Prix franco consommateurs, Prices for ooftakes of less than 2,000 tons per month or less than 24,000 tons per year. Oelivere? Consumer Prices.La moyenne resulte d'une ponderation des quantites consommCes de chaque produit concerne au cours de .'arnee 1Y81
The result of weighting the prices of the products concerned by the ~uantities consumed during the period 1981 Prix maximaux/Mnximum prices •
TABLEAU 3
TABLE
_j
·----1/B !iT
Cout CAF d'approvisionnement en brut de la Communaute.
CIF Cost of Community crude oil supplies.
Prix au Price as at
15.12.78 13,87 107,76
Prix au juin 1982
I
Price as at June 198233,38
I
Evolution CU1
20.9.82 /15.12.78
.1 ... __
"_e_r_Ho_-~_:_L._o~-~--·_·_.-
j
..
..
.
The.Commission Oil Bulletin indicates:
1.
Each
week
a> the indicative level of the most representative pre-tax consumer prices i~
each Member state and -for
the
Community as a whole, for the following principal
oil products and consumer types:
-
premium and regular gasolines and automotive gasoil, at the pump;
.::
-
heating gasoil, for deliveries of 2000 to 5000 litres;
residual fuel oil (maximum sulphur content) delivered prices for (small>
consumers with offtakes of less than 2000 metric tons per month or
less
than 24.000 metric tons per year.
These
price levels are indicated in national currencies (Table 1) and in
current
dollars (Table l). In the latter case, the bulletin also indicated for the
Community as
a
whole, the percentage change from mid December 1978 in the
price of each product~ and in the
average
for all the products considered
weighted according to their consumption during a given period.
b>
the cif cost level of Community crude oil supplies, calculated at the
date of landing (Table 3>. This is a weighted average which includes
Community
produced
crude oils consumed within the producing member
state
and based on the actual structure of Community supply and the prices
actually paid for the crude oils concerned (i.e. including both rebates and
premia). Data for this calculation are obtat~ed in the main, from the monthly
declarations made under· the Community· system for the registration of crucfe
ot l i"1)orts.
·
2. Each Month
Average ruling prices (and the taxes and duties applicable) in national currency
for principal oil products in each member state as at the 15th of the previous
month (Table 4). For the same date, this table also shows the rates of
exchange against the dollar and the European Unit of Account to fac;litate
comparison,
;1
desired,
between
Member states.
3~
Each
Quarter
The level in current dollars, and the indexed evolution s;nce the first quarter
of
1977
(Fourth quarter
1978
=
100), of the average CIF price of
crude
oil supply
for each Member state and for the Community as a whole.
These average CIF prices, obtained•through application.of a 1976 Counc;l
Direct;ve and a Commission implementing decision of 1977 on price transparency,
are derived from oil co,rpany declarations received by the Commission via
Member states; these data cover at least 85 X of crude oil imports and include
local crude production. Average quarterly costs for each type of crude are
weighted by the quantities actually supplied using the official market rates
of exchange to obtain the most representative supply cost indications.
Finally table 6 shows, by Member Country and for the Community, the i~orted
supply cost
of
the main petroleum products. This cost figure is also
available in accordance with the requirements
of
Community documents on the
TALSMANOENS GRUPPE - SPRECHERGRUPPE - SPOKESMAN'S GROUP - GROlPE DU PORTE-AI\ROLE a..1A/:iA EKnPOl:OllOY TYnoY - GRUPPO DEL PORTAVOCE - BlJEAlJ VAN DE WOORDVOERDER
••
.
..
.
.
•
. . .
.
•
. .
.
•• ••
.
. . .
.
.
••
.
.
...
•
• ••
.
•
..
•
.
••
..
•
.
.
• ••
·-·.
•
••
• •
• •
.
. .
. .
.
.
. . .
.
.
.
.
. . . .
.
.
.
. . .
.
. .
. .
. .
. ...
• •• •
•
•
•
•
•
•• ••
•••
•
•
• •
•
•
•
••
••
•
•
••
•••••
••••
•
•
•
••
••
•
• •
•
•
•••
•
•
•
•
PRISSl·MIDDHHSI • MITTIILUNG AN 011 PRISSI • PRISS·RHIASI • INfDRMATIDN A LA PRISSI
ANHOINDIH rlA TON TYDO • INfORMAZIDNI ALLA STAMPA • MIDIDHING AAN DI PIRS
Brussels, 7 October
1982.
COMMISSION OIL BULLETIN N°
165
"\I\
.
'-\(\.
"\
The weekly oil bulletin, published by the Commission, gives the latest
available date relating to pri~e development in the Member States and
for the Community as a whole. The Commission considers that the bulletin
contributes to improved transparency as regards Community oil markets.
The figures given in each bulletin follow the development over time of
certain prices. They permit a comparison at any instant in time between
Member States but such a comparison may not be representative of
international price relationships over a longer period. Moreover, it is
evident that such a comparison is Limited even if fluctuations in exchange
rates are ignored; although valid for identical products sold to the same
categories of consumer no account is taken of market structures, (the
product categories reported are not in every case representative of the bulk
of sales for each product in each country), quality specifications and
methods of distribution which are unique to each.Member State. In this
context the essentially indicative nature of some elements of table 2 is
emphasised.
·
A detailed methodology will be appended to the bulletin published at the
beginning of each quarter.
The Commission Oil Bulletin is freely available on demand (telephone
235.34.SQ.)
J
Weekly summary:
I
Evolution (in
X)
of Community i ndi cat ions for
.
.
10)
Weighted average pre-tax prices
for principal oil products (Table
2)
compared
with
15.12.78
+80%
compared with previous
week
-2,44%
20)
Weighted average·c1F cost
9f
crude
oil supplies (Table 3)
compared with
15.12.78
+140,66%
KOMMISSIONEN FOR DE EUROPJEISKE FIELLESSKABER - KOMMISSK)N DER EUROPAlSCHEN GEMEINSCHAFTEN
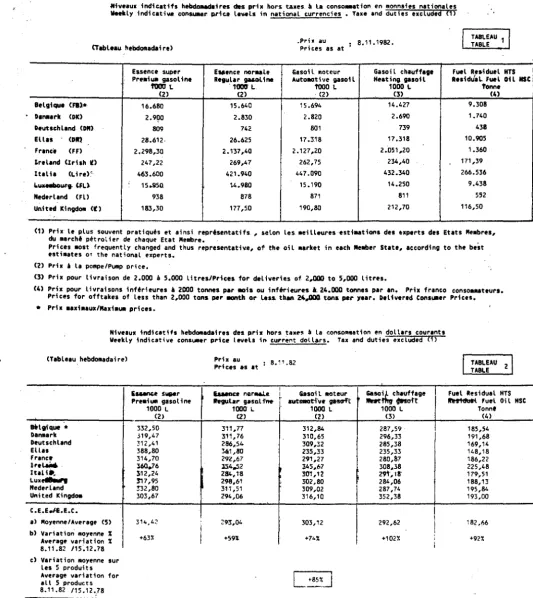
--....---~---~---·---ftiveaux indicatifs h e ~ i r e s des prix hors taxes• la consoaaation en aonnaies nationales W.ekly indicative consuaer price levels in national currencies. 'felle end dutiee excluilid (1)
(Tabl•au hebdoaadaire>
[image:16.612.31.581.22.655.2];Prix au 82 Prices as at : 27"9"
TABLEAU 1 TAB\.E
Essence super Essence noraale Gasoil aoteur Gasoil chauffage Fuel Residuel HTS Preaiu• gasoline Regular gasoline AutOIIOt i ve guol l HHtfog gasotl Resldu'al Fuel Oil HSC
1000 L 1000 L 1000 L 1000 L Tonne
(2) (2) (2) (3) (4)
lelgique
<fl>•
16.520 15.480 15 .• 382 14.120 8.72'1Danaark (DK) 2.785 2.715 2.720 2.510 1.685
Deutschland (DN) 797 731 751 702 427
Elles (DR) 28.612 26.625 17 .318 17.318 10.905
France <FF) 2.219,60 2.058,70 2.073,80 2.000,60 1.250
Ireland Clrish II> 274,22 269,47 ' 264,2! 228,70 181,99
Italia (Li re)'· 446.940 405.270 414.910 393,727 240.307
Luxellbourg <FL) 15.540 14.720 14. 770 13.430 8.627
Nederland'· (Fl) 950 890, 853 789 507
United Kingdom Cir'.) 179,40 173,70 183,20 197 ,90 104,90
(1) Prix le plus souvent pratiquts et ainsi reprtsentatifs, selon les aeilleures est~ations des experts des Etats Nellbres, du aarcht petrolier de chaque Etat Membre.
Prices aost frequently changed and thus representative, of the oil aarket in each Nellber State, according to the best estiaates of the national experts.
'(2) Prix i la poape/Puap price.
(3) Prix pour livraison de 2.000 • 5.000 litres/Prices for deliveries of 2,000 to 5,000 litres.
(4) Prix pour livraisons inferieures • 2000 tonnes par mois ou inferieures • 24.000 tonnes par an. Prix franco consoa .. teurs. Prices for offtakes of less than 2,000 tons per aonth or less than 24,000 tons per year. Delivered Consuaer Prices. • Prix ••xiaaux/Maxiaua prices.
Niveaux indicatifs hebd0111adaires des prix hors taxes• la cons01111ation en dollars courants Weekly indicative consumer prictt levels in current dollars. Tax and duties excluded (1)
(Tableau hebdoaadaire) Prix au
Prices as at 27.9.1982 TABLEAU 2 TABLE Essence super Essence nol'fflale 6asoi l IIOteur · Gasoil chauffage Fuel Residual HTS
Preaiua gasoline Regular gasoline automotive gasoil 'Heating gasoil Residual Fuel Oil HSC 1000 L 1000 L 1000 L 1000 L Tonne
(2) (2) (2) (3) (4)
Belgique• 336,86 315,66 313,66 287,92. 178,00
Dant1ark 314,15 306,26 306,82 283, 13 190,07
Deutsch land 314,77 288, 70 296,60 277 ,25 168,64 El las 398,32 370,66 241,09 241,09 151,81 France 310,39 287 ,88 290,00 279, 76 174,80
Ireland 370,21 363,80 356,79 308,76 245,70
Italia 314,08 284,79 291,57 276,68 168,87 Luxembourg 316,88 300,16 301,18 273~85 175,91 . Nederland 342,96 321,20 307 ,94 284,83 183,03 United Kingdom 305,46 295,76 311,93 336,96 178,61 C.E.E.IE.E.C.
al l'loyenne/Average (5) 315,45 294,34
!
296,62 285,49 174,48b) Variation moyenne X
I
Average variation X +64X +60X I +70% +97X +83X
27.9.82 /15.12.78
.
c) Variat;on moyenne sur les 5 produits
Average variation for
I
+SOXI
all 5 products27.9.82 /15.12.78
(1) Pr,x les plus souvent prat1Quts et a1ns. representat1fs, selon les meilleures est1mat1ons des experts des Etats Membres, du marcht " " " '
petrolier de chaque Etat Membre.
Pri·ces most frequently charged and thus represe~tative of the oil market in each Member State, according to the best estiaates of the national experts.
(2) (3) (4)
(5)
Prix • la po1111e/. Pump price
Prix po~r livraison de 2.000
a
5.000 litres.( Prices fq~ deliveries of 2,000 to 5,000 litres.Prix pour livraison inf~rieure • 2000 tonnes par mois ou inferieure a 24.000 ton~es par an. Prix franco consommateurs. Prices for ooftakes of less than 2,000 tons per month or less than 24,000 to~s per year. Delivered Consumer Prices. La moyenne resulte d"une ponderation des quantites consommees de chaque produ;t concerne au cours de l'annee 1981 The result of weighting the prices of the products concerned by the qua~tities consumed during the period 1981
* Prix •aximaux/Maximum prices.
TABLEAU 3 TABLE CoOt CAF d'approvisionneaent en brut de l• C011munaut•.
Clf Cost of Community crude oil supplies. 15.12.78 13,87
!!!
107,76 Prix au
Price as at
Prix au juin 1982
33,38 +/-246,43 Prfce a, at June 1982
TALSMANDENS GRUPPE - SPRECHERGRUPPE - SPOKESMAN'S GROUP - GROUPE DU PORTE-PAROLE OMAM EKnPOH)flOY TYllO'i' - GRUPPO DEL PORTAVOCE - BUREAU VAN DE WOORDVOERDER
·:.·:
.
.
. .
..
.
. .
.
. . . .
.··
.
.
.
:·.·:
. . .
...
..
.
. .
.
:.:
.
. . . .
.
··.·.:.
.
. . . .
.
.
.
..
. . . .
.
..
.
.
. .
:
.. ....
.
.
. .
. . .
:
.
· - ·
:·.
..
. .
..
.
;··
•
•
•
•
••
••
••
•
•
••
•
•
•
•
•
•
••
•
•
•••••
•••
•
• •
•
•
PRISSl·MIDDUUSI • MITTHLUNG AN OIi PRISSI • PRISS·RUIASI • INFORMATION A LA PRHSI
ANAIDINDIH
nA
TON
nno •
INFORMAZIDNI ALLA STAMPA. MIDIDUING AAN DI PIRS
Brussels, 14 October 1982
COMMISSION OIL BULLETIN No 166
The weekly oil bulletin, published by the Commission, gives the latest
available date relating to price development in the Member States and
for the Community as a whole. The Commission considers that the bulletin
contributes to improved transparency as regards Community oil markets.
The figures given in each bulletin follow the development over time of
certain prices. They permit a comparison at any instant in time between
Member States but such a comparison may not be representative of
international price relationships over a Longer period. Moreover, it is
evident that such a comparison is limited even if fluctuations in exchange
rates are ignored; although valid for identical products sold to the same
categories of consumer no account is taken of market structures, (the
product categories reported are not in every case representative of the bulk
of sales for each product in each country), quality specifications and
methods of distribution which are unique to each Member State. In this
context the essentially indicative nature of some elements of table 2 is
emphasised.
A detailed methodology will be appended to the bulletin published at the
beginning of each quarter.
The Commission Oil Bulletin is freely available on demand (telephone 235.34.50.)
j
Weekly summary:
I
Evolution Cin X> of Community indications for:
10)
Weighted average pre-tax prices
for principal oil products (Table
compared with
15. 12.
78
compared with previous week
2°) Weighted average·cIF cost of crude
oil supplies (Table 3)
compared with 15.12.78
2)
+
82%
+2,50%
+140,66%
KOMMISSIONEN FOR DE EUROPIEISKE FIELLESSKABER - KOMMISSION DER EUROPAISCHEN GEMEINSCHAFTEN