Finding Rising and Falling Words
Erik Tjong Kim Sang
Meertens Institute Amsterdam [email protected]
Abstract
We examine two different methods for finding rising words (among which neologisms) and falling words (among which archaisms) in decades of magazine texts (millions of words) and in years of tweets (billions of words): one based on correlation coefficients of relative frequen-cies and time, and one based on comparing initial and final word frequenfrequen-cies of time intervals. We find that smoothing frequency scores improves the precision scores of both methods and that the correlation coefficients perform better on magazine text but worse on tweets. Since the two ranking methods find different words they can be used in side-by-side to study the behavior of words over time.
1 Introduction
Languages are changing all the time, under the influence of contact with other languages, communication media or reasons of production effort (Trask, 1994; Campbell, 1998). One of the type of changes that can be observed is the birth of new words (neologisms). At the same time other words are falling out of favor (archaisms). We are interested in these two processes. Finding new words in a language is also useful for lexicographers that want to keep dictionaries up-to-date.
In this paper we examine two different methods for extracting words with rising and falling relative frequencies. We apply the methods to decades of Dutch magazine text and years of tweets, and evaluate the quality of the output of the two methods1.
After this introduction, we discuss some related work in section two. In section three we describe our data and the two ranking methods. Section four presents an overview of the experiments we performed with the magazine data and their results. In section five, we conclude.
2 Related work
Discovery of new words (neologisms) is often a chance process best fueled by reading news stories. Formal definitions in literature on lexicography do not deal with the process of discovering neologisms but with the survival chances of new words, which are estimated by their frequency and the diversity of the sources in which they were found (Metcalf, 2002; Barnhart, 2007; Kershaw et al., 2016).
O’Donovan and O’Neill (2008) collect recent texts for discovering neologisms for lexicon expansion. Breen (2009) suggests to use lexical indicators to retrieve neologisms from Japanese texts, an approach earlier applied by Paryzek (2008) for English. Cook (2010) identifies different types of neologisms and different methods for identifying them. Megerdoomian and Hadjarian (2010) use information gain to retrieve neologisms related to various topics. Michel et al. (2011) was the first to report that the Google books corpus contained valuable information for lexicon builders. Lau et al. (2012) used mathematical models for finding novel topics (word sets) in social media texts (tweets). Eisenstein et al. (2012) interestingly linked neologisms found on social media to geographical locations. Chiru and Rebedea (2014) recognize neologisms and archaisms by comparing their frequency progressions with prototype This work is licensed under a Creative Commons Attribution 4.0 International License. License details: http:// creativecommons.org/licenses/by/4.0/
1Data and software related to this paper are available athttp://ifarm.nl/erikt/papers/lt4dh2016.zip
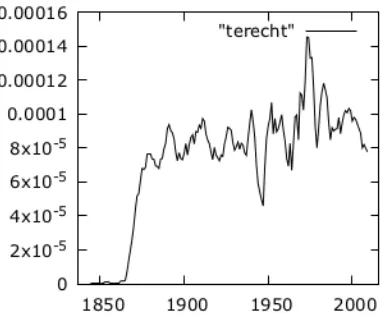
Figure 1: An example of the expected shape of the frequncy graph for new words: the modern spelling ofterecht(right) is not used in the beginning of the nineteenth century and after a short steep rise (1866-1871) its frequency reaches a more or less stable value.
progressions. Kershaw et al. (2016) studied differences in new words from different regions of the United Kingdom with respect to frequency, form and meaning.
Recent work on language change goes one step further by not only studying vocabulary growth but also the change of word meanings over time. Kulkarni et al. (2015) use among other word co-occurrences to find shifts in word meaning. Wijaya and Yeniterzi (2011) apply cluster techniques on the Google books corpus to find the years in which the preferred meaning of ambiguous words changed.
3 Data and methods
We use two text corpora for our experiments. The first consists of the texts from the Dutch literary magazine De Gids2, which are available from the Nederlab website3(Brugman et al., 2016). This a
high-quality corpus spanning 173 years (1837-2009) and containing about 88 million tokens. We extracted counts for lower case versions of individual words (unigrams) for the 169 available years (editions 1945, 2003, 2004 and 2008 are unavailable). We have only used the words which occurred 100 times or more in the corpus. This data set contains 32,312 unique words.
The second text corpus consists of Dutch tweets as collected for the period January 2011-August 2016 (68 months) by the website twiqs.nl (Tjong Kim Sang and van den Bosch, 2013). This corpus contains 27 billion tokens of which the individual token counts are available per month. We only used the counts for the tokens consisting entirely of lower case characters with the additional restriction that each token needed to appear at least 10,000 times in the corpus. This data set consists of 38,230 unique tokens.
We are interested in words that become more popular or less popular in a certain time frame. In graphs showing relative word frequencies, such words can be identified by a period of a monotonically increas-ing or decreasincreas-ing frequency. Note that the total number words per year or month can vary. Therefore we do not use absolute frequencies (like: occurs 10 times per year) but relative frequencies (like: 10 divided by the total number of words of that year).
An example of the expected frequency graph for a new word can be found in Figure 1. In 1837-1866 the preferred spelling ofterecht(right) is different, so its frequency is close to zero. From 1866 the new spelling quickly gains popularity until 1871 when its relative frequency becomes more or less becomes stable. We define two mathematical methods for identifying such graphs.
The first method is a baseline which compares the final known relative frequency with the first known frequency. In principle we are looking for new words and obsolete words but we also want to find words 2The study on language usage in the magazine De Gids was funded by CLARIAH in the project CLARIAH-14-003 (Use
of which the frequency suddenly increased or decreased by a large margin. Therefore we do not require that the first frequency (new words) or the last frequency (obsolete words) is equal to zero. We will rank the words according the this function:
δ=log2 freqlast+ 0.5
n freqfirst+ 0.5
n
(1)
wherefreqfirst andfreqlast are the relative frequencies at the first and last time points, andnis the
number of words. Since the first frequency could be equal to zero for rising words and we do not want to divide by zero, we add a small number to each relative frequency: 0n.5 (add 0.5 smoothing, a variant of add one smoothing (Jurafsky and Martin, 2000))4. We name this measure delta score. When the final
frequency of a word is a lot higher than the first, the word is a good candidate for being a new word. When the reverse is true, the word has probably become obsolete. When we rank the words according from high to low delta score, the neologism candidates will appear on top of the list while the archaism candidates can be found at the bottom of the list.
The second method for finding new and obsolete words is based on correlation coefficients. We com-pute the correlation coefficients (r) of the relative frequencies of the words and time, and sort the words by this score:
freqavg = n1 X
t
freqt (2)
tavg = n1 X
t
t (3)
freq2sd= n1 X
t (freqt−freqavg)
2 (4)
t2
sd= n1 X
t
(t−tavg)2 (5)
r = 1nX
t
(freqt−freqavg)∗(t−tavg)
freqsd∗tsd (6)
Herefreqtis the relative frequency of a word at a certain time point (t) andnis the number of time
points. Words with a rising graph will correspond to anr value close to plus one while words with a descending graph will be assigned anrvalue close to minus one. After sorting the words byrvalue, we expect to find new words on the top of the list, and the obsolete words at the bottom.
Delta scores and correlation coefficients are used to rank the words of the two corpora. In order to deal with noise in the data, we perform four different variants of each experiment. In the standard variant, the relative frequencies of words per years are used unchanged. In the two other variants, the frequencies in the computations are the average over five neighboring years, eleven neighboring years and twenty one neighboring years (smoothing factors 5, 11 and 21). Averaging frequencies will remove random noise from the data and could make it easier for the two methods to identify frequency trends.
The two methods will be used to select candidate neologisms and archaisms from corpus data, which be presented to expert language users for further evaluation. For this purpose, we would like to know which of the two methods is better in selecting candidate neologisms and archaisms. Evaluating the methods is difficult since the required gold standard data are scarcely available. Van der Sijs (2001) published a list of 18,540 Dutch words with their first year of appearance, of which 6,612 are from the publication period of the magazine. However, none of the words are from the period of the tweets and for archaisms we do not have any background information. Furthermore, we do not expect many of the 6,612 neologisms of the list to be found in the magazine texts since they cover a restricted topic (literature).
Smoothing factors
Magazine text Tweets
Delta scores 1 5 11 21 1 5 11 21
Top 100 94% 88% 92% 96% 95% 96% 97% 97%
Bottom 100 92% 93% 93% 94% 97% 98% 99% 99%
Average 93% 91% 93% 95% 96% 97% 98% 98%
Correlation coefficients 1 5 11 21 1 5 11 21
Top 100 94% 94% 98% 94% 68% 81% 84% 86%
Bottom 100 93% 97% 100% 100% 90% 100% 100% 100%
[image:4.595.96.506.60.202.2]Average 93% 96% 99% 97% 79% 91% 92% 93%
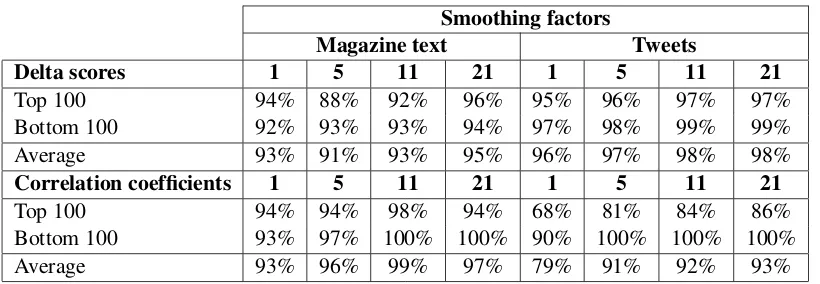
Table 1: Evaluation scores for the two ranking methods. The correlation coefficients perform best for magazine texts, with 99+% interesting words in the top-ranked 100 and bottom-ranked 100 for smoothing factor 11. Delta scores perform best for tweets, with a best average precision of 98% for smoothing factors 11 and 21.
Because of the lack of gold standard data, we have decided to evaluate the two methods by manu-ally inspecting the frequency graphs of the top-ranked words and the bottom-ranked words based on the scores assigned by each method. In this evaluation procedure, we look for words with a frequency distribution over time that could be interesting for examination by linguists. Here we only consider the frequency progression and do not use external knowledge about the history of the words. We regard words as interesting when there was a significant rise (300%+) or drop (75%+) in the relative frequency and when the relevant levels were reached for ten years (magazine text) or ten months (tweets). Words which were only popular during a very short time, corresponding with a frequency spike, are not consid-ered interesting (conform the endurance criterion of Metcalf (2002))5.
Apart from this quantitative evaluation, we will also perform a small qualitative analysis by comparing candidate neologisms from the magazine texts with the the Chronological Dictionary (van der Sijs, 2001) and by inspecting some of the candidate neologisms and candidate archaisms from the tweets.
4 Experiments
We looked for neologisms and archaisms in 169 editions of word unigram data of the Dutch literary magazineDe Gids (1837-2009; 4 missing editions) and in 68 months of word unigram data of Dutch tweets (January 2011-August 2016). We applied the two ranking methods described in the previous sec-tion in combinasec-tion with four smoothing strategies for the word frequencies: no smoothing (smoothing factor 1) and processing data in sets of five, eleven and twenty one adjacent years (smoothing factors 5, 11 and 21). For each ranking variant, we evaluated the results by inspecting the graphs associated with the top-ranked 100 words and those corresponding with the bottom-ranked 100 words. The evaluation results can be found in Table 1.
For magazine texts, correlation coefficients outperformed delta scores, with a best average precision score of 99% for smoothing factor 11. For tweets, delta scores proved to be better than correlation scores, reaching 98% average precision for smoothing factors 11 and 21. We compared the two top 100 and bottom 100 magazine word lists suggested by the methods and found an overlap of only 24%. Since the two methods suggest different words, they can be used in parallel.
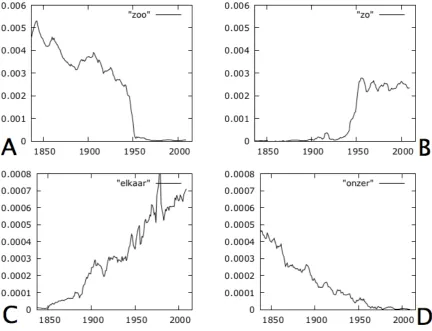
During the evaluation of the top and bottom lists of the ranking methods, we encountered the expected step function as shown in Figure 1. For all of the words with such a graph, the frequency progression was caused by a spelling reform. Figure 2 contains an example of this: the spelling of the wordzoo(so, Figure 2A) was changed tozo(Figure 2B) in the spelling reform of 1947 (Neijt, 1991).
Figure 2: Examples of frequency graphs of neologisms and archaisms found in the magazine texts. A: the wordzoo(so) was a common word in the magazine until its spelling was changed in 1947. B: the new spelling of the word: zo, frequent in the magazine texts since 1947. C: we found several words in the magazine texts of which the relative frequency had been rising for more than a hundred years: this is the graph for the wordelkaar(each other). D: we also found words for which the relative frequency had been decreasing for more than a hundred years, this is the graph foronzer(ours). Graphs have been drawn using data with smoothing factor 5.
magazine texts of which the frequency was rising for more than a century while for others the frequency decreased for over a hundred years before reaching zero. Two examples can be found in Figure 2: the neologismelkaar(each other, Figure 2C) and the archaismonzer(ours, Figure 2D).
We did not expect to find perpetually rising and falling words but these are exactly the frequency progressions that the correlation coefficients prefer. This means that the words which rise and fall within smaller time frames, have a smaller chance of appearing in the top and in the bottom of the ranking lists. In order to find these words, we modified the correlation coefficient method to check only a limited window of adjacent years. We checked three different window sizes: 10 years, 20 years and 30 years. Since the rise or fall of a word could start in any year, we checked all possible overlapping windows for each word (sliding window approach) and kept the highest and lowest window correlation score for comparison with other words.
Window size (yrs)
Correlation coefficients 10 20 30
Top 100 75% 77% 73%
Bottom 100 83% 78% 73%
[image:6.595.193.409.61.132.2]Average 79% 78% 73%
Table 2: Evaluation scores for the top 100 and bottom 100 words after ranking magazine words with correlation coefficients computed for sliding windows of 10, 20 and 30 years. The best performances were reached with a window size of 10 years.
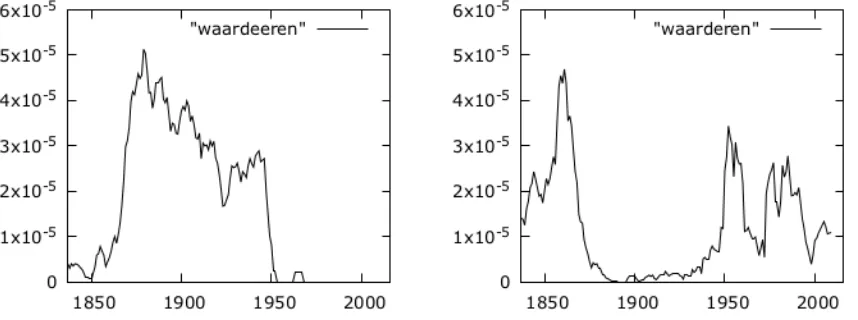
Figure 3: The sliding window approach found words which both rose and fell within the publication period of the magazine corpus: the use ofwaarderen (appreciate, right graph) was replaced by using
waardeeren(left graph) after the spelling reform of 1863. This decision was turned around in the spelling reform of 1947.
100 lists of the two methods proved to be complementary: they had only four words in common. This means the window approach can be used in combination with the non-window approach to achieve a larger coverage.
With the window approach, we found two more interesting groups of words. First, it found words that rose in popularity and then fell within the publication lifetime of the magazine, likewaardeeren
(appreciate), which gained popularity around 1870 but disappeared after 1950 (see the left graph in Figure 3). Next, we found words that fell and came back after a few decades. An example of such a word iswaarderen(appreciate, see Figure 3). It replaced the variant with three e’s after the spelling reform of 1947 (Neijt, 1991). Its disappearance around 1870 was most likely caused by the spelling reform which was started in 1863.
In 2001, Nicoline van der Sijs published a list of 18,540 words together with the first year that each of the words were observed in the Dutch language (van der Sijs, 2001). The time span of the word list is about 1500 years. We compared the top 100 magazine words suggested by the delta scores with smoothing factor 21 with this list. Only two of the suggested neologisms appeared in the list (po¨ezieand
zowel) but 25 more neologisms were inflections of words in the list. According the the years mentioned in the list, only three of the 27 words emerged during the life time of our magazine corpus. The word
culturelewas detected in the magazine nine years after its development in 1927. Interestingly enough
publiceerdeandpubliceertappeared in the magazine corpus five decades before the year mentioned in the list for their root form (publiceren, 1902). Although the precision of the delta scores in his comparison is low, these examples show that they can provide useful information for lexicographers.
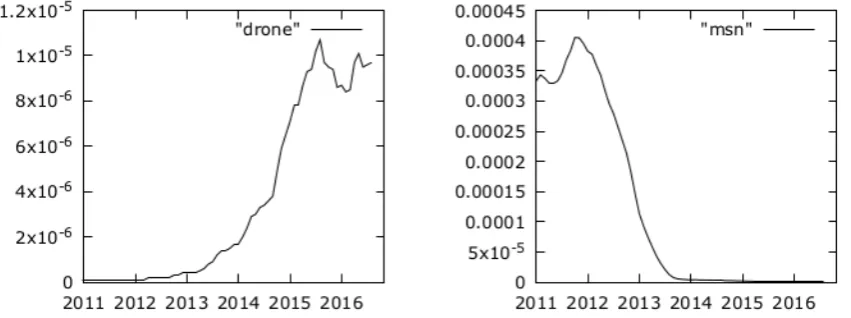
[image:6.595.86.515.207.367.2]Figure 4: Examples of candidate neologisms and archaisms found in in tweets.drone(unmanned aircraft) was infrequently used in Dutch tweets but has gained popularity since 2012. Messenger programMSN
was first renamed and then discontinued in 2012/2013.
and duplicate inflected forms) and presented 45 of the words to the author of the dictionary. We learned that the Chronological Dictionary was incomplete and that certain words like compounds had been left out on purpose. Many of the unseen words in the top 100 list turned out to be compounds, like for exampleaflopen(to end),hoogleraar(professor) andvrijwel(almost).
Inspection of top 100 tweet words suggested by the delta scores with smoothing factor 11 and win-dow size 10, produced several interesting neologisms:drone(Figure 4, left),emoji,jihadist,koningsdag
(King’s Day),matchfixing,onesie(jumpsuit),selfie,smartwatchandyolo. Nearly all of these are loan-words from English. The list also included some names of new companies that could be of interest for lexicographers: instagram, netflix, periscope snapchat, tinder, vine andwattpad. Brand names could also be found at the bottom of the list: the obsoletehyves(Dutch social network),msn(Figure 4, right) andxbox. The time span of the tweet corpus is too small to find archaisms. Most words in the bottom 100 were slang words which went out of fashion after teenagers left Dutch Twitter in the summer of 2013. 5 Concluding remarks
We have presented two different methods for finding rising and falling words in texts with time stamps: one based on comparing the initial and the final relative frequencies (named: delta scores), and one based on correlation coefficients of relative frequencies and time. We have applied the two techniques to 173 years of Dutch magazine text and 68 months of Dutch tweets. Both methods performed well, returning 90+% interesting words in the top-ranked and bottom-ranked 100. Smoothing the frequency scores improved the precision scores of the two methods with a few percent.
We also tested a variant of the correlation coefficients which assigned word scores based on data of sliding time windows. Here the best performance was reached with a window size of 10 years. We found that the highest and lowest ranked words of this window approach had only a small overlap with the highest and lowest ranked words of the non-window approach. This means that the methods can be used together for generating rising and falling words from time-stamped text corpora.
We have more appropriate historic text material that we would like to apply these techniques to. A challenge is that most of these digital texts have been produced by optical character recognition which means that they contain many misspelled words. Future work will reveal how well the ranking methods can deal with this type of data noise.
References
James Breen. 2009. Identification of Neologisms in Japanese by Corpus Analysis. InProceedings of eLexicogra-phy in the 21st century. Universit´e catholique de Louvin.
Hennie Brugman, Martin Reynaert, Nicoline van der Sijs, Ren´e van Stipriaan, Erik Tjong Kim Sang, and Antal van den Bosch. 2016. Nederlab: Towards a Single Portal and Research Environment for Diachronic Dutch Text Corpora. InProceedings of LREC 2016. ELRA, Portoroz, Slovenia.
Lyle Campbell. 1998. Historical Linguistics: An Introduction. Edinburgh University Press, United Kingdom. Costin-Gabriel Chiru and Traian Eugen Rebedea. 2014. Archaisms and neologisms identification in texts. In
2014 RoEduNet Conference 13th Edition: Networking in Education and Research Joint Event RENAM 8th Conference. IEEE.
C. Paul Cook. 2010. Exploiting Linguistic Knowledge to Infer Properties of Neologisms. PhD thesis, University of Toronto, Canada.
Jacob Eisenstein, Brendan O’Connor, Noah A. Smith, and Eric P. Xing. 2012. Mapping the geographical diffusion of new words. InProceedings of the NIPS Workshop on Social Network and Social Media Analysis: Methods, Models and Applications. Lake Tahoe, Nevada.
William A. Gale and Geoffrey Sampson. 1995. Good-Turing frequency estimation without tears. Journal of Quantitative Linguistics, 3:217–237.
Daniel Jurafsky and James H. Martin. 2000.Speech and Natural Language Processing. Prentice Hall.
Daniel Kershaw, Matthew Rowe, and Patrick Stacey. 2016. Towards Modelling Language Innovation Acceptance in Online Social Networks. InProceedings of the Ninth ACM International Conference on Web Search and Data Mining (WSDM ’16). ACM, San Francisco, CA, USA.
Vivek Kulkarni, Rami Al-Rfou, Bryan Perozzi, and Steven Skiena. 2015. Statistically Significant Detection of Linguistic Change. InProceedings of the 24th World Wide Web Conference, pages 625–635. ACM, Florence, Italy.
JeyHan Lau, Nigel Collier, and Timothy Baldwin. 2012. On-line Trend Analysis with Topic Models: #twitter trends detection topic model online. InProceedings of Coling 2012, pages 1519–1534. Mumbai, India. Karine Megerdoomian and Ali Hadjarian. 2010. Mining and Classification of Neologisms in Persian Blogs. In
Proceedings of the NAACL HLT 2010 Second Workshop on Computational Approaches to Linguistic Creativity. ACL, Los Angeles, CA.
Allan Metcalf. 2002. Predicting New Words: The Secrets of Their Success. Houghton Mifflin Company, Boston, USA.
Jean-Baptiste Michel, Yuan Kui Shen, Aviva Presser Aiden, Adrian Veres, Matthew K. Gray, The Google Books Team, Joseph P. Pickett, Dale Hoiberg, Dan Clancy, Peter Norvig, Jon Orwant, Steven Pinker, Martin A. Nowak, and Erez Lieberman Aiden. 2011. Quantitative analysis of culture using millions of digitized books. Science, 331:176–182.
Anneke Neijt. 1991.Universele fonologie. Floris Publications, Dordrecht. (In Dutch).
Rutch O’Donovan and Mary O’Neill. 2008. A Systematic Approach to the Selection of Neologisms for Inclusion in a Large Monlingual Dictionary. InProceedings of the XIII euralex International Congress, pages 571–579. Institut Universitari de Ling¨u`ıstica Aplicada, Barcelona, Spain.
Piotr Paryzek. 2008. Comparison of selected methods for the retrieval of neologisms. InInvestigationes Linguis-ticae, volume XVI. Poznan.
Erik Tjong Kim Sang and Antal van den Bosch. 2013. Dealing with Big Data: the Case of Twitter. Computational Linguistics in the Netherlands Journal, 3:121–134. ISSN: 2211-4009.
R.L. Trask. 1994.Language Change. Routledge, Oxon, United Kingdom.
Nicoline van der Sijs. 2001. Chronologisch woordenboek: De ouderdom en herkomst van onze woorden en betekenissen. Veen, Amsterdam/Antwerpen.
Derry Tanti Wijaya and Reyyan Yeniterzi. 2011. Understanding Semantic Change of Words Over Centuries. In