For Review Only
Optimisation of tower site locations for camera-based
wildfire detection systems
Journal: International Journal of Wildland Fire
Manuscript ID WF18196.R1
Manuscript Type: Research Paper
Date Submitted by the
Author: 15-May-2019
Complete List of Authors: Heyns, Andries; University of Pretoria du Plessis, Warren; University of Pretoria
Kosch, Michael; South African National Space Agency Hough, Gavin; EnviroVision Solutions
For Review Only
For Review Only
Optimisation of tower site locations for
camera-based wildfire detection systems
Andries Heynsa,b,c,∗, Warren du Plessisc, Michael Koschd,e,f,g, Gavin Houghg aDST-NRF Centre of Excellence in Mathematical and Statistical Sciences (CoE-MaSS)
bLaboratory for Location Science, Department of Geography, University of Alabama, Tuscaloosa, AL, USA cUniversity of Pretoria, Pretoria, South Africa
dSouth African National Space Agency, Hermanus, South Africa eDepartment of Physics, Lancaster University, Lancaster, UK
fUniversity of Western Cape, Bellville, South Africa gEnviroVision Solutions, Durban, South Africa
Abstract
Early forest fire detection can effectively be achieved by systems of specialised tower-mounted cameras. With the aim of maximising system visibility of smoke above a prescribed region, the process of selecting multiple tower sites from a large number of potential site locations is a complex combinatorial optimisation problem. Historically, these systems have been planned by foresters and locals with intimate knowledge of the terrain rather than by computational optimisation tools. When entering vast new territories, however, such knowledge and expertise may not be available to system planners. A tower site-selection optimisation framework which may be used in such circumstances is described in this paper. Metaheuristics are used to determine candidate site layouts for an area in the Nelspruit region in South Africa currently monitored by the ForestWatch detection system. Visibility cover superior to that of the existing system in the region is achieved and are obtained in a number of days, while traditional approaches normally require months of speculation and planning. Following the results presented here, the optimisation framework is earmarked for use in future ForestWatch system planning.
Keywords: Fire detection, maximal cover, optimisation, facility location, NSGA-II
Background 1
Wildfires, when left untreated and under the right conditions, can spread rapidly and go on to cause 2
enormous destruction to rural and urban landscapes. The early detection of their onset is of critical im-3
portance – the sooner suppressing action can be taken, the more manageable the size of the fire may be, 4
potentially allowing minimisation of the scale of destruction (Rego and Catry, 2006). Camera-based wildfire 5
detection systems (CWDSs) provide early detection in the form of a number of specialised cameras that 6
monitor the surrounding environment (Martell, 2015). The research presented here has been conducted in 7
collaboration with EnviroVision Solutions, which operates the South African-developed ForestWatch CWDS 8
in South Africa, Australia, Spain, Canada and the USA.1 ForestWatch CWDSs monitor the surrounding
9
environment for smoke using a proprietary pattern-recognition algorithm which is based upon South African 10
Antarctic research into the automated detection of aurora (Hough, 2007). Once smoke is detected, human 11
operators at dedicated workstations – located at detection centres of local fire protection agencies – are 12
alerted in order to validate fires and send out detection reports. The location of a fire is estimated by 13
∗Corresponding author, contactable at [email protected]
1The corresponding author is not affiliated with EnviroVision Solutions, but has served as a volunteer fire fighter during multiple wildfires in the South African Western Cape and has a keen interest in fire detection and prevention.
For Review Only
(a) (b)
Figure 1: (a) Camera used in ForestWatch fire detection systems; (b) a 32-m tower on top of which a camera is placed, with the solar power supply visible near the base of the tower.
triangulation if the smoke is visible from two or more cameras, or from the location of the smoke within an 14
image when only visible from one camera (Matthews et al., 2012). 15
Figure 1(a) shows a typical camera, while a 32-m tower with a camera mounted on top is displayed 16
in Figure 1(b). Terrain features and vegetation growth cause varying degrees of obstruction between the 17
cameras in a CWDS and possible smoke plumes, as seen in Figure 2. The towers are therefore typically 18
placed at elevated sites which have good visibility of their surroundings,e.g. peaks on mountains and hills. 19
Cost considerations mean that potential sites that offer good visibility will generally far outnumber the 20
camera towers available for placement. The challenge is therefore to identify at which sites to place the 21
towers. This is an intricate process, since the overall system detection potential relies on more than simply 22
identifying a number of sites according to their individual visibility cover, but rather the identification of a 23
combination of sites that offer the bestcombined system visibility cover. 24
Literature on the topic of candidate site identification intended for CWDS purposes is scarce – two recent 25
publications, however, demonstrate typical approaches that may be followed. Bao et al. (2015) followed an 26
approach in which thirty candidate sites were manually identified from peaks and ridges on hilltops within 27
a relatively small study area of 10 km2. Candidate layouts were then determined from the thirty sites 28
for CWDSs comprising between six and sixteen towers, using integer programming (Newman and Weiss, 29
2013) and a genetic algorithm similar to the one employed later in this paper. The manual site selection 30
approach followed by Bao et al. (2015) is not considered desirable here, as it would be impractically laborious 31
and time-consuming for the intended application considered here. The average ForestWatch system covers 32
surface areas of well over 1 000 km2 which contain numerous mountains, hills and ridges that may be
33
considered for tower placement – significantly larger and more complex than the area considered by Bao 34
et al. (2015). The manual candidate site identification and evaluation process took over five months for 35
the existing ForestWatch system considered below which monitors an area of 1 505 km2. Shortening the
36
duration of such processes to allow wildfire detection systems to become active earlier is a driving factor 37
behind ForestWatch’s interest in optimisation methods. 38
The second candidate site identification approach was proposed by Eugenio et al. (2016) using Geo-39
For Review Only
[image:5.595.68.532.116.262.2](a) (b)
Figure 2: Fires detected by the ForestWatch CWDS, displaying typical visibility obstruction that may be caused by (a) terrain, and (b) vegetation.
covering 46 000 km2. GIS processes were used to identify land within feasible geographical and
adminis-41
trative/municipal boundaries, while terrain feature classification analyses were used to identify ridges on 42
mountains and hills. Areas on the terrain that were within suitable distances of roads were also identified. 43
The area that satisfied all three criteria of feasible land, ridge features, and suitable road access areas resulted 44
in a final feasible terrain surface which was considered for watchtower placement. The study area was then 45
sub-divided into uniform square cells of 15×15 km and the feasible site with the highest altitude in each 46
cell was specified as a watchtower site. This method of site identification offers a relatively simple method 47
of identifying multiple sites across a very large surface area. The disadvantage of such an approach is that 48
the sites are identified according to the expected visibility of each individual watchtower, based upon terrain 49
features and altitude. This may yield good individual tower visibility, but neither considers nor guarantees 50
good overall system cover (Franklin and Clark, 1994; Rana, 2003; Kim et al., 2004). 51
The standard approach in similar surveillance/detection research is to evaluate a system’s detection 52
potential with respect to the terrain surface only (Franklin, 2002; Kim et al., 2004; Bao et al., 2015). 53
However, ForestWatch systems detect smoke patterns above the terrain surface (Schroeder, 2005; Hough, 54
2007), and as the smoke rises, it typically needs to clear interference from terrain and vegetation to be 55
detectable as shown in Figure 2. The lower above the terrain surface a smoke plume may be detected, the 56
sooner an alert may be generated and suppressing action initiated. A CWDS’s potential for detecting smoke 57
atmultiplelevels above the terrain surface therefore plays a role in gauging its effectiveness for near-surface 58
(early) and higher (secondary) smoke detection. CWDSs may also be configured with consideration given 59
to their visibility cover achieved over buffer zones which extend coverage beyond the client boundaries. This 60
is because external fires may well encroach onto the client area, meaning that external fires are also crucial 61
to monitor. Two smoke detection heights and a buffer zone are considered in the evaluation of candidate 62
system layouts here, resulting in a coverage maximisation problem with two objectives. ForestWatch have 63
also expressed their intention to incorporate additional objectives in future work, including the maximisation 64
of backup (overlapping) cover (Hogan and Revelle, 1986; Heyns and van Vuuren, 2016), the maximisation 65
of their towers’ triangulation accuracy in determining fire locations, and cost minimisation. As a result, 66
the process of configuring CWDS layouts becomes a complex Multi-Objective combinatorial optimisation 67
problem, for which recent novel approaches are necessary (Heyns, 2016). 68
The first steps taken towards a comprehensive CWDS tower-site selection optimisation framework are 69
presented. The main aim was to provide an approach capable of determining multiple, high-quality CWDS 70
layouts within practical computation times. Multiple candidate layouts allow decision makers to evaluate the 71
trade-offs between different layouts when selecting a final solution. An area in the Nelspruit region in South 72
Africa, which is currently covered by an existing ForestWatch CWDS, was used as the study area, and the 73
optimisation framework was used to compute CWDS layouts comprising twenty cameras. A Multi-Objective 74
Evolutionary Algorithm (Cheshmehgaz et al., 2015) combined with a multi-resolution approach (Heyns and 75
For Review Only
van Vuuren, 2016) is proposed for the optimisation of CWDS layouts. This algorithm considers areas that 76
are deemed feasible for tower placement, which are determined by terrain characteristics and proximity to 77
features such as roads. The quality of the generated CWDS layouts is determined by evaluating the coverage 78
of two smoke layer heights over primary and buffer zones. The outputs included multiple candidate CWDS 79
configurations and visibility coverage maps which may be analysed by decision makers before a final layout 80
is selected. 81
Methods 82
Study area and existing tower sites
83
In order to demonstrate the practicality and effectiveness of this research for future tower site-selection 84
problems, a comparative platform had to be established for evaluation purposes. An existing CWDS of 85
twenty six cameras was identified by ForestWatch experts for this purpose. This CWDS is located in the 86
vicinity of Nelspruit, in the north-east of South Africa, and monitors forestry plantations. This specific 87
system was selected because of its mountainous and challenging terrain (see Figure 2) and because the 88
existing CWDS is reliable and regularly detects potential fires on a daily basis. In 2017 alone, the system 89
logged 2 786 alerts within the subscribed client area, and many more outside.2 Wildfires in the region
90
occur primarily between July and October (Strydom and Savage, 2016), with the most recent large wildfire 91
occurring in August 2016 and destroying over 2 500 hectares of plantations and natural forests. An additional 92
reason for the selection of this CWDS as a basis for comparison was that experts with extensive experience 93
in the region were available for feedback and discussions. 94
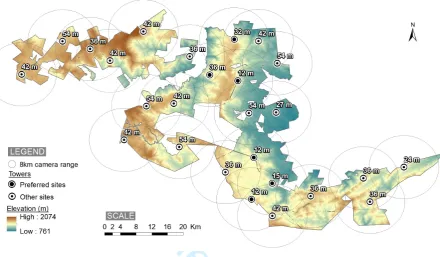
The client area is non-contiguous and covers a surface area of approximately 1 505 km2. The cameras have 95
a specified detection range of 8 km and are placed on towers that range in height from 12 m to 54 m at the 96
locations shown in Figure 3.3 The planning of the existing CWDS layout was a collaborative effort between 97
ForestWatch technicians, GIS managers from the forestry clients, and local experts. Numerous potential 98
sites were manually identified over five months in 2010, and this was followed by physical inspections to 99
assess the sites according to their distance from power lines, access to roads, and site security (vandalism 100
and theft are common in the region). Six of the sites were easier to select than the others and are indicated 101
as “preferred sites” in Figure 3. These are the sites of old watchtowers and were selected without need for 102
deliberation because of the existing infrastructure, road access and historically proven visibility cover. The 103
remaining twenty sites required further investigation, analysis and comparison with other sites in terms of 104
the aforementioned criteria and predicted coverage potential. 105
The base tower structure height that was used by ForestWatch for this system is 12 m. However, 106
extensions to base tower heights are often added because an increase in tower height improves overall smoke 107
detection potential by allowing a camera to see over obstructions. When required, height increases were 108
achieved by adding extensions to the base structure, generally in increments of 3 m. The requirement for an 109
increase in tower height at each site depended on a) whether surrounding vegetation demanded an increase 110
in tower height so that the camera could rise above the trees’ canopy, b) the actual need for an increase 111
in tower height, depending on client coverage already achieved from the base tower height, and c) whether 112
the terrain could accommodate the demands of an increase in structure size and support (in terms of the 113
tower foundation and stabilisation wires that increase in span as tower height increases). The criterion of 114
proximity to power supplies was eventually dismissed, and solar power supplies were installed at all sites 115
due to an inconsistent power supply system in the region (a solar power supply can be seen in Figure 1(b)). 116
Terrain modelling and viewshed analyses
117
Raster data represent the earth’s surface and geospatial information as uniformly spaced sample points 118
across the terrain and are used for both the terrain model and candidate site selection in this paper. Raster 119
2While many of these fires are authorised prescribed burns or smoke rising from informal settlements on the edges of the client area, fires that are actual threats are also regularly detected.
For Review Only
Figure 3: Top view in relief of the ForestWatch system and client area that was identified to provide a benchmark for the evaluation of the optimisation approach followed in this paper.
data are employed extensively for solving facility location problems due to their simplicity and ease of 120
implementation (Franklin, 2002; Kim et al., 2004; Tanerg¨ucl¨u et al., 2010; Kwong et al., 2014; Heyns and 121
Van Vuuren, 2015). 122
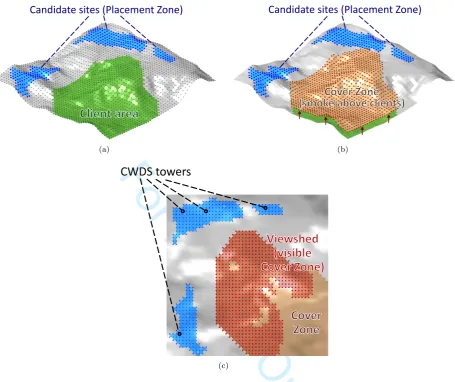
An example of a raster data representation of terrain is provided in Figure 4(a). The non-contiguous 123
blue area in the figure is an example of terrain that has been identified as suitable for the placement of 124
towers after the identification of feasible placement regions. The green area is an example of an area of 125
interest, which in this paper, is typically land belonging to one or more forestry clients. The terrain surface 126
in this figure is, in fact, generated from sampled (raster) elevation data with the dots being on the terrain 127
surface. The distance between neighbouring sample points is approximately 30 m at the highest resolution 128
of raster data that is typically available to the public. The sites within the area that may be considered for 129
facility placement (the blue dots) collectively form what is referred to as the Placement Zone. 130
The CWDS’s detection potential is determined with respect to smoke above the terrain surface that 131
falls within the client and buffer boundaries. As mentioned above, this process is performed with respect to 132
multiple smoke heights, and each specified smoke detection height can be depicted as a smoke layer following 133
the contour of the terrain. The smoke layers and their associated boundaries are termed Cover Zones, i.e.
134
areas with respect to which a CWDS’s visibility cover is determined. As is the case for the Placement Zone, 135
Cover Zones are represented by raster data and are the rasterised terrain surface that falls within client 136
and buffer boundaries raised to specified heights, as illustrated in Figure 4(b) for a Cover Zone (the brown 137
surface and markers) above the client area. 138
The portion of a Cover Zone that is visible from a camera is referred to as aviewshed, and is computed 139
from a collection of line-of-sight queries calculated between the camera and all the demand points within the 140
Cover Zone, limited by terrain interference and the camera’s detection range (Nagy, 1994; Franklin, 2002; 141
Kim et al., 2004). A CWDS’s viewshed of a Cover Zone is then the merged viewsheds of all the individual 142
cameras in the system with respect to the Cover Zone –i.e. the demand points in the Cover Zone that are 143
visible from at least one camera in the system. Figure 4(c) provides a top view of the terrain discussed in 144
Figures 4(a) and (b), and an example of a CWDS viewshed (the red surface and markers) achieved by an 145
For Review Only
Client area
Candidate sites (Placement Zone)
(a)
Candidate sites (Placement Zone)
Cover Zone
(smoke above clients)
(b)
CWDS towers
Viewshed
(visible
Cover Zone)
Cover
Zone
[image:8.595.72.528.114.496.2](c)
Figure 4: Raster data represent the earth’s surface as uniformly spaced sample points. (a) Raster representation of a terrain surface with a Placement Zone and client area; (b) raster representation of a Cover Zone above the client area; (c) top view of the terrain, displaying an example CWDS tower layout (the black markers) and its viewshed achieved with respect to the Cover Zone (the red area and markers).
example tower site layout for a system with four cameras (the black markers). 146
Placement Zone specification
147
The basic criterion to consider in the process of identifying a feasible Placement Zone is that towers may 148
only be placed at sites within the client area because properties outside this area belong to entities that do 149
not collaborate with ForestWatch. Two additional geospatial criteria were identified by ForestWatch experts 150
as vital in determining site suitability. First, only terrain with a degree of slope under 12°(or 20%) should 151
be considered to ensure that tower installation may be performed without the need for excessive terrain 152
alteration, in addition to ease of access on foot. Second, a distance of 100 m or less to roads is deemed 153
necessary for transportation (e.g.construction and maintenance) and general access purposes. Selecting the 154
candidate sites according to criteria such as altitude and terrain features, as proposed by Eugenio et al. 155
(2016), would reduce the number of sites in the Placement Zone. However, there is a risk that high-quality 156
For Review Only
(a) (b)
[image:9.595.68.523.114.537.2](c)
Figure 5: Determination of the feasible Placement Zone within the client area. (a) Terrain degree of slope under 12°; (b) within 100 m of roads; (c) Placement Zone, where both slope and road access are feasible.
The commercially available ArcGIS 10.5.1 software4was used to process the data required to determine
158
suitable sites according to slope and road access. Feasible slope sites were determined with 30 m resolution 159
raster elevation data and the ArcGIS slope tool, while road-accessible sites were determined with roads data 160
obtained from the clients in the study area and the ArcGIS Euclidean distance analysis tool. The feasible 161
slope and road access areas are displayed in Figures 5(a) and (b), respectively, and Figure 5(c) shows the 162
resulting Placement Zone where both slope and road access are feasible. The number of candidate sites 163
from the raster representation of the Placement Zone totals 741 813. The locations of the 26 towers of the 164
existing system are all placed at sites in the feasible Placement Zone, indicating that the feasibility criteria 165
considered here are indeed realistic. 166
4Developed by Environmental Systems Research Institute (ESRI), www.esri.com.
For Review Only
[image:10.595.77.525.123.248.2](a) (b)
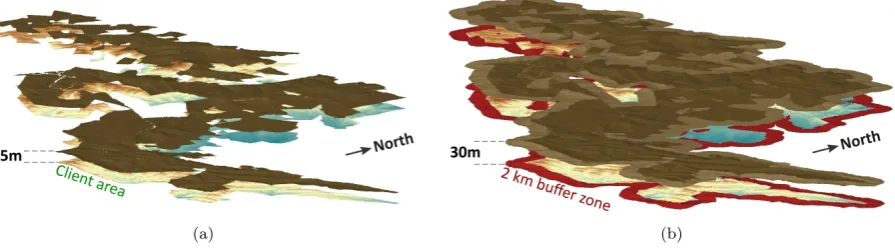
Figure 6: Client area and smoke layers viewed in perspective from the south-east, showing (a) 15-m and (b) 30-m smoke layers above the client area with a 2-km buffer zone being included in (b).
System evaluation
167
Two smoke layer heights were agreed upon for the evaluation of the benchmark and optimisation systems: 168
15 m and 30 m.5 An illustration of the client area viewed in perspective from the south-east, with a 15-m
169
smoke layer which follows the contours of the terrain, is provided in Figure 6(a). The smoke layer’s actual 170
height above the terrain surface is exaggerated for illustrative purposes. The purpose of the 15-m smoke 171
layer is for near-immediate detection above the client area and is aimed at rapid response. 172
The 30-m smoke layer is shown in Figure 6(b) and includes a 2-km buffer zone which extends beyond the 173
client area. The purpose of this smoke layer is for the detection of smoke that may not have been visible at 174
15 m above the client area due to obstructions, and which has risen further to clear the obstructions to be 175
(potentially) visible at 30 m. Furthermore, the buffer zone added to the smoke layer allows monitoring of 176
the progress of fires outside the client area – fires which need to be monitored by ForestWatch, but which 177
do not necessarily require client response if their properties are not under immediate threat. 178
It was made clear by ForestWatch experts that the towers placed at the six existing sites (indicated by 179
full markers in Figure 3) were non-negotiable in the original site-selection process. It was decided to follow 180
a similar approach during the optimisation process, so these six towers were considered as “existing” and 181
included in all developed CWDSs by default. This approach mimics a scenario that is frequently encountered, 182
where new towers are to be sited around existing towers to expand an existing system’s coverage over new 183
clients or blind spots, for example. The actual tower site selection process thus focused on selecting the sites 184
for the remaining twenty towers. 185
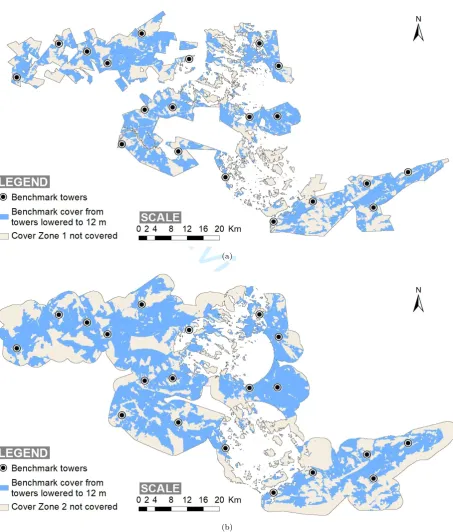
The six existing towers and the coverage they achieve with respect to the smoke layers are shown in 186
Figures 7(a) and (b). Since the indicated areas are already visible to these towers and are thus covered, the 187
placement of additional towers does not require coverage of these areas. The remaining uncovered areas of 188
the smoke layers, shown in Figures 7(c) and (d), are then the Cover Zones used to evaluate the coverage of 189
the remaining 20 towers – Cover Zone 1 (15-m smoke height) and Cover Zone 2 (30-m smoke height with a 190
2-km buffer). The aim of the study was therefore to use an optimisation approach to determine new CWDS 191
layouts and to compare their coverage to that of the tower sites of the existing CWDS. 192
The optimisation process followed here focuses on initial, computational site selection and does not 193
include the physical site inspection process where height added to that of the base tower height is considered. 194
This means that only the base tower height of 12 m is considered during the optimisation process, and 195
viewsheds are therefore determined from this observer height above the terrain surface. In order to provide 196
a fair comparative platform, the benchmark cover achieved by the existing towers is determined at simulated 197
tower heights of 12 m with respect to the Cover Zones. Under this assumption, the existing towers were 198
determined as being able to see 56.0% of the demand points in Cover Zone 1 and 54.6% of those in Cover 199
For Review Only
(a) (b)
[image:11.595.66.527.118.402.2](c) (d)
Figure 7: The process followed to determine the Cover Zones used for system evaluation in this paper. Cover achieved from six existing towers (determined at a detection range of 8 km and their actual heights) that are included in the optimisation approach are shown with respect to (a) a 15 m smoke layer, and (b) a 30 m smoke layer with a 2 km buffer. This cover is removed from the smoke layers and result in (c) Cover Zone 1, and (d) Cover Zone 2.
Zone 2, as shown in Figure 8 (the demand points in the Cover Zones are spaced at the same raster resolution 200
as that of the Placement Zone, namely 30 m). For reference, the twenty towers at their actual heights (an 201
average of 42 m) achieve 64.5% and 61.1% coverage with respect to Cover Zones 1 and 2, respectively. 202
Optimisation approach
203
A candidate CWDS layout is evaluated by objective functions – mathematical functions which calculate 204
the performance of the layout with respect to each of the objectives. Here, the candidate CWDS layouts 205
are evaluated with respect to the percentage of points in each Cover Zone which are visible. The results 206
correspond to a single point inobjective function space, as is illustrated in Figure 9 in which a number of 207
candidate layouts (candidate solutions) have been evaluated. Figure 9 considers a problem instance involving 208
two Cover Zones, which correspond to the two objectives on the axes. In multi-objective optimisation, the 209
solutions in Figure 9 are classified as eithernon-dominated ordominated. 210
When comparing the non-dominated solutions in Figure 9 to each other, moving from one solution to 211
another results in an improvement in at least one objective, but the degradation in at least one other 212
objective. No non-dominated solution is better than another with respect toall the objectives. The inferior 213
solutions that are not included in the non-dominated set are said to bedominated by the non-dominated 214
solutions because at least one non-dominated solution that is better with respect toall the objectives exists 215
for each dominated solution. The non-dominated solutions are sought for decision-making purposes because 216
they offer superior objective function values and trade-off alternatives to those of the dominated solutions. 217
The representation of the set of non-dominated solutions is commonly known as thePareto-optimal front, 218
or simply thePareto front, as they form a frontier in multi-objective space as seen in Figure 9 (Zitzler et al., 219
For Review Only
(a)
[image:12.595.70.524.138.671.2](b)
For Review Only
Figure 9: The notions of solution domination and of a Pareto front in objective function space.
2004; Knowles et al., 2006). Decision makers need only consider solutions on the Pareto front due to the 220
superiority of these solutions. 221
One approach to obtaining approximate solutions on the Pareto front is the use of commercial software, 222
such as CPLEX6, and open-source software, such as Gurobi7. These software packages take Integer-Linear
223
Programming formulations of the objective functions and constraints as input. Solving multi-objective 224
problems with these packages requires transforming the multiple objective functions into a single objective 225
function using a weighted sum (Cohon, 1978; Murray et al., 2007). The weighted-sum objective functionOs
226
is given by 227
Os= X
i
wiOi (1)
where the objectivesOi are combined using weightswi. By varying the objective weights in multiple runs,
228
a Pareto-front approximation may be traced out. However, determining points on the Pareto front in this 229
manner may require a prohibitively large number of weight combinations when many objectives and large 230
solution spaces are considered (ReVelle and Eiselt, 2005; Tong et al., 2009). The solution space is the set of 231
all possible solutions to a problem,i.e.all the possible candidate CWDS layouts on the terrain. The number 232
of possible solutions (Np) is
233
Np=
N
s
Nt
= Ns!
Nt!(Ns−Nt)!
(2)
where Nt and Ns denote the number of towers available for placement and the number of feasible sites,
234
respectively. Here, 20 tower sites have to be selected from 741 813 sites in the Placement Zone of Figure 5(c) 235
– a solution space that is sufficiently large to render the use of the weighted-sum approach infeasible. 236
Instead of the weighted-sum approach, powerful metaheuristic optimisation procedures are often em-237
ployed in order to approximate the Pareto front within realistic computation times (Zitzler et al., 2004; 238
Tong et al., 2009). Multi-Objective Evolutionary Algorithms are popular for this purpose and are able to 239
approximate the Pareto front in a single run (Fonseca and Fleming, 1993; Purshouse and Fleming, 2003). 240
The Non-dominated Sorting Genetic Algorithm-II (NSGA-II) is a Multi-Objective Evolutionary Algorithm 241
that has been used extensively in the literature for multi-objective optimisation problems (including applica-242
tions that consider covering problems) (Raisanen and Whitaker, 2005; Kim et al., 2008; Kwong et al., 2014; 243
6www.ibm.com/analytics/cplex-optimizer 7www.gurobi.com
For Review Only
System op�misa�on
NSGA-II
Increase resolu�on
System op�misa�on
NSGA-II
Reduce resolu�on
82 547 feasible sites
GIS Component
Op�misa�on component
(Mul�-resolu�on approach)Weaker quality candidate system
layouts
Approximately Pareto-op�mal candidate system
layouts
Placement Zone
741 813 feasible sites
[image:14.595.64.529.120.238.2]Cover Zones
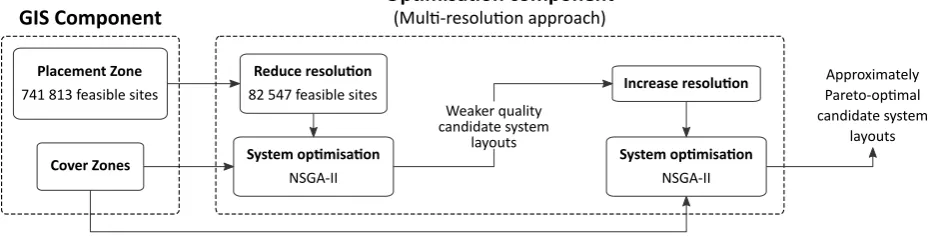
Figure 10: The CWDS tower site-selection optimisation framework followed in this paper.
Heyns and van Vuuren, 2016, 2018) and was employed in this paper. More information on Multi-Objective 244
Evolutionary Algorithms and the NSGA-II may be found in the Appendix. 245
At the highest resolution of terrain data representation (30 m spacing), the number of feasible sites in the 246
Placement Zone of Figure 5(c) is 741 813. This is significantly more than is generally encountered in facility 247
location problems (Kim et al., 2004, 2008; Tanerg¨ucl¨u et al., 2010; Bao et al., 2015), mainly because manual 248
intervention to reduce the number of possible sites is impractical for the terrain sizes for which this research 249
is intended. This large number of feasible sites increases the computational complexity of the algorithm by 250
increasing the number of possible CWDS layouts. In instances such as these, the Multi-Resolution Approach 251
of Heyns and van Vuuren (2016) may be employed. The Multi-Resolution Approach is an optimisation 252
tool which was specifically developed for geospatial facility location problems with unusually large solution 253
spaces. The approach reduces the number of sites considered during the search for the Pareto front by 254
first solving the problem at a coarse geographic resolution for site selection (exploration), after which a 255
finer resolution is used around promising site locations and the optimisation process repeated (exploitation). 256
This results in reduced computational complexity, fewer viewshed computations, and reduced computation 257
time requirements (Heyns and van Vuuren, 2016). Implementation of the Multi-Resolution Approach results 258
in little or no reduction in the quality of solution in the Pareto-front approximation, and can even lead to 259
improved quality in some instances (Heyns, 2016; Heyns and van Vuuren, 2016). Pseudo-code descriptions of 260
the NSGA-II and its Multi-Resolution Approach implementation are available in the literature (Kim et al., 261
2008; Heyns and van Vuuren, 2016). 262
The proposed site-selection optimisation framework is summarised graphically in Figure 10, and is divided 263
into a GIS component and an optimisation component. The GIS component comprises a) the identification 264
of suitable candidate sites within the Placement Zone, and b) the determination of the Cover Zones, based 265
upon smoke layer heights, buffer zones, and existing cover. The Placement Zones and Cover Zones are the 266
inputs to the optimisation component which performs two runs of the NSGA-II – the difference in each run 267
being the candidate site inputs as determined by the Multi-Resolution Approach. Here, the first NSGA-II 268
run takes as input sites which are extracted from the original Placement Zone at a resolution of 90 m between 269
sites (from the original 30 m resolution), resulting in 82 547 candidate sites. The second NSGA-II run takes 270
as input the sites included in the candidate layouts returned by the first NSGA-II run, as well as all the 271
feasible sites at the original, highest 30 m resolution, that are within 60 m of the these sites. 272
Due to the stochastic nature of the Pareto-front approximation process of the NSGA-II (see Appendix), 273
the solutions returned by different optimisation runs generally vary in quality, and it is therefore standard 274
practice to repeat the process multiple times (Knowles et al., 2006; Kim et al., 2008; Tong et al., 2009). 275
The results of all the runs are then combined and a final attainment front (the globally best set of the 276
approximately Pareto-optimal solutions from all optimisation runs) is identified. The process in Figure 10 277
For Review Only
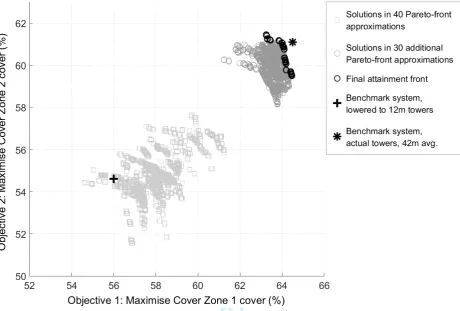
Figure 11: Results in objective function space of multiple runs of the optimisation framework in Figure 10, in which the objective was to place twenty towers at sites within the Placement Zone in Figure 5(c), so that visibility cover with respect to the Cover Zones in Figures 7(c) and (d) is maximised.
Results 279
Pareto-front approximation
280
The forty Pareto-front approximation generated by the framework in Figure 10 produced a total of 281
1 818 unique solutions, which are shown by the grey squares in objective function space in Figure 11. It is 282
observed that the benchmark CWDS, evaluated with 12-m towers and indicated by the black cross marker, 283
is outperformed in at least one objective by most of the optimisation-determined solutions, while being 284
outperformed in both objectives (i.e. dominated) by a large number of these solutions. 285
Upon closer inspection, it was revealed that the solutions returned by the forty optimisation runs are, in 286
fact, unique combinations of 917 sites (which mostly neighbour other sites), which are shown in Figure 12(a). 287
Since these sites are included in multiple Pareto-optimal solution approximations, it may be assumed with 288
confidence that they are higher-quality candidate sites than the other sites in the entire original Placement 289
Zone of 741 813 sites. It was therefore decided to investigate the use of these 917 sites as a new Placement 290
Zone for thirty additional optimisation runs – thereby excluding a large number of weaker sites that were 291
considered in the forty initial optimisation runs, and as a result, limiting the search to better sites only. 292
These sites were considered as a single level by the NSGA-II and without multi-resolution optimisation. 293
The 1 219 solutions which were contained in the resulting Pareto-front approximations are shown by the 294
grey circles in Figure 11 – achieving a marked improvement over the solutions returned by the first forty 295
Pareto-front approximations (the grey squares). The final attainment front contained 72 solutions, which 296
are indicated by black circle markers in Figure 11. When compared to the benchmark network with 12 m 297
towers, the solutions contained within the final attainment front exhibit an increase in cover of up to 8.5% 298
For Review Only
[image:16.595.69.524.116.246.2](a) (b)
Figure 12: Sites included in (a) the solutions in forty Pareto-front approximations obtained by the framework in Figure 10, and (b) the solutions in the final attainment front in Figure 11 obtained by additional optimisation runs.
with respect to Cover Zone 1, while an increase of up to 6.9% is observed with respect to Cover Zone 2. 299
Most impressive is that these solutions achieve objective-function values that are similar to those achieved 300
by the benchmark towers when evaluated with their actual heights that average 42 m (the asterisk marker), 301
and some solutions even outperform these towers with respect to the second objective. The 72 solutions 302
comprise different combinations of 61 sites which are shown on the client area in Figure 12(b) – a significant 303
decrease from the 917 sites in Figure 12(a). 304
Candidate layouts
305
The site locations and coverage achieved by two solutions on the final attainment front in Figure 11 are 306
shown with respect to Cover Zone 1 in Figure 13 and Cover Zone 2 in Figure 14. Solution 1 is the solution on 307
the attainment front that achieves the best coverage with respect to Cover Zone 1, and its site locations are 308
shown along with its coverage of Cover Zone 1 and Cover Zone 2 in Figures 13(a) and 14(a), respectively. 309
Solution 2 is the solution on the attainment front that achieves the best coverage with respect to Cover 310
Zone 2, and Figures 13(b) and 14(b) show its site locations and resulting coverage of the two Cover Zones. 311
A number of similarities may be observed when analysing the proposed sites of these two candidate 312
layouts. Six sites are, in fact, common to both layouts. When comparing the remainder of the sites, nine 313
are similarly located in the two layouts and the slight differences in location of between 25 m and 70 m 314
are indistinguishable in Figures 13 and 14. The remaining five sites in each layout differ more significantly 315
and are at least 2 km from the nearest site in the other layout. What may be noticed when analysing 316
these five sites is how their locations in each layout are a result of the objective with respect to which their 317
layout achieves the best result – an indication of how the multi-objective optimisation process simultaneously 318
pursues site combinations for different objectives. In Figures 13(a) and 14(a) for Solution 1, these five sites 319
tend to be located more inward from the boundaries, with the result that their coverage contributes more 320
to that achieved with respect to the client area in Cover Zone 1, and less with respect to the buffer zone 321
in Cover Zone 2. In Figures 13(b) and 14(b) for Solution 2, these sites are mostly located closer to the 322
boundaries, which means that their coverage contributes more to that achieved with respect to the buffer 323
zone in Cover Zone 2, while reducing cover of the client area in Cover Zone 1. 324
Expert feedback
325
A selection of optimised system layouts were presented to a group of experts at the Nelspruit Fire 326
Protection Agency in the form of Figures 11, 13 and 14. The experts included foresters each with over 20 327
years of experience in forest and fire management in the region, GIS specialists from forestry clients, and 328
ForestWatch decision makers and detection centre operators (some of whom were involved in the planning 329
of the existing CWDS). Physical site locations of candidate layouts were also presented in Google Earth 330
For Review Only
(a)
[image:17.595.71.521.134.670.2](b)
Figure 13: Physical site locations and cover achieved with respect to the Cover Zone 1 for two solutions from the final attainment front in Figure 11. Solution 1 in (a) achieves the best cover with respect to Cover Zone 1, while Solution 2 in (b) achieves the best cover with respect to Cover Zone 2.
For Review Only
(a)
[image:18.595.69.529.135.669.2](b)
For Review Only
visualisation provided an effective means of estimating practical site suitability without having to physically 332
visit any of the sites. 333
The experts agreed that the sites comprising the optimised layouts presented were suitable from a prac-334
tical, real-world perspective, demonstrating the effectiveness of the Placement-Zone determination process 335
outlined above. A few of the sites in each of the candidate system layouts were located precisely at or im-336
mediately adjacent to actual sites, while others were within 500 m of actual sites. Sites that were considered 337
for tower placement during the original site-selection process, but that were not used, were also present in 338
many of the candidate solutions – this renewed discussions between the experts about these sites’ suitability 339
compared to the actual sites. The remaining sites were judged by all those present to be good proposals as 340
well. 341
Discussion 342
The first steps taken towards a comprehensive CWDS tower-site selection optimisation framework have 343
been described. The GIS component of this framework comprises the determination of feasible candidate 344
sites (the Placement Zone) in addition to determining discrete demand points within areas with respect to 345
which visibility cover from the cameras is determined (the Cover Zones). Metaheuristics are applied in the 346
optimisation approach to determine candidate CWDS layouts which aim to achieve optimal results with 347
respect to specific objectives. The Multi-Resolution Approach was used in conjunction with the popular 348
NSGA-II algorithm in the metaheuristic approach, and the objectives were to maximise visibility cover with 349
respect to two different smoke layer levels above the terrain surface. An area in the Nelspruit region in South 350
Africa, which is currently covered by an existing ForestWatch CWDS, was used as the study area, and the 351
optimisation framework was used to compute high-quality trade-off solutions for CWDSs comprising twenty 352
cameras. 353
The framework can provide multiple candidate CWDS layouts in under a week (including data collection, 354
data processing, preliminary analysis and optimisation), compared to the actual site-identification process 355
that spanned over more than five months. The solutions obtained by the optimisation framework were 356
found to significantly outperform the actual configuration with respect to both covering objectives when 357
considering identical tower heights of 12 m. Furthermore, the optimisation-determined solutions achieved 358
similar coverage to the existing system with its actual tower heights – despite the optimisation solutions 359
being limited to 12-m tower heights while the existing system has an average tower height of 42 m. The 360
fact that a 12-m tower costs more than three times less to install than a 42 m tower8is an indication of the 361
potential cost savings that may be achieved by the optimisation approach. The optimised solutions were 362
able to reliably identify the most important sites, thereby further reducing the time required to implement 363
a full CWDS by allowing site visits to focus on sites which are most likely to form part of the final system. 364
The results were presented to experts from ForestWatch and forestry organisations from the Nelspruit 365
region and the feedback was positive. The presented candidate CWDS layouts were considered practically 366
implementable in a real-world scenario, and it was concluded that the optimisation framework is a tool 367
that should be used in future CWDS planning and decision-making processes. Elements of the CWDS 368
site-selection optimisation framework described above have already been used for the planning of new tower 369
sites. 370
In a real-world CWDS site-selection problem, the decision makers would compare results such as those 371
presented in Figures 11, 13 and 14 in terms of objective-function values and tower site locations in order 372
to make a final decision. A set of solutions that is diverse with respect to objective-function values and 373
tower site locations is desirable in order to provide a good set of alternatives that may be considered, and 374
this goal has been achieved as shown in Figures 11 and 12(a). It is possible, however, that attainment 375
fronts consisting of an undesirably large number of solutions may be returned, e.g. the 72 solutions in 376
the attainment front in Figure 11. Many of these solutions offer negligible trade-offs in terms objective-377
function values and tower-site locations, rendering decision making a long and tiresome process (Heyns, 378
8These costs were determined from tower installation costs provided by ForestWatch technicians.
For Review Only
2016). In future work, techniques to filter the Pareto-front to generate a smaller number of solutions should 379
be investigated. Possible techniques include those that are performed in objective-function space, such as 380
the epsilon-grid method (Mavrotas, 2009), and those performed in physical solution space, such as site 381
proximity-dependent de-clustering investigated by Heyns (2016). 382
Two smoke layers and a buffer zone were used for the Cover Zones with respect to which a CWDS’s smoke 383
detection potential was evaluated. In future work, additional Cover Zones may include certain priority areas 384
within the larger area to be covered. Examples may include areas around key infrastructure points such 385
as power plants and chemical storage facilities. In such instances, a priority Cover Zone is simply added 386
as an additional covering objective and the problem solved as usual by the multi-objective optimisation 387
framework. If desired, decision makers may then turn their focus toward solutions that perform well with 388
respect to the priority areas in determining a suitable layout. 389
Conflict of interest 390
The authors declare no conflicts of interest. 391
Acknowledgements 392
The authors would like to express their sincere thanks to Mr Dennis Lawrie, Mr Adrian Daniel and Mr 393
Gareth Perks of ForestWatch for their valuable discussions, suggestions and timely data provision during 394
the writing of this paper. 395
This work is based on the research supported in part by the National Research Foundation (NRF) (Grant 396
specific unique reference number (UID) 85845). The NRF Grantholder acknowledges that opinions, findings 397
and conclusions or recommendations expressed in any publication generated by the NRF supported research 398
are that of the authors, and that the NRF accepts no liability whatsoever in this regard. Opinions expressed 399
and conclusions arrived at are those of the authors and are not necessarily to be attributed to the CoE-MaSS. 400
Lastly, the authors would like to thank the anonymous reviewers for their constructive input during the 401
revision process of this paper. 402
Appendix – Multi-objective evolutionary algorithms 403
A popular alternative to the weighted-sum approach is Multi-Objective Evolutionary Algorithms, which 404
are able to approximate a diverse set of trade-off solutions on the Pareto front in a single run (Fonseca and 405
Fleming, 1993; Purshouse and Fleming, 2003) and are also known to achieve good results fast (Alp et al., 406
2003). Multi-Objective Evolutionary Algorithms iteratively evolve a population of candidate solutions to an 407
optimisation problem based on natural principles (Cheshmehgaz et al., 2015). An initial, randomly generated 408
population of candidate solutions undergoes carefully controlled evolution over multiple generations, finally 409
arriving at a set of solutions that approximate the Pareto front (Deb et al., 2002; Cheshmehgaz et al., 2015). 410
It has been shown how a Multi-Objective Evolution Algorithm may find more non-dominated solutions than 411
are found by a weighted-sum approach, and as a result, may achieve a superior Pareto-front approximation 412
to a weighted-sum approach (Kim et al., 2008). Examples of the application of Multi-Objective Evolutionary 413
Algorithms to placement problems include the placement of transmitters (Meunier et al., 2000; Raisanen and 414
Whitaker, 2005), wind turbines (Kwong et al., 2014; Yamani Douzi Sorkhabi et al., 2016), and observation 415
equipment (Kim et al., 2004; Tong et al., 2009; Bao et al., 2015; Heyns and Van Vuuren, 2015; Heyns and 416
van Vuuren, 2018). 417
The NSGA-II is a Multi-Objective Evolutionary Algorithm that is classified as a genetic algorithm, in 418
which a candidate CWDS layout is represented as achromosome string of Nt feasible tower site numbers
419
(Deb et al., 2002; Heyns and van Vuuren, 2016). Site numbers are pre-determined by an indexing scheme 420
for all the sites within the Placement Zone’s raster representation and are typically derived with respect to 421
row and column indices (Heyns and van Vuuren, 2016). For example, a chromosome [33, 125, 8 333, 12 045] 422
For Review Only
The NSGA-II iteratively performs evolution-inspired selection processes and modification operators on a 424
randomly generated population of such candidate CWDS chromosomes until a termination criterion is met 425
(Deb et al., 2002). A typical termination criterion is when the algorithm has reached a point where successive 426
populations fail to significantly improve on the solution quality of previous generations (Heyns, 2016). Two 427
mechanisms are utilised in order to adequately explore the solution space. Crossovers performed between 428
sub-strings of parent chromosomes create new offspring solutions that consist of new site combinations, 429
without altering the constituent sites that are inherited from the parent solutions (Deb et al., 2002; Heyns 430
and van Vuuren, 2016). Parents are randomly selected for crossover, although solutions which perform 431
well with respect to the objective functions are favoured – meaning that the offspring solutions typically 432
exhibit some of the strong properties of their parents. After crossover, mutation promotes site diversity 433
by stochastically introducing new, unexplored site locations into the chromosomes, as opposed to merely 434
exchanging already explored sites by means of crossover (Deb et al., 2002; Heyns and van Vuuren, 2016). 435