Detection of Heart Diseases using Machine Learning and
Data Mining
Prabhjot Kaur
Research Scholar Department of CSE
GNDEC, Ludhiana
Kulvinder Singh Mann,
PhD ProfessorDepartment of IT GNDEC, Ludhiana
ABSTRACT
In this research work, alternative seven algorithms that have low overhead have been evaluated for detecting and predicting heart failure risk (HFR), Thirteen risk factors have been considered for the automating the prediction process using machine learning algorithm. Correlation and Histogram based analysis shows that at least four to five parameters vary together. Using this criterion the number of minimum risk factors to label a patient as low or high risk. Secondly, criteria to group the patients were with the help of binning the data based on medical normal ranges for a person. It was found that the Logistic Regression and Linear Discriminant algorithm is best suited for classification of heart failure risk as its results are numerically stable, consistent, reliable, and reproducible. This was validated using tenfold validation process.
Keywords
Heart failure risk, Classification, Prediction.
1.
INTRODUCTION
There are many organizations and repositories [1] whose job is to collect and store cardiac and related tissues information in the process to detect the problems. Most of these organization are advance technology-based organizations that support studies related to statistics and challenges related to heart problems. Risk estimation [2] [3] algorithms are becoming part of clinical prevention practice day by day. Much medical organization is expected to monitor the hearts related issues. And based on the monitoring [4] launch awareness program [5] so that the risk associated with a heart can be reduced.
Insurance companies compute the risk [6] [7] for the subjects for formulating the health insurance policies. These days, there is a sincere attempt by both the insurance and medical industry to work together for estimating risk. This is helping all the stakeholder. The people at large are getting educated and learn to reduce their risk. This way there is a fair chance to again “no claim “bonus. And the medical industry is able to innovate and make progress using such initiatives. The medical, as well as the insurance industry, are leveraging the sensors [8], machine learning [9] and other artificial intelligence related technologies for identification of new risk vectors. The arena of heart risk extrapolation and classification has now reached new levels of understanding. The industry has come a long way from using 10-year studies or lifelong risk estimation methods. The use of the classical statistical test is giving way to the use of machine learning models. Clustering algorithms [10] and data mining algorithms such as apriori [11] that can discover new patterns in the dataset are being used to classify different levels of risks. However, the challenge remains about the coming complexity of the data as it is not being collected from
wearable and sensors also. But, it is clear that the future lies with the use of robust and accurate risk prediction models [12] [13]. Hence, the need for making substantial efforts to optimize risk prediction models and prevention algorithms for risk communication, patient motivation, and clinical decision making. The next section gives a review of the approaches following in current literature for detection and classification of the risks.
2.
RELATED WORK
The contemporary literature shows various methods are being employed for detecting hear the related problem. Depending on the kind of variable and factors the research has applied different types of machine learning algorithm to do. This section gives information in this context.
The current study of the methods, algorithms that are used for the detection of heart failures, the key issues faced by the researchers is the availability of the public repositories. It has been observed that a number of repositories in this context are limited. Second, the issue with these repositories that the sample size is small. Which does not give a full representation of broad demographics? Some of the public repositories contain a small number of instances that they are being used for constructing generic and intelligent learning models [3] [14].
Deep learning models need a lot of data, again here also it can be observed that data related to test conducted for heart failure is not adequately represented in public repositories. It should, however, be noted that data related to parameter ‘ECG’ is available with quite good repositories. The most popular repositories include the UCI Machine Learning Repository [15], Duke Human heart repository [16], etc.
the peak exercise ST segment, Number of major vessels colored by fluoroscopy and that.
Optimization algorithms such as genetic [23] are been used for the detection of heart-related problems. The authors [24] constructed a prototype using intelligent genetic algorithm hybrid with back propagation techniques .The review of machine learning algorithms used in detecting the heart issues shows that neural network , support vector machine [25] [14] [26] , KNN , Decision Tree [27] [11] are most frequently used . The surveyed about various classification techniques that detected the patient’s risk level by classifying it using data mining classification techniques such as Probabilistic Classification [28] , KNN, Decision Tree Algorithm [11] , and Neural Network [28] , etc.
Researches have gone beyond the detection of heart diseases. The current trend shows that the focus of the researchers these days is on computing risk associated with heart issues [14] , problems and failures. For this un-supervised machine learning are being used. Methods such as K-means and hierarchical clustering are most frequently used.
The researchers are also feeling the need to ‘hybridization or combinational’ of the heart detection process. The reason is that most of the repositories related heart do not have annotated or labeled feature instances. There is a need to either bin , cluster or segregate the data based on the type of modality of heart or need to be labeled according to the risk levels [29] associated with heart problems . The need for combination approaches arises from the need to improve the accuracy, add new vectors of diseases in the current machine learning models or simply there is a need to pre-process the data before it can be used for machine learning. The clustering algorithms and dimension reduction methods along with supervised learning are yielding good results in the context of detecting heart-related issues.
3.
PROBLEM STATEMENT
After reading the contemporary literature in the context of detection of heart failure and problems, it was found that with the passage time, new vectors of heart failure and diseases have come into play due to lifestyle changes and advancement of technology that can record new parameters. And at the same time, new developments in data mining and machine learning algorithms are given opportunities to improve the accuracy and reliability of heart diagnoses detection process. Due to new vectors, new types of the dataset have created and curated in public repositories. There is a need to make heart diseases efficiently identifiable and curable with a new set of algorithms and dataset. But, the main issue is the quantification of risks in terms of levels. The complexity of the vectors that impact the health of the heart does not follow a simple linear path. A person may have two three parameters that are within the normal medical range and at the same time, two-three parameters may be out of normal range. This makes the process of diagnosis hard and there is a need for knowledge discovery algorithms to discover/identify risk levels that will be useful for diagnosis of the heart. There might even be a need to pipeline multiple algorithms to do this discovery and make the process automatic for detection. Evidence in the current literature shows the use of ANN, KNN, fuzzy logic, NB and another algorithm for the same purpose. This study intends to investigate consistency, reliability and reproducibility and suitability of such algorithm based on the cleaver dataset.
3.1
Scope of the Work
3.1.1
Using Frequency, Co-variance and Correlation identify levels of risks for the Heart Failure (HF).3.1.2
Develop an approach for binning data into heart risk classes using medical specifications.3.1.3
Develop a pipeline algorithm that automates the process of classifying the risks of heart failure.3.2
Methodology
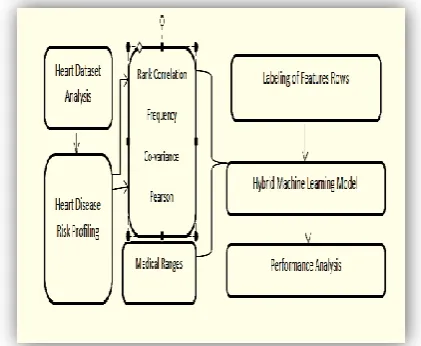
[image:2.595.323.534.334.507.2]In this section, the discussion on the dataset characteristics of heart disease data to be used in this study is given. The process of identification of various levels of risks is discussed and later on, the evaluation of machine learning algorithms is discussed. Care has been taken to use well-established procedures to maintain the quality of the dataset. For a better understanding of the flow, the work Figure [1] block diagram can be used. It can be observed from the block diagram that initially heart disease risk profiling is done. Correlation between the risk factors is computed so that only those features can be used that have low correlation among themselves and ranking of the variables is done so that threshold can be found using high covariate in simple words those variables that are associated together and very together.
Figure 1: Workflow of the detection of Heart Failure Risk (HFR)
3.3
Dataset Characteristics
Table 1: Features for classification of Heart Failure
S.NO Attribute
/Description Code
Numerical Ranges
1 Age (Years)
Young =1 Medium= 2 Old=3 Very old=4 <33 34-40 41-52 >32
2 Gender Male=1
Female=0
1 0
3 Chest Pain Type :
Typical angina Atypical angina Non-angina pain Asymptomatic pain 1 2 3 4
4 Resting Blood Pressure Low=1 Medium=2 High=3 Very high=4 <128 128-142 143-154 >154
5 Serum Cholesterol
Low=1 Medium=2 High=3 Very high=4 <188 189-217 218-281 >281
6 Fasting Blood Sugar True=1 False=0 1 0 7 Resting Electrocardiographic results Normal=0 ST-T abnormal=1 Hypertrophy=2 0 1 2
8 Maximum heart rate achieved Low==1 Medium=2 High=3 <112 112-152 >152
9 Exercise-induced angina
True=1 False=0
1 0
10 Old Peak
Low=1 Risk=2 Terrible=3 <1.5 1.5-2.55 >2.55
11 Peak Exercise Slope
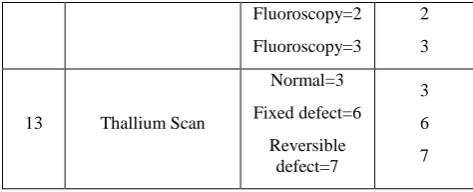
Up sloping=1 Flat=2 Down sloping=3 1 2 3 12
Number of major Vessels Colored by
Fluoroscopy Fluoroscopy=0 Fluoroscopy=1 0 1 Fluoroscopy=2 Fluoroscopy=3 2 3
13 Thallium Scan
Normal=3 Fixed defect=6 Reversible defect=7 3 6 7
Age of the person is a very important factor that determines the health of the heart of the person. It can be observed mathematically that there are about seven sub-groups within the dataset; the subgroups within the dataset, the sub-groups can further be divided into smaller groups. But for this macro-level analysis. It can be observed that there is a wide range of age values in the dataset. This that at any age the heart of a person can be an issue and this factor can act as a good predictor.
The Chest Pain Type (CPT): The medical fraternity has recognized four types of chest pain types. Viz., typical angina, atypical angina, Non-angina pain, and asymptomatic pain. The typical angina pain occurs happens when the heart arteries get blocked and atypical angina is a pain that is non-specific chest discomfort. The non-angina pain is characterized with pain in a chest with short duration (5 seconds to 30 minutes) and relieve comes by the movement of some body part. Asymptomatic pain, a kind of pain that is not exhibiting the cause of heart failure. The dataset has about 140 cases of asymptomatic pain and the least number of cases of non-angina pain. To test the health of the heart, sometimes the person is asked to do some physical exercise and then observations are done. As the person exercises, the demand for oxygen increases and heart need to do more work. If some kind of pain arises due to exercise, it can be termed as exercise-induced angina (EIA). During the physical exercise, (PES) peak exercise slope and other (Old Peaks) peaks are also computed. The rate of change of oxygen demand is computed by taking rest as a reference point. The shape and slope value of the curve gives hint whether the person is prone to heart problems or not. A flat slope indicates that oxygen demand remains constant throughout the exercise test time. If the slope is downwards, it indicates that the heart is unable to get the required level of oxygen. Hence, there is a risk.
Maximum heart rate achieved (MHRA): It is computed on the basis of age from a value of 220. This is because research shows that heartbeat rate changes with age and the kind of physical condition the person is in. The target heart rate is computed in terms of the percentage of the maximum rate the heart can achieve. If the heart is unable to reach its target rate the person is prone to heart failure.
Labeling of Features Rows: The last section gave the medical ranges and the outcomes of the heart-related tests. From these values, the dataset is converted into discrete class dataset having low and high risks classes. Binning algorithm was fed with the medical test values and following data composition emerged. The total dataset of the HF consist of the 302 instances and the grouping statistics as per the risks can be studied from the histogram table as well. The bar graph 2 show that Low-risk instances are 160 and 162 in case of high risk.
Figure 2: Risk Category/Class Wise Number of Instances of Heart Dataset
(Where 1=Low Risk, 2= High Risk)
It can be observed from Figure 2 that a number of instances that can be grouped into low risk are 164 and high risk is 138. These have been found with the help of medical ranges and by doing frequency, correlation and variance analysis.
Feature Labeling and Selection:
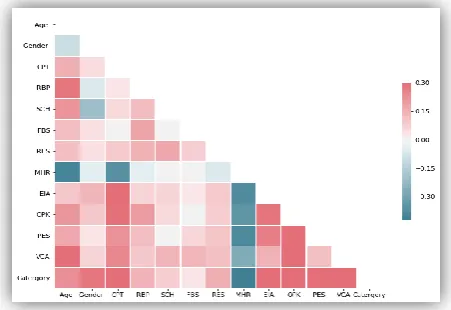
It is always expected that variables used for the construction of the machine learning models do not have any kind of dependency with each other. All the feature values should directly depend on the target variable. Since this research work is a multi-label problem. The relationship between the target variable (label) with variable will be arbitrary. Therefore, in the context of the problem undertaken, the correlation (Using the Pearson method) among all other variables is computed and selection of features is done based on the lowest correlation criteria.
[image:4.595.67.276.183.356.2]Figure 3: Correlation Matrix of the Heart dataset
Table 2: Feature-based on Correlation Threshold Value
S.NO Threshold Pool Size Pool
1 0.5 1 PES
2 0.35 4
'MHR', 'EIA', 'PES',
'VCA'
3 0.30 5
MHR', 'EIA', 'OPK', 'PES', 'VCA'
From the above correlation matrix, it can be inferred that the variable PES changes with almost all the other variables and other than this four variables ('MHR', 'EIA', 'PES', 'VCA') also change ‘together’ at correlation value of 0.35. Therefore, it is suggested that a minimum of four variable (Threshold) should be considered to taking a decision for grouping. If it is found that these four variable are either within the medical normal limits than the person should be declared is at Low level of risk. Based on this inference, the rules for labeling are as follows:
1. Let ‘the’ be threshold, computed on the basis of a number of variables that are associated with each other and vary together (pool size). According to the [Table no.2] threshold can be later on like 5 or correlation level of 0.30.
2. Let ‘x’ be the number of total variables that determines the health of the heart.
3. Let nx be the number of variables that shows the number factor’s that are in with a normal medical range for a patient.
4. Let ‘gx’ be the number of variables that shows the number of factors that are out of medical range 5. If (‘nx’>Threshold) then mark that feature as high
else check the count of ‘gx ‘, if the gx > the then label it a Low Risk.
These medical limits are used to decide, whether the person is in a high or low-risk zone.
4.
RESULTS AND VALIDATION
Initially, seven algorithms (Logistic regression, linear discriminant analysis, k-nearest neighbor, Naïve Bayes, Classification and Regression Tree, Support Vector Machine, Random Forest) were evaluated and it was found that there is a need to have a combinational/ hybrid approach to achieve a better level of accuracy and precision with balanced values of F1-score. Due to this, all these algorithms were pipelined with principal component analysis (PCA) algorithms.
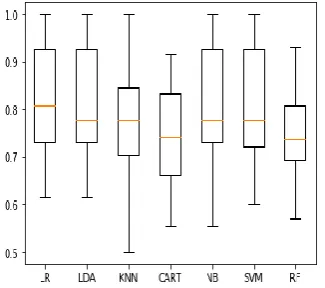
[image:4.595.63.289.582.737.2]Figure 4: Comparison of Algorithm based on Accuracy
Table 3: Average Accuracy and Standard Deviation of Accuracy
Algorithm
(Accuracy) Mean (Recall)
Standard Deviation (Accuracy)
1 LR: 0.813000 (0.068304)
2 LDA: 0.808833 (0.068207)
3 KNN: 0.767667 (0.059307)
4 CART: 0.763000 (0.109260)
5 NB: 0.805000 (0.067206)
6 SVM: 0.804833 (0.072585)
7 RF: 0.780333 (0.086621)
[image:5.595.80.247.95.250.2]It can be observed that the highest average accuracy of classification is of LR algorithm, this is due to the empirical results obtained after running each algorithm 10 times (10 k fold validation). From this, it can also be inferred that the LR algorithm is numerically stable and consistent in producing its performance in terms of accuracy. This fact is further reinforced when the standard deviation of the results are studied. The LR algorithm has the lowest standard deviation of its accuracy metric. Which means the results remain consistent and stable.
Figure 5: Comparison of Algorithm based on precision
Table 4: Average Accuracy and Standard Deviation of Precision
Algorithm Mean (Recall)
Standard Deviation (Precision)
1 LR: 0.849754 0.100721
2 LDA: 0.849754 0.100721
3 KNN 0.825647 0.086564
4 CART: 0.790362 0.141542
5 NB: 0.839338 0.083364
6 SVM: 0.849754 0.088323
7 RF: 0.804338 0.096388
[image:5.595.322.535.348.473.2]According to the values of precision. It can be observed that LR and LDA algorithm have a comparable level of numerical stability and consistency while producing results in terms of precision. Hence, it is clear that there is a need to evaluate more performance metric to finally decide on which algorithm is best for terms of precision.
[image:5.595.309.549.511.670.2]Figure 6: Comparison of Algorithm for Recall Metric
Table 5: Average Recall and Standard Deviation of Recall
Algorithm Mean (Recall)
Standard Deviation (Recall)
1 LR: 0.849754 0.100721
2 LDA: 0.849754 0.100721
3 KNN 0.825647 0.086564
4 CART: 0.790362 0.141542
5 NB: 0.839338 0.083364
6 SVM: 0.849754 0.088323
7 RF: 0.804338 0.096388
[image:5.595.85.248.605.749.2]LR and LDA have similar performance in terms of F-score as well. The results in both algorithms are consistent and repeatable.
[image:6.595.61.272.143.278.2]In this section, the outputs of the pipelined or hybridized algorithm are discussed based on the F1-score.
Figure 7: Comparison of Algorithm based on F1 metric
Table 6: Average F1-score values for all algorithms
Algorithm Mean (Recall)
Standard Deviation (Recall)
1 LR: 0.824697 (0.066709)
2 LDA: 0.821564 (0.066363)
3 KNN: 0.786016 (0.060296)
4 CART: 0.784644 (0.081637)
5 NB: 0.812171 (0.084287)
6 SVM: 0.817375 (0.072507)
7 RF: 0.758840 (0.123113)
It can be observed that SVM and NB are the best performers in terms of F-score values as their values are highest amongst all the hybrid algorithms. This shows that there is a good level of trade-off between the recall and precision values. It also shows that there is a minimum level of bias in the classification of the risk classes in case of NB and SVM.
5.
DISCUSSION AND CONCLUSION
In this research work, we have formulated a method to find the various find of patterns in the heart dataset to categorize their risk levels. It was found that by using cross tab frequency analysis, we were able to decode the groups that exist within the full dataset. Secondly, the covariance and correlation analysis allowed us to find the threshold based on which the patient needs to be declared or labeled as a low or high-risk patient. Later, based on the medical limits the binning of the dataset was done and all the dataset was subjected to the machine learning algorithm. The performance evaluation of the machine learning models shows that by a deeper analysis of the variance the outcome of the supervised learning model can further be improved. This step helped to construct a combination of an algorithm that produces reliable and reproducible output.
6.
REFERENCES
[1] A. Singh and K. Ramkumar, “Health Risk Dataset.” mendelay, 2018.
[2] P. Melillo, N. De Luca, M. Bracale, and L. Pecchia, “Classification Tree for Risk Assessment in Patients Suffering From Congestive Heart Failure via Long-Term Heart Rate Variability,” IEEE J. Biomed. Heal. Informatics, vol. 17, no. 3, pp. 727–733, May 2013. [3] C. A. Harle, D. B. Neill, and R. Padman, “Information
Visualization for Chronic Disease Risk Assessment,” IEEE Intell. Syst., vol. 27, no. 6, pp. 81–85, Nov. 2012. [4] N. Alshurafa, C. Sideris, M. Pourhomayoun, H.
Kalantarian, M. Sarrafzadeh, and J. Eastwood, “Remote Health Monitoring Outcome Success Prediction Using Baseline and First Month Intervention Data,” IEEE J. Biomed. Heal. Informatics, vol. 21, no. 2, pp. 507–514, Mar. 2017.
[5] K. B. Rager, “Self-Care and the Qualitative Researcher: When Collecting Data Can Break Your Heart,” Educ. Res., vol. 34, no. 4, pp. 23–27, May 2007.
[6] D. Lakdawalla, A. Malani, and J. Reif, “The insurance value of medical innovation,” J. Public Econ., vol. 145, pp. 94–102, 2017.
[7] D. Tomar and S. Agarwal, “A survey on data mining approaches for healthcare,” Int. J. Science Bio-Technology, vol. 5, no. 5, pp. 241–266, 2013.
[8] M. S. Hossain and G. Muhammad, “Cloud-assisted Industrial Internet of Things (IIoT) – an Enabled framework for health monitoring,” Comput. Networks, vol. 101, pp. 192–202, Jun. 2016.
[9] A. Raghu, D. Praveen, D. Peiris, L. Tarassenko, and G. Clifford, “Implications of cardiovascular disease risk assessment using the WHO/ISH risk prediction charts in rural India,” PLoS One, vol. 10, no. 8, pp. 1–13, 2015. [10] J. L. Bruse et al., “Detecting Clinically Meaningful
Shape Clusters in Medical Image Data: Metrics Analysis for Hierarchical Clustering Applied to Healthy and Pathological Aortic Arches,” IEEE Trans. Biomed. Eng., vol. 64, no. 10, pp. 2373–2383, Oct. 2017.
[11] M. A. Karaolis, J. A. Moutiris, D. Hadjipanayi, and C. S. Pattichis, “Assessment of the Risk Factors of Coronary Heart Events Based on Data Mining With Decision Trees,” IEEE Trans. Inf. Technol. Biomed., vol. 14, no. 3, pp. 559–566, May 2010.
[12] B. H. Cho, H. Yu, J. Lee, Y. J. Chee, I. Y. Kim, and S. I. Kim, “Nonlinear Support Vector Machine Visualization for Risk Factor Analysis Using Nomograms and Localized Radial Basis Function Kernels,” IEEE Trans. Inf. Technol. Biomed., vol. 12, no. 2, pp. 247–256, Mar. 2008.
[13] V. S. H. Rao and M. N. Kumar, “Novel Approaches for Predicting Risk Factors of Atherosclerosis,” IEEE J. Biomed. Heal. Informatics, vol. 17, no. 1, pp. 183–189, Jan. 2013.
[image:6.595.50.287.317.478.2][15] UCI, “UCI Machine Learning Repository: Heart Disease Data Set,” UCI, 2019. [Online]. Available: https://archive.ics.uci.edu/ml/datasets/heart+disease. [Accessed: 16-May-2019].
[16] Duke.edu, “Duke Human Heart Repository,” Duke, 2019. [Online]. Available: https://sites.duke.edu/dhhr/. [Accessed: 16-May-2019].
[17] J. J. Oresko et al., “A Wearable Smartphone-Based Platform for Real-Time Cardiovascular Disease Detection Via Electrocardiogram Processing,” IEEE Trans. Inf. Technol. Biomed., vol. 14, no. 3, pp. 734– 740, May 2010.
[18] X. Liu, Y. Zheng, M. W. Phyu, B. Zhao, M. Je, and X. Yuan, “Multiple Functional ECG Signal is Processing for Wearable Applications of Long-Term Cardiac Monitoring,” IEEE Trans. Biomed. Eng., vol. 58, no. 2, pp. 380–389, Feb. 2011.
[19] T. Ince*, S. Kiranyaz, and M. Gabbouj, “A Generic and Robust System for Automated Patient-Specific Classification of ECG Signals,” IEEE Trans. Biomed. Eng., vol. 56, no. 5, pp. 1415–1426, May 2009.
[20] B. A. Goldstein, A. M. Navar, and R. E. Carter, “Moving beyond regression techniques in cardiovascular risk prediction: Applying machine learning to address analytic challenges,” Eur. Heart J., vol. 38, no. 23, pp. 1805–1814, 2017.
[21] O. W. Samuel, G. M. Asogbon, A. K. Sangaiah, P. Fang, and G. Li, “An integrated decision support system based on ANN and Fuzzy_AHP for heart failure risk prediction,” Expert Syst. Appl., vol. 68, no. C, pp. 163– 172, Feb. 2017.
[22] G. Quer et al., “Home Monitoring of Blood Pressure: Short�Term Changes During Serial Measurements for 56398 Subjects,” IEEE J. Biomed. Heal. Informatics,
vol. 22, no. 5, pp. 1691–1698, 2018.
[23] I. Kavakiotis, O. Tsave, A. Salifoglou, N. Maglaveras, I. Vlahavas, and I. Chouvarda, “Machine Learning and Data Mining Methods in Diabetes Research,” Comput. Struct. Biotechnol. J., vol. 15, pp. 104–116, 2017. [24] Y. Goletsis, C. Papaloukas, D. I. Fotiadis, A. Likas, and
L. K. Michalis, “Automated ischemic beat classification using genetic algorithms and multicriteria decision analysis,” IEEE Trans. Biomed. Eng., vol. 51, no. 10, pp. 1717–1725, Oct. 2004.
[25] T. S. Brisimi, T. Xu, T. Wang, W. Dai, W. G. Adams, and I. C. Paschalidis, “Predicting Chronic Disease Hospitalizations from Electronic Health Records: An Interpretable Classification Approach,” Proc. IEEE, vol. 106, no. 4, pp. 690–707, Apr. 2018.
[26] G. Georgoulas, D. Stylios, and P. Groumpos, “Predicting the risk of metabolic acidosis for newborns based on fetal heart rate signal classification using support vector machines,” IEEE Trans. Biomed. Eng., vol. 53, no. 5, pp. 875–884, May 2006.
[27] J. Fayn, “A Classification Tree Approach for Cardiac Ischemia Detection Using Spatiotemporal Information From Three Standard ECG Leads,” IEEE Trans. Biomed. Eng., vol. 58, no. 1, pp. 95–102, Jan. 2011.
[28] N. Feng, S. Xu, Y. Liang, and K. Liu, “A Probabilistic Process Neural Network and Its Application in ECG Classification,” IEEE Access, vol. 7, pp. 50431–50439, 2019.