© 2017 Ghada Awad et al. This is an open access article distributed under the terms of the Creative Commons Attribution License -NonCommercial-ShareAlikeUnported License (http://creativecommons.org/licenses/by-nc-sa/3.0/).
Journal of Applied Pharmaceutical Science Vol. 7 (02), pp. 067-075, February, 2017 Available online at http://www.japsonline.com
DOI: 10.7324/JAPS.2017.70208 ISSN 2231-3354
Sequential optimizations of
Aspergillus awamori
EM66 exochitinase
and its application as biopesticide
Ghada E. A. Awad
1, Walaa A. Abdel Wahab
1, Mona Hussein
2, Ahmed El-diwany
1, Mona A. Esawy
1*1
Department of Chemistry of Microbial and Natural Products, National Research Centre, Tahrir Street, Dokki Cairo, Egypt.
2
Department of Pests and Plant Protection, Centre of Excellence for Advanced Sciences, National Research Centre,Tahrir Street, Dokki Cairo, Egypt.
ARTICLE INFO ABSTRACT
Article history:
Received on: 27/06/2016 Accepted on: 10/09/2016 Available online: 27/02/2017
Sequential optimization strategy was achieved based on statistical experimental designs for enhancement of
Aspergillus awamori EM66 exochitinase production. Firstly, 2-level Plackett-Burman design was accomplished for distinguishing between the bioprocess parameters, which improve the exochitinase production. Second optimization step was implemented through central composite design (CCD), for optimization variables amounts which have the highest positive effect on exochitinase production. Maximum activity (5998mU/ml) for exochitinase reported approximately 22 fold increase compared to the basal medium activity. Mortality 92%, 86.67% and 65.67% was recorded when the partial pure fungal exochitinase was applied to the diet of the greater wax moth larvae, Galleria mellonella, the cotton leaf worm, Spodoptera littoralis, and the black cutworm, Agrotis ipsilon, respectively. The results indicated to the importance of Aspergillus awamori EM66 exochitinase as an effective bio- pesticide.
Key words:
Aspergillus awamori; Bio pesticides; Central composite design; Exochitinase.
INTRODUCTION
Hard environments are permanently predictable to accord unrivalled microorganisms have new feature. Honey osmophilic property commended it to be good medium for dominant spores worthy to produce bio-products with unique
properties (Esawy et al., 2011; Esawy et al., 2012; Esawy et al.,
2013). Chitin, is a
β-1,4-linkedN-acetylglucosaminehomopolymer. It is consider the second most copious polysaccharide in nature. Chitin is considered as one of the main component of exoskeletons of some insect, fungus cell walls and crustacean shells (Gooday, 1990; Crosby and Alfred, 2004). It is also exists in several body ingredients of invertebrates
and as a bacterial product (Tanaka et al., 1999; Nawani and
Kapadnis, 2005). Chitinases (E.C.3.2.1.14) is enzymes have the ability to hydrolyze in soluble chitin to its oligo and monomeric components. Chitinases could be divided into two main
enzymes, exochitinases and endochitinases (Graham and Sticklen,
* Corresponding Author
E-mail: mona_esawy @ hotmail .com
1994). Endochitinases (EC 3.2.1.14) can split chitin at random internal sites yielded a soluble, low-molecular mass multimers of N-Acetylglucosamine (GlcNAc) like chitotetrose, chitotriose, and diacetylchitobiose. Exochitinase consisted of two subcategories: β-1, 4 N-acetyl glucosaminidases and exochitinases (EC 3.2.1.29), the aim of this work which can stimulate the release of diacetylchitobiose starting at the non-reducing end of chitin chains
(Chuan, 2006). Many researchers pay attention to chitinases
because of their wide range of biotechnological applications, especially in chitooligosaccharides production, glucosamines, and
GlcNAc have an massive pharmaceutical potential (Singh et al.,
2009) and, Chitinases can be also used as bio-control agents against fungal phytopathogens in agriculture field due to their
ability to hydrolyze the chitinous fungal cell wall (Maisuria et al.,
2008). Crop pests control by the use of chitinase holds a great promise as an alternative to the use of chemicals (Kramer, 1997). Several years ago, statistical design experimental techniques have been employed for reaching to the most favorable conditions. It was achieved by evaluating the parameters effects and conquer the
Response surface method (RSM) is one of the popular techniques that are used widely in the biotechnology industry
(Wejse et al., 2003, Rui et al., 2009). RSM is a combination of
mathematic and statistical techniques for experiments design, building models, estimating factors effects, and looking for the optimum conditions. RSM is a convenient road for developing optimum processes with precise conditions that has also minimized production cost of many processes by efficient screening process parameters. The optimal conditions or the region that fits the operation specification can be determined by the RSM via a curvature approach (Elibol and Dursun, 2002).
Egyptian cotton leaf worm, Spodoptera littoralis
(Lepidoptera: Noctuidae), an important pest that led to vast loss in
vegetables varieties, fodder, and fiber crops (Güz et al., 2013). It is
damages wide types of crops, such as cotton, tobacco, and corn in countries located around the Mediterranean Basin and in Southeast
Asia (Balachowsky, 1972, Sneh et al., 1981). Number of moth
species offensive honey bees, honey polen and wax. Galleria
mellonella, causes serious losses to commercial beekeepers every year. Black cutworm causes an economic threat to many agricultural crops. In Pennsylvania field crops, it is most often a pest of corn. It is also cause trouble in wheat and tobacco
(Robinson et al., 2001).
The present report is an attempt to improve exochitinase
production by honey isolates Aspergillus awamori EM66 through
optimization of medium components. The enzyme was partially purified by 30% acetone. Finally, the study focused in the insecticidal activity against three serious insects which destroy valuable and economic crops, the greater wax moth larvae,
Galleria mellonella, the Egyptian cotton leaf worm, Spodoptera littoralis and the black cutworms, Agrotis ipsilon.
MATERIALS AND METHODS
Microorganisms and maintenance
The fungal used throughout this work, was previously
identified as Aspergillus awamori EM66 (Kansoh et al., 2015)
based on morphological characterization and 18S rRNA sequence
analysis. A. awamoriEM66 was routinely grown on Potato
dextrose agar (PDA) medium at 30°C and preserved at ‒ 80ºC in
50% (v/v) glycerol.
Exochitinase assay
Exochitinase activity was determined according to the
method of (Matsumoto et al., 2004) using the chromogenic
substrate p- nitro phenyl-β-D-N-acetylglucoseaminide (PNP-β-GlcNAc) as a substrate. One unit of the enzyme activity was acquainting as the enzyme amount releasing 1µmol of P-nitrophenol per minute under the specified assay conditions.
Enzyme production conditions
Initially, the basal medium (BM) for exochitinase production contained (g%): (Chitin,0.5; peptone, 0.5; yeast
extract, 0.3; NaNO3, 0.2; K2HPO4, 0.1; KCl, 0.05; MgSO4.7H2O,
0.001 pH was adjusted to 6.0.Conical flasks (250 ml) had 50 ml of (BM) were inoculated with one ml of spore suspension include
approximately (1×10⁶CFU/ml).
Inoculated flasks were incubated at 30 °C for 6 days in a rotary shaker adjusted at 200 rpm. At the end of incubation period cultures were centrifuged for 15 min using the cooling centrifuge. Culture supernatant was used as the crude enzyme. Results reported are the average values with standard
deviations.
Experimental designs Plackett–Burman design
For multivariable processes such as biochemical systems, in which numerous potentially influential factors were
involved, it is needful to analyze the process with
an initial screening design prior to optimization (Box et al., 1978).
Plackett–Burman experimental design (Plackett and Burman,1946) was used to evaluate the relative importance of various nutrients
for exochitinase production by A. Awamori EM66 in submerged
fermentation.
Fifteen components were selected for the study, each variable represented at two levels, high value (+1) and low value (−1) in 16 trials as shown in (Table 1).
Incubation time, pH, glucose, insect, soya bean, chitin,
wheat flour, NaNo3, CuSO4, MgSO4, K2HPO4, ZnSO4, FeSO4,
MnSO4, CaCl2, each row represented a trial run and each column
represented an independent variable concentrations. Plackett–
Burman experimental design was based on the first order linear model:
Y= B0 +ΣBi Xi Eq. 1
Where, Y was the response (exochitinase production),
B0 was the model intercept and Bi was the variables
estimates. The effect of each variable was estimated by following equation,
E(Xi) = 2(Σ M i +
−M i −
)/N Eq. 2
Where, E (Xi) was the effect of the tested variable. Mi
+
and Mi −
represented exochitinase production from the trials where the
variable (Xi) measured was present at high and low concentrations,
respectively and N was the number of trials in Eq. 2.
The standard error (SE) of the concentration effect was the square
root of the variance of an effect, and the significance level (p
-value) of each concentration effect was determined using student’s
t-test
t(Xi) = E (Xi)/SE Eq. 3
Central composite design
After the components identification which affecting the production by Plackett–Burman design three variables (Chitin,
MnSO4, and CaCl2 concentrations) for exochitinase were chosen
for response surface methodology of central composite design
(CCD). CCD proposed by (Adinarayana et al., 2003; Awad et al.,
2013) was selected for this study. A 23 factorial design with six
star points and six replicates at the central points were used to fit the second-order polynomial model. The experimental design consisted of 20 runs and the independent variables were studied at five different levels. The experimental design used for the study was represented in Table 3. All the experiments were done in triplicate and the average of exochitinase production obtained was
taken as the dependent variable or response (Y). The second-order
polynomial coefficients were calculated and analyzed using the ‘SPSS’ software (Version 16.0). Second degree polynomials, Eq.(4), which includes all interaction terms, were used to calculate the predicted response:
Y activity =ß0 + ß 1 X 1 + ß 2X2 + ß 3X3 + ß 11X1 2
+ ß 22X2
2
+ ß
33C3 2
+ß12X1X2 +ß 13X1X3 +ß 23X2X3 Eq. (4)
Where, Y activity was the predicted production of exochitinase (mU/ml), X1, X2 and X3 were the independent variables
corresponding to the concentration of Chitin, MnSO4, and CaCl2
respectively. ß0 was the intercept, ß1, ß2, ß3 were linear
coefficients, ß11, ß22,ß33 were quadratic coefficients, ß 12, ß 13, ß 23
were cross product coefficients. Statistical analysis of the model was performed to evaluate the variance analysis (ANOVA).
Statistical significance of the model equation was determined by Fisher’s test value, and the proportion of variance explained by the model was given by the multiple coefficient of determination for each variable. The quadratic models were represented as contour plots (3D) and response surface curves were generated by using STATISTICA (0.6).
Partial purification
The optimized culture supernatant (crude exochitinase) of Asperigillus awamori EM66 produced on the previous medium was fractionated using ethanol concentrations (30-80%). The precipitate was obtained by centrifugation (10000 xg, 15 min. at 4°C) and suspended in an appropriate volume of 0.05 M acetate buffer (pH 5.0). The enzyme activity was determined for each fraction as described before. Also, protein content was evaluated
for each fraction as described by Lowry et al., (1951).
Insect bioassay Insects
Fourth instars larvae of three lepiopteran insect pests were used to test the exochitinase efficiency. These tested insects
were the great wax moth larvae, Galleria mellonella, the Egyptian
cotton leaf worm, Spodoptera littoralis and the black cutworms,
Agrotis ipsilon. Greater wax moth culture G. Mellonella was
preserve, on a modified artificial diet according to (Metwally et
al., 2012). Cultures of the black cut worm, A. ipsilon (Huf.) and
the cotton leaf worm, S. littoralis (Boisd.) larvae were reared on
castor leaves Ricinus communis L. according to (Hussein, 2004).
Bioassay
Exochitinase application occurred through mixing with insect media. Two ml of the partial pure enzyme suspension was mixed with 50 g of the artificial diet for the greater wax moth in a
150 CC cups (Metwally et al., 2012). For the other two pests, the
leaves of castor were sprayed with 2 ml enzyme suspension and left to dry in a 9 cm Petri dish lined with no.1 Whatman-filter paper. Five insect were added for each cup and Petri dish and 15 replicates for each tested insect. The treatments were kept in 25 ± 1°C and larval mortalities were recorded after 48h.
RESULTS AND DISCUSSION
At the preliminary stage of our study, the honey isolate
A. awamori EM66 was tested for exochitinase production. The result indicated that it was exochitinase producer with activity equal (270 mU/ml) and 176.36 mg protein. Consequently, the specific activity was evaluated to be 1.531 U/mg by using the basal medium under submerged fermentation condition.
Production of chitinase by Aspergillus spp. was studied in many
reports as a potential producer for both endochitinase and
exochitinase (Vionis et al., 1996, Xia et al., 2001, Nawani et al.,
2002, Rattanakit et al., 2007, Brzezinska and Jankiewicz, 2012).
Exochitinase production optimization by multi-factorial experiments
In this work a sequential optimization approaches were used. The first trail aimed to screen the nutritional factors
influencing growth of A. awamori EM66 with respect to
exochitinase production. The second step aimed to optimize the influencing factors which controlling enzyme production process.
Estimation of the factors affecting exochitinase productivity Firstly, the Plackett–Burman design was done to explain the relations between different medium components. Fifteen
factors (X1-X15) included culture conditions and medium
components were selected for optimization process. Exochitinase average activity for the different attempts were formulated as mU /ml and represented in Table 1. Main effect was estimated as the difference between both the averages of measurements made at the high level (+1) and at the low level (-1) of that factor. Table 1 showed a wide divergence from 876 to 2045 mU /ml on exochitinase activity. Factors effects on the enzyme activity were estimated and showed graphically in Fig. 1. It was introduced the view for factor ranking estimated by Plackett–Burman design. This variation reflected medium optimization significant to reach high productivity. Data analysis from Plackett–Burman tested contained a first order (main effects) model. Regression coefficients analysis for examined variables for the exochitinase were :incubation time, pH, glucose, dried insects, soya bean,
chitin, wheat flour, NaNO3, CuSO4, MgSO4, K2HPO4, ZnSO4,
FeSO4, MnSO4, CaCl2. Chitin, MnSO4, CaCl2, FeSO4, NaNO3,
K2HPO4, CuSO4 and incubation period showed positive effect on
exochitinase activity. Wheat flour, soya bean, glucose, pH,
MgSO4, ZnSO4 and dried insect, were contributed negatively. First
order model explained the link between the fifteen factors and the exochitinase activity which presented as follows:
Yactivity=853.0953+4.532X1+38.26265X2‒987.144X3+4152.63X
4‒528.983X5‒9.469752X6
‒373.737X7‒1768.74X8+26445.02X9‒529.596X10 + 2311.588X11+
193353.7X12+181015.2X13‒10997.6X14 + 4499.06X15 Eq.(5)
Table 2 revealed the t-test, p effect and confidence level. The variables reported confidence level above 98% in the Plackett–Burman design which were selected for further
optimization; they were (Chitin, MnSO4 and CaCl2). Many reports
showed the importance of chitin as a significant factor affecting chitinase production. It was reported that chitin is an essential
factor influencing chitinase production by Streptomyces lividans
(Vionis et al., 1996). In similar, colloidal chitin was proved to be
the best substrate for production of chitinase in Microbispora sp.
(Nawani et al., 2002).
Fig. 1: Effect of culture conditions and medium composition on exochitinase (mU/ml) produced by Aspergillus awamori EM66
Table 2. Statistical analysis of Plackett- Burman design showing coefficient values, effect, t-and P- values for each variable on exochitinase analysis
Exochitinase analysis
Variables
C
o
e
ffi
c
ie
n
t
Effe
c
t
t
-te
st
P
-v
a
lu
e
C
o
n
fi
d
e
n
c
e
le
v
e
l
(%)
Intercept 853.0953
Incubation period 4.532 6.75 0.086573 0.4661 53
pH -38.26265 -190 -2.436866 0.0139 98
Glucose -987.144 -297 -3.809206 0.0009 99 Insect -4152.63 -386 -4.950686 0.0001 99 Soya bean -528.983 -216 -2.770332 0.0071 99
Chitin 9.469752 206 2.642076 0.0092 99
White Flour -373.737 -216 -2.770332 0.0071 99
NaNO3 1768.74 158 2.026446 0.0304 96
CuSO4 26445.02 53 0.679757 0.2535 74
MgSO4 -529.596 -134 -1.718632 0.0531 94
K2HPO4 2311.588 57 0.73106 0.238 76
ZnSO4 -193353.7 -180 -2.30861 0.0178 98
FeSO4 181015.2 180 2.30861 0.0178 98
MnSO4 10997.6 307 3.937462 0.0007 99
CaCl2 4499.06 203 2.603599 0.01 99
Chitin also was an important factor for chitinase
our result, MnSO4 was found to enhance chitinase production by
Aspergillus terreus (Ghanem et al., 2010). It was also mentioned as one of the most important factors affecting chitinase production by Bacillus thuringiensis (Sarrafzadeh and Hussein, 2012). On
contrary, (Sharaf 2005) reported that MnSO4was an inhibitor for
chitinase production by Alternaria alternate. Our results also
showed that CaCl2 activated the production of exochitinase.
Similarly, it was found that CaCl2 activated Pantoea dispersa
chitinase production (Gohel et al., 2004). Building on previous
results, a medium including (g %), (glucose, 0.2; insect, 0.1;
soyabean, 0.2; wheat flour, 0.2; NaNO3, 0.02; CuSO4, 0.001;
MgSO4, 0.05; K2HPO4, 0.2; FeCl3, 0.001; CaCl2, 0.05 at pH; 8). It
was used as a plan medium for further investigations and the cultures were incubated for 6 days.
Optimization of the culture conditions by central composite design
For searching to the proper concentration for the most
effected medium components (chitin, MnSO4 and CaCl2) showed
confidence level with about 98% supported the highest chitinase productivity in the Plackett–Burman design. CCD experimental was employed coded and un-coded level of the three independent variables was recorded in Table 3. Also, the results in table.3. referred to the CCD experimental plan, the observed and predicted exochitinase production. Multiple regression analysis of the experimental data reported the following second order polynomial Eq. (6):
Yactivity= ‒4462.211+ 4591.092 X1+ 1.160E6 X2+62355.551X3
‒604.012X1
2 ‒
5.749E7X2
2 ‒
87493.312X3
2
‒74853.051X1X2‒16412.830X1X3‒3.522E6X2X3 Eq.6
Where Y activity was the response (exochitinase production)
and X1, X2 and X3 were the coded values of the test variables
(chitin, MnSO4 and CaCl2) respectively. The graphical
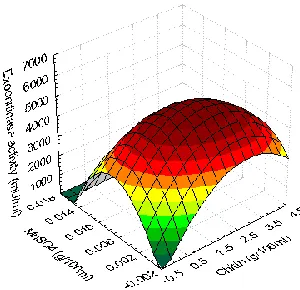
representations of the regression equation was represented in the three-dimensional response surface and the two-dimensional contour plots graphs. They were fundamentally important for showing the relations between the interaction effects of the estimated factors and the response value. Fig. 2. A–C showed the
response surface and contour plots of chitin and MnSO4, MnSO4
and CaCl2, also chitin and CaCl2 on exochitinase production
respectively, the other component was fixed at zero level. Regression analysis results are shown in Table 4. analyzing the results of central composite designed experiments data. It is recognized the increase in t-value magnitude, the decrease in p-value, resulting more consideration of the corresponding coefficient (Aravindan and Viruthagiri, 2007). This implies that the variable with the largest effect represented in the linear effect
of the CaCl2 concentration and the squared term of the CaCl2
concentration. In this finding, it was reported that CaCl2, played a
role to predict optimum chitinase production (Gohel et al., 2004).
In this finding, it was reported that CaCl2, played a role to predict
optimum chitinase production (Gohel et al., 2004). Table 5.
showed that F-value obtained by (ANOVA) analysis was (5.622) confirming the model significant. Moreover Prob> F (0.006) was
less than 0.05 showed highly significant. (R2) was evaluated as
0.914 for exochitinase activity (a value of R2> 0.75 insuring the
model aptness). This result indicated that the statistical model recorded 91.4% of variability in the response. Model goodness
could be tested by the determination of coefficient (R2) and
correlation coefficient (R). The R2 value is always between 0 and
1. The closer the R2 to 1, referred to model powerful and better
predicted response (Munk et al., 1963). R value (0.8340)
concerning (Eq. 6) was near 1. This pointed to a close coincide among the experimental results and the theoretical values determined by equation model.
Fig 2. A. Response surface plot of exochitinase production by Aspergillus awamori EM66 showing the interactive effects of different concentrations of chitin and MnSO4 at X3= 0
Fig 2. B. Response surface plot of exochitinase production by Aspergillus awamori EM66 showing the interactive effects of different concentrations of CaCl2 and MnSO4 at X1= 0
Model Validation
Validation was carried out under optimized medium conditions. It was predicted by the polynomial model. The experimental exochitinase production of 5886mU/ml was recorded. This result was close to its predicted value (5200mU/ml) after 6 days of fermentation validating the proposed model. An overall 22.2fold increased in exochitinase production was being achieved after RSM application. This reflected the success and value of optimization process. Many reports were mentioned in optimization of exochitinase productivity by response surface
methodology. Exochitinase produced by marine isolate Pantoea
dispersa increased about 3.9% after optimization by RSM (Gohel
et al., 2004). Aeromonass chubertii chitinase increased about 1.6
% more than primary medium (Liu et al., 2013). On the other
hand, chitinase produced by Streptomyces sp. Da11 associated
with the South China Sea sponge Craniella australiensis
increased about 39% with (RSM) optimization (Han et al., 2008).
The optimization strategy led to an increased in chitinase
production in the strains Streptomyces sp. NK1057, NK528 and
NK951 by 29, 9.3 and 28%, respectively (Sarrafzadeh and Hussein, 2012).
Exochitinase productivity by Aspergillusa wamori EM66
under submerged fermentation was effective and worthy optimized by using Plackett–Burman design and central composite design for selecting the statistically important factors and evaluation their optimal concentrations and illustrated graphically by second order polynomial model prepared by central composite design. For determination the relationship between the three factors and the exochitinase yield. Final components concentrations optimized with RSM medium were g%: (Glucose, 0.2; insect,0.1;
Soyabean,0.2; Chitin,1.0; Wheat flour,0.2; NaNO3,0.02; CuSO4,
0.001; MgSO4, 0.05; K2HPO4,0.2; FeCl3,0.001; MnSO4, 0.004;
CaCl2, 0.1).The initial pH was limited to 8 and the cultures were
incubated for 6 days.
Table 3: Central composite design (CCD) consisting of 20 experiments for three experimental factors in coded and actual values for the production of exochitinase by Aspergillus awamori EM66.
Exochitinase (mU/ml) Factors levels
Trial
No. Chitin (X1) MnSO4 (X2) CaCl2 (X3)
Predicted Experimental Actual (g%) Coded Actual (g%) coded Actual (g%) Coded 1834 1072.00 ±79 .0.0 -1 .0.... -1 .00 -1 1a 5000 4445.80 ± 22
.0.0 -1 .0.... -1 .0. +1 .a 4063 4112.36 ± 56
.0.0 -1 .0.... +1 .00 -1 3a 6555 5574.40 ±16 .0.0 -1 .0.... +1 .0. +1 4a 5618 5227.39 ± 136
.0. +1 .0.... -1 .00 -1 0a 4094 3890.07 ± 67
.0. +1 .0.... -1 .0. +1 6a 4678 3778.93 ± 14
.0. +1 .0.... +1 .00 -1 7a 3477 3445.49 ± 124
.0. +1 .0.... +1 .0. +1 .a 3834 3112.06 ± 17
.00 0 .0..4. 0 .0.0 -2 9b 4147 4556.94 ± 51
.00 0 .0..4. 0 40. +2 0.b 3919 4401.55 ± 78
.00 0 .0..0. -2 00. 0 00b 523 514.56 ± 5
.00 0 .0.06 +2 00. 0 0.b 3687 3290.10 ± 73
.0..0 -2 .0..4. 0 00. 0 03b 1688 2058.24 ± 102
.04 +2 .0..4. 0 00. 0 04b 5256 5998.91 ± 374
.00 0 .0..4. 0 00. 0 00c 5256 5968.90 ± 124
.00 0 .0..4. 0 00. 0 06c 5256 5986.05 ± 16
.00 0 .0..4. 0 00. 0 07c 5256 5994.62 ±282 .00 0 .0..4. 0 00. 0 0.c 5256 5977.47±181.11 .00 0 .0..4. 0 00. 0 09c 5256 5998.33 ±249 .00 0 .0..4. 0 00. 0 20c
a Fractional 23 factorial design, b star points, c central points.
Table 4: Model coefficients and Analysis of variance (ANOVA) test estimated by multiples linear regression for exochitinase.
Term Regression coefficient Standard error t- test P-value
Intercept -4462.211 1958.690 -2.278 0.046
X1 4591.092 1423.223 3.226 0.009
X2 1.160E6 355805.862 3.261 0.009
X3 62355.551 14232.234 4.381 0.001
X12 -604.012 214.858 -2.811 0.018
X22 -5.749E7 1.343E7 -4.281 0.002
X32 -87493.312 21485.780 -4.072 0.002
X1X2 -74853.051 144157.809 -.519 0.615
X1X3 -16412.830 5766.312 -2.846 0.017
X2X3 -3.522E6 1.442E6 -2.443 0.035
F value =5.622; P value = 0.006; R2= 0.914; R=.834.
Table 5: Summary of the mortality percentages of the three lepidopteran pests after treatment with crude exochitinase.
Pest % Larval Mortality % Pupal Mortality % Total Mortality
Galleria mellonella 84 8 92
Spodopteralittoralis 76 10.67 86.67
Enzyme partial purification
The crude enzyme was fractionated by using absolute ethanol (30-80%) W/V. The most promising fraction was obtained at 30% this result suggested that the exochitinase had low molecular weight. Its total activity and protein content recorded 23.34 U and 0.837 mg, respectively. This result referred to about 18 times purification fold compared to the preliminary crude culture filtrate. Accordingly, the specific activity was calculated to be 27.89 U/mg. The high specific activity of this enzyme gave it tremendous interest; since it referred that it approaches to purity.
Efficiency of the exochitinase against some lepidopteran pests The partial pure enzyme was tested against three serious
lepidopteran pests, larvae of the black cutworm, A. ipsilon, larvae
of the Egyptian cotton leaf worm, S. littoralis and larvae of the
greater wax moth, G. mellonella. The results in table 5.showed that
exochitinase had a great effect on the larvae of the three tested pests. The maximum effect of the enzyme was noticed with
exochitinase addition to the artificial diet of G. mellonella with a
mortality percentage of 84% for the larvae and 8% for pupae and the total percentage reached to 92%. The treated larvae stopped feeding and suffered from recognizable blacking and severe rot which leads to their death (Fig.3, 4).
Fig 3: Effect of partial purified exichitinase on larvae of the great wax moth, Galleria mellonella,A. larva after treatment, B. larva without treatment.
Fig 4: Effect of partial purified exichitinase on different stages of larvae of the great wax moth, Galleria mellonella
When the exochitinase sprayed on castor leaves and fed
to the cotton leaf worms, 86.67% total mortality of S. littoralis was
recorded. Meanwhile, less effect of the enzyme (the total mortality
reach to 65.67%) was noticed with the treatment of larvae of A.
ipsilon with the enzyme. Great attention to the chitinolytic enzymes has been progress due to their possible involvement as defensive agents against chitin-including pestiferous and
pathogenic organisms, like insects, nematodes, and fungi (Munk et
al., 1963, Carr and Klessig, 1989, Linthorst, 1991, Sahai and
Manocha, 1993). The peritrophic membrane and exoskeleton of insects act as physicochemical barriers to environmental hazards and predators. Both are composite materials made up primarily of chitin and protein, Chitinase of family 18 and 19 have a catalytic reaction and can be described as being similar to lysozyme and
chitosanase in its mode of action (Sahai and Manocha, 1993).
Another effect of chitinase could be revealed to that the microbial chitinases could be partially digesting the peritrophic membrane. This helping the microbes and their toxins in peritrophic
membrane penetration (Smirnoff and Valero, 1983, Sneh et al.,
1983, Shahabuddin and Kaslow, 1993, Wiwat et al.1996,
Chandrasekaran et al., 2012).
CONCLUSIONS
This study is aiming to improve the exochitinase
productivity for honey isolate Aspergillus awamori EM66.
Statistical experimental design was used for optimization process. Estimation the constituents optimal concentrations have clear influencing on enzyme productivity can be obtained by a highly significant quadratic polynomial equation obtained by the central composite design. A high similarity between the predicted and experimental results was noticed. This reflected RSM accuracy and applicability to optimize the exochitinase production process. Mortality (92%) was recorded when partial pure enzyme was
applied to the diet of both larva and pupal of Galleria mellonella
wax, followed 86.67% and 65.67% mortality when fungal
exochitinase was applied for larva of Spodoptera littoralisn and
Agrotis ipsilon respectively. Aspergillus awamori EM66 exochitinase could be serving as an effective biopesticide to control harmful pests which destroy importantly economic crops instead of hazardous chemical pesticide.
Financial support and sponsorship: Nil.
Conflict of Interests: There are no conflicts of interest.
REFERENCES
Adinarayana K, Ellaiah P, Srinivasulu B, Bhavani R, Adinarayana G. Response surface methodological approach to optimize the nutritional parameters for neomycin production by Streptomyces marinens is under solid-state fermentation. Process Biochem, 2003; 38: 1565 –1572.
Aravindan R, Viruthagiri T. Sequential optimization of culture medium for extracellular lipase production by Bacillus spharicus using statistical methods. J Chemical Technol Biotechnol, 2007; 8: 460 – 470.
Mm-6 isolated from breast milk and its immobilization on grafted alginate beads. Carpohydr Polym, 2013; 93: 740– 746.
Balachowsky AS. Entomologie Appliquée à l’Agriculture, Vol.IL épidoptères. Paris: Masson, 1972; 1131–1133.
BoxGEP, Hunter, WG, Hunter JS. Statistics for Experiments. An introduction to design. Data analysis and model analysis. John Wiley and sons : New York 1978; 291–334.
Brzezinska MS , Jankiewicz U. Production of Antifungal Chitinase by Aspergillus niger LOCK 62 and Its Potential Role in the Biological Control. Curr Microbiol, 2012; 65: 666–672.
Carr JP, Klessig D F. Genetic Engineering — Principlesand Methods. 11, ed J. K. Setlow,1989; p. 65. Plenum Press, New York.
Chandrasekaran R, Revathi K, Nisha S, Kirubakaran SA, Narayanan SS, Nathan SS.Physiological effect of chitinase purified from
Bacillus subtilis against the tobacco cutworm Spodoptera litura Fab. Pesticide Biochem and Physiol, 2012; 104: 65–71.
Chuan LD. Review of fungal chitinases. Myc, 2006; 161, 345-366.
Crosby, A.W. Ecological Imperialism: The Biological Expansion of Europe, 900–1900. Cambridge University Press, 2004; 188. ISBN 0-521-54618-4.
Elibol M, Dursun O.Response surface analysis of lipase production by freely suspended Rizopus arrhizus. Process Biochem, 2002; 38: 367–372.
Esawy MA, Ahmed, EF, Helmy WA, Mansour NM, El-Senousy WM, and El-Safty MM. Production of levansucrase from novel honey
Bacillus subtilis isolates capable of producing antiviral levans. Carbohydr Polym, 2011; 36: 823-830
Esawy MA, Abdel-Fattah AM, Ali MM, Helmy WA, Tai HAA, Hashem A.M.; Awad E.A. Levansucrase optimization using solid state fermentation and levan biological activities studies. Carbohydrate polymer 2013;96:332-41.
Esawy M A, Mansour S H, Ahmed E F Hassanein NM and El Enshasy HA. Characterization of extracellular dextranase from a novel halophilic Bacillus subtilisNRC-B233b a mutagenic honey Isolate under solid state fermentation E j chem.2012; 9: 1494-1510.
Ghanem KM, Al-Garni SM, Al-Makishah N H. Statistical optimization of cultural conditions for chitinase production from fish scales waste by Aspergillus terreus. African J Biotechnol, 2010;9: 5135-514.
Gohel V,Megha C, Vyas P, Chhatpar HS. Strain improvement of chitinolytic enzyme producing isolate Pantoea dispersa for enhancing its biocontrol potential against fungal plant pathogens Ann Microbiol. 2004;54: 503-515.
Gooday GW, The ecology of chitin degradation. Advances in Microbial Eco, 1990; 11: 387–430.
Graham LS, Sticklen MB. Plant chitinases. Can J Bot M, 1994; 72: 1057-1083.
Güz N, Dağeri A, Erdoğan T, Mousavi M, Bayram S, Gürkan MO. Transcriptional profiling of transferrin gene from Egyptian cotton leaf worm, Spodoptera littoralis. 2013. 37: 582-590 Turk J Biol.
Han Y, Zhiyong Li, Miao X, Zhang F. Statistical optimization of medium components to improve the chitinase activity of Streptomyces
sp. Da11 associated with the South China Sea sponge Craniella australiensis. Process Biochem, 2008; 43: 1088–1093.
Hussein MA. Utilization of entomopathogenic nematodes for the biological control of some lepidopterous pest Entomology (BioControl). Entomology Dept. Faculty of Science, Ain Shams University,2004; Egypt Pp.203.
Kramer KJ, Muthukrishnan S, Lowell J, White F. Chitinases for insect control, in: N. Carozzi, M. Koziel (Eds.), Advances in Insect Control: The Role of Transgenic Plants, Taylor and Francis, Bristol.1997; 185–193.
Kansoh AL, Kheiralla ZH, Ahmed HA, Kahil1 TAK, Abd El-Hameed EK and Esawy* MA. Morphological, Molecular and Biochemical Comparative Studies of Two Novel Fungal Honey.Br Microbiol Res J, 2015; 5: 152-168.
Linthorst H J M.Pathogenesis-related proteins of plants. Crit. Rev Plant Sci, 1991; 10:123–150.
Liu CL1, Lin TH, Juang RS. Optimization of recombinant hexaoligochitin-producing chitinase production with response surface methodology.2013;Int J Biol Macromol 62:518-22.
Lowry, OH, Rosebrough, N. J., Farr, A. L., & Randall, R. J. Protein measurement with folin phenol reagent. The Journal of Biological Chemistry, 1951;193: 265–275.
Maisuria VB, Gohel V, Mehta AN, Patel RR ; Chhatpar HS. Biological control of Fusarium wilts of pigeonpea by Pantoea dispersa, a field assessment Ann Microbiol, 2008; 58:177–185.
Matsumoto Y, Castañeda GS, Revah S, Shirai K. Production of β-N-acetyl hexosaminidase of Verticillum lecanii by solid state fermentation and submerged fermentation utilizing shrimp waste silage as substrate and inducer. Process Biochem. 2004; 39: 655-671.
Metwally HMS, Hafez GA, Hussein MA, Salem HA, Saleh, M M E. Low Cost Artificial Diet for Rearing the Greater Wax Moth, Galleria mellonella L. (Lepidoptera: Pyralidae) as a Host for Entomopathogenic Nematodes. Egypt J Biol Pest Control. 2012; 22: 15-17.
Munk, V, Pásková J, Hanus, J. Glucose oxidase of Aspergillus niger. Folia Microbiol, 1963; 8: 203 –214.
Nawani NN, Kapadnis BP, Das AD, Rao, AS, Mahajan SK. Purification and characterization of a thermophilic and acidophilic chitinase from Microbispora sp. V2. J Appl Microbiol. 2002; 93:965–975.
Nawani NN, Kapadnis BP (2005) Optimization of chitinase production using statistics based experimental designs. Process Biochem, 2005; 40: 651–660.
Plackett RL, Burman JP. The design of optimum multifactorial experiments. Biometrika,1946; 33: 305-25.
Rattanakit N, Yano SH, Plikomol A, Wakayama M, Tachiki T Utilization of shellfish waste as a substrate for solid-state cultivation of
Aspergillus sp. J Biosci Bioeng, 2007; 103: 535–541.
Ren X, Yu D, Han S, Feng Y. Optimization of recombinant hyperthermophilic esterase production from agricultural waste using response surface methodology. Bioresour Technol.,l97: 2006; 2345–2349. Robinson GS, Ackery PR, Kitching IJ, Beccaloni, GW & Hernández LM.HOSTS - A Database of the World's Lepidopteran Hostplants. Natural History Museum, London 2001.
Rui L, Wei-chang C, Wei-peng W, Wen-yan T, Xue-guang Z. Extraction, characterization of Astragalus polysaccharides and its immune modulating activities in rats with gas. Carbohydr Polym, 2009; 17: 738-742.
Sahai A S, Manocha M S. Chitinases of fungi and plants: their involvement in morphogenesis and host–parasite interaction. FEMS Microbiol Rev, 1993; 11: 317–338.
Shahabuddin M, Kaslow DC. Chitinase: a novel target for blocking parasite transmission? Parasitol. Today, 1993; 9: 252–255.
Sharaf EF. A potent chitinolytic activity of Alternaria alternate
isolated from Egyptian black sand. Polish j Microbiol, 2005; 54: 145-151.
Sarrafzadeh, Hussein M. Nutritional Requirements of Bacillus thuringiensis During Different Phases of Growth, Sporulation and Germination Evaluated by Plackett-Burman Method. Iran. J Chem Chem Eng; 2012; 31: 131-136.
Smirnoff WA, Valero JR. Characteristic of a highly concentrated Bacillus thuringiensis formulation against spruce budworm,
Choristoneura fumiferana (Lepidoptera: Tortricidae). Can. Entomol, 1983; 115: 443–444.
Singh AK, Mehta G, Chhatpar HS. Optimization of medium constituents for improved chitinase production by Paenibacillus sp. D1 using statistical approach. Lett. Appl. Microbiol. 2009; 49: 708–714.
Sneh B, Schuster S, Broza M. Insecticidal activity of Bacillus thuringiensis strains against the Egyptian cotton leaf worm, Spodoptera littoralis Boisd. (Lep.:Noctuidae). Entomophaga, 1981; 26: 179–190.
Sneh, B.; Schuster, S.; Gross, S. Improvement of the insecticidal activity of Bacillus thuringiensis var. entomocidus on larvae of
Spodoptera littoralis (Lepidoptera, Noctuidae) by addition of chitinolytic bacteria, aphagostimulant and a UV-protectant. Z. ang, Entomology. 1983; 96:77–83.
Binding Sites from the Hyperthermophilic Archae on Pyrococcus kodakaraensis KOD1. Appl Environ Microbiol. 1999; 65: 5338–5344.
Vionis AP, Niemeyer F, Karagouni AD, Schrempf H. Production and processing of a 59-kilodalton exochitinase during growth of Streptomyces lividans carrying p CHIO12 in soil microcosms amended with crab or fungal chitin. Appl Environ Microbiol. 1996; 62, 1774–1780.
Wejse PL, Ingvorsen K, Mortensen KK. Xylanase production by a novel halophilic bacterium increased 20-fold by response surface methodology. Enzyme Microb Technol. 2003; 32: 721-727.
Wiwat C, Lertcanawanichakul M, Siwayapram P, Pantuwatana S, Bhumiratana A. Expression of chitinase-encoding genes from
Aeromonas hydrophila and Pseudomonas maltophila in Bacillus thuringiensis sub sp. israelensis. Gene, 1996; 179: 119–126
Xia G., C. Jin, J. Zhou, S.Yang , S. Zhang , C. Jin. 2001. Novel chitinase having a unique mode of action from Aspergillus fumigatus YJ-407.Eur. J. Biochem. 2001; 268: 4079–85.
How to cite this article: