ISSNll1007-0214 0?/?? pp???–??? DOI: 10.26599/BDMA.2018.9020013 Volume 1, Number 1, Septembelr 2018
Big Data-Oriented Novel Background Subtraction Algorithm for
Urban Surveillance Systems
Ling Hu, Qiang Ni*, Feng Yuan
Abstract:Due to the tremendous volume of data generated by urban surveillance systems, big data-oriented low-complexity automatic background subtraction techniques are in great demand. In this paper, we propose a novel
automatic background subtraction algorithm for urban surveillance systems in which the computer can automatically
renew an image as the new background image when no object is detected. This method is both simple and robust
with respect to changes in light conditions.
Key words:Big data, background subtraction, urban surveillance systems
1
Introduction
Big data research is attracting a great amount of attention due to the seemingly infinite generation of huge data worldwide. As one example, big data-oriented techniques have emerged as an important research topic for smart cities and urban surveillance systems [1][2].
Urban surveillance systems are important applications for smart cities [3][4]. These systems use automated object detection methods whereby cameras are installed to automatically detect vehicles and other objects. Because of the tremendous volume of data generated by urban surveillance systems, to obtain useful information from the huge numbers of images and videos, low-complexity techniques that can automatically identify objects from various sources are in high demand. Hence, automated or so-called automatic object detection algorithms have become
•L. Hu and Q. Ni are with the School of Computing and Communications, Lancaster University, InfoLab21, Lancaster, LA1 4WA. E-mail:{l.hu, q.ni}@lancaster.ac.uk
•F. Yuan is with the Chinese Academy of Sciences Smart City Software Co. Ltd., China. E-mail: [email protected] and also with Institute of Software Application Technology, Guangzhou & Chinese Academy of Sciences, Guangzhou, China. E-mail: [email protected]
∗Qiang Ni is the corresponding author.
Manuscript received: 2017-12-30; accepted: 2018-1-3
an important research topic. Currently, the algorithms under investigation can be classified into three main groups: frame difference, background subtraction and optical flow calculation methods.
The frame difference algorithm is used to analyze the image sequences of two or more adjacent frames to identify moving targets by calculating the differences in continuous frames. For every pixel, if the difference is larger than a set threshold, the result is labelled 1, else 0. The larger is the threshold value, the less noise there is [5][6]. To detect and track moving targets, some authors have proposed combining the frame difference method with the particle filter algorithm [7]. The shortcoming of the frame difference method is that it is not able to detect nonmoving objects, since there is no difference between adjacent frames.
model noisy backgrounds, to address this shortcoming, the researchers in [9] utilize an advanced distance measure based on support weights and a histogram of gradients to achieve background suppression. Current background subtraction methods (such as GMMs) are also limited by their high computational complexity [8][9], e.g., the large number of calculations required limits their practical application in real-time as reconstructions and background updates take too long.
The third type of automatic object detection algorithm is based on optical flow (OF) calculation [10]. This method estimates motion scenes and combines similar motion vectors to detect moving objects. However, the OF method is also very computationally expensive. Another major shortcoming of the OF method is that it assumes that an object is always moving, which is not necessarily true.
In this paper, we propose a novel low-complexity automatic background subtraction method that is computationally efficient and does not require that objects be continuously moving.
2
OUR PROPOSED METHOD
The basic idea of our proposed algorithm is to detect whether or not there are objects (e.g. cars, humans) in each image. If no object is detected, we update the current image as the background. In this way, the background is renewed in real time, which is robust with respect to changing light conditions. Compared to existing methods, which are computationally expensive, our method is computationally efficient. Another advantage of our method is that it does not depend on object motion; even nonmoving objects are detected automatically. In [11], we proposed a simple filter for detecting vehicles or license plates from captured images. We found that an object (for example, a vehicle or human being) is normally the highest energy frequency aspect of an image and the energy frequency curves decrease sharply outside object boundaries. In this paper we improve filter design for detecting and updating the background. Our proposed filter can automatically determine whether there are objects in the images.
2.1 Pre-treatment of the captured image
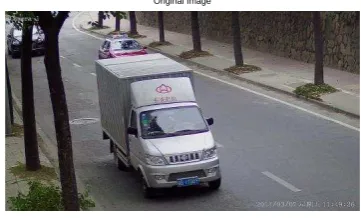
Taking the example shown in Figure 1, our objective is for a computer to automatically determine whether there are objects on a road based on this captured image. To do so, the computer determines whether or not this
image can be used as a background. Using the pre-treatment method proposed in [11], we first transfer the original image into a gray-scale image to reduce the image data that must be calculated.
Original Image
Fig. 1 Original image.
After generating the grayscale image, we calculate its gradient using Px to denote differences in the x
direction (horizontal) and Py to denote differences
in the y direction (vertical). As in [11], after calculating the gradients of both the horizontal and vertical directions, for every pixel, we obtain the overall gradient of each pixel as follows:
P = q
Px
2 +Py
2
[image:2.595.332.513.170.279.2]. (1)
Figure 2 shows the gradient of this grayscale image, in which we can see that some large areas of constant grayscale fade into darkness due to the slow gradient movement. Only the outline of vehicles and some other background objects are visible.
Gradient of The Grey Image
Fig. 2 Gradient of grayscale image.
2.2 Design of our effective filter
[image:2.595.333.513.532.639.2]Z ∞
−∞
δ(x−a)ϕ(x)dx=ϕ(a). (2)
This means that the functionδ(x−a) can be utilized to filter out another functionϕ(x) at thex-axis when x=a. We use this property to filter out high frequency areas in an image.
We use a matrix array to calculate intercorrelations in an image. Since the matrix array is centrosymmetric, the image intercorrelation process can be considered to be a convolution process as follows:
F(n) =G(n)∗h(n) = +∞
X
i=−∞
G(i)h(n−i), (3)
where G(n)represents the original image andh(n)
is the matrix array. F(n) denotes the image after convolution. As we know, the results obtained after convolution reflect the overlapping relationship between two convolution functions. In mathematics, convolution can be regarded as a weighted summation.
In the filtered image F(n), since spectrum information is displayed on the horizontal axis as brightness, by simply choosing the middle horizontal array line of the filtered image, we obtain the one-dimensional brightness values. These values clearly reflect high frequency areas of objects on the horizontal axis. Our proposed filter successfully reduces the two-dimensional image into a one-dimensional curve, which significantly reduces the data required.
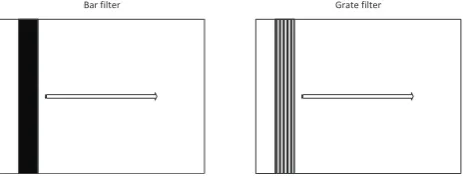
Since the matrix filter proposed in [11] has a bar shape, in this paper, we refer to it as the bar filter. As we know, in the bar filter, all the numbers are set as 1’s and can be considered to be constituted by some line arrays. The bar filter incurs a lot of calculations. To reduce the computational load and still obtain satisfactory convolution results, we propose a new and improved filter in which we have removed some line arrays from the original matrix array. As such the new filter looks like a grate, so we refer to it as the grate filter, a diagram of which is shown in Figure 3.
Bar filter Grate filter
Fig. 3 Bar filter (left) and our proposed grate filter (right).
In this study, we set the width of the bar filter as eight, which means there are eight columns of 1’s integrated into this filter. In the grate filter, we set the first and the fourth columns as 1’s, which means there are three columns of 0’s between the 1’s columns and a total of only two columns of 1’s remaining. From the definition of convolution, we know that in this case the computational load of the grate filter is just one quarter that of the original bar filter. Therefore, it is clear that the first advantage of the grate filter is its significant reduction in the computational load.
0 200 400 600
0.1 0.2 0.3 0.4 0.5 0.6 0.7 0.8 0.9 1
x−axis brightness
Object Detected (with bar filter)
Fig. 4 Horizontal axis’ brightness values and identified result (with bar filter).
0 200 400 600
0.1 0.2 0.3 0.4 0.5 0.6 0.7 0.8 0.9 1
x−axis brightness
Object Detected (with grate filter)
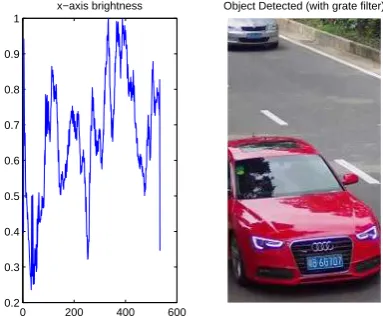
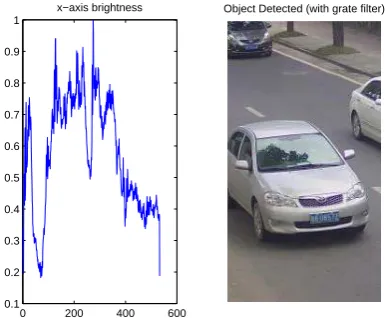
Fig. 5 Horizontal axis’ brightness values and identified result (with grate filter).
[image:3.595.322.518.269.428.2] [image:3.595.323.518.495.653.2] [image:3.595.53.285.668.757.2]values obtained in thex-axis are shown in Figures 4 (bar filter) and 5 (grate filter).
We simply scan the horizontal brightness values from left to right and choose the threshold at 0.5 for the horizontal axis. To eliminate the impact of unwanted brightness, we check the widths between the horizontal points against a threshold value and discard very narrow results. If at least one of the detected widths is wider than the predefined width, the system indicates the presence of at least one object in this image. In this case, since at least one object (i.e. a vehicle) is detected, the computer reaches the decision: “Object Detected”, which means the original image cannot be used to renew the background.
Figures 4 and 5 both indicate that at least one object was detected. Considering the reduction in computational complexity, the grate filer outperforms the bar filter. Moreover, the grate filter obtains more detail in the brightness values of the horizontal axis.
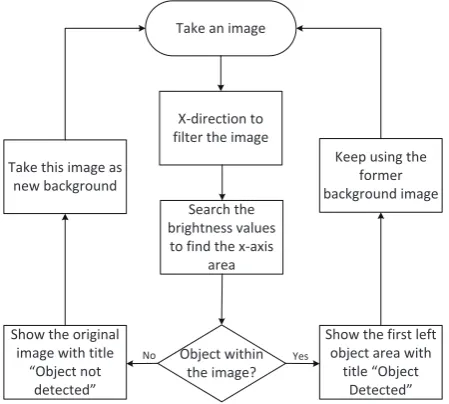
[image:4.595.320.518.356.656.2]2.3 Flow chart of the proposed algorithm
Figure 6 shows the flow chart of our proposed method.
Take an image
X-direction to filter the image
Search the brightness values
to find the x-axis area
Object within the image?
Yes
Show the original image with title
“Object not detected”
Show the first left object area with
title “Object Detected”
No
Take this image as new background
Keep using the former background image
Fig. 6 Flow chat showing the process of our proposed background subtraction method.
The time period for capturing a new image may range from several seconds to several minutes, as the setting is dependent on the actual situation in the surveillance area.
In the process of searching for objects in an image, sometimes several different objects are detected. Because our task is to decide whether or not this image can be used to renew the background, it is not necessary to show all the objects in a resulting image. We use
a left-to-right rule and choose to show the first object detected in the image. In this situation, the previous background image is unchanged, and after a set time period, a new image will be taken into consideration.
On the other hand, when no object is detected in the image, we choose this image to update the background image, and our program shows the original image with the lable “Object not detected”. Then the same action is repeated, i.e., after the set time period, a new image will be taken into consideration.
3
EXPERIMENTAL RESULTS
Next, we tested our filters to test their performance on different images. We used various images captured on different roads to test the two filters. Figures 7 to 15 show the original images and identified results.
Original Image
Fig. 7 Cars on the road.
0 200 400 600
0.2 0.3 0.4 0.5 0.6 0.7 0.8 0.9 1
x−axis brightness Object Detected (with bar filter)
Fig. 8 Horizontal axis’ brightness values and selected car (with bar filter).
[image:4.595.54.279.409.611.2]0 200 400 600 0.2
0.3 0.4 0.5 0.6 0.7 0.8 0.9 1
x−axis brightness Object Detected (with grate filter)
Fig. 9 Horizontal axis’ brightness values and selected car (with grate filter).
first detected red car. The difference between them is that the grate filter shows more details in the horizontal axis’s brightness values. Both images obtain the result “Object Detected”, which means that the original image cannot be used as a background image.
[image:5.595.321.520.98.266.2]Original Image
Fig. 10 Vehicles on the road.
0 200 400 600
0.2 0.3 0.4 0.5 0.6 0.7 0.8 0.9 1
x−axis brightness
Object Detected (with bar filter)
Fig. 11 Horizontal axis’ brightness values and selected bus (with bar filter).
0 200 400 600
0.2 0.3 0.4 0.5 0.6 0.7 0.8 0.9 1
[image:5.595.71.263.105.266.2]x−axis brightness Object Detected (with grate filter)
Fig. 12 Horizontal axis’ brightness values and selected bus (with grate filter).
[image:5.595.80.258.404.522.2]There are numerous vehicles (buses and cars) inside Figure 10 and the corresponding horizontal axis’ brightness values (Figures 11 and 12) indicate that there are several high-frequency areas, from which we can conclude that there are some objects in this image. Both filters detect these vehicles properly. Again, the grate filter shows more details than the bar filter in the horizontal axis’s brightness values. And again it is clear that the original image cannot be used as a background image.
Original Image
Fig. 13 Cars on the road.
[image:5.595.334.513.469.577.2] [image:5.595.71.262.574.732.2]0 200 400 600 0.2
0.3 0.4 0.5 0.6 0.7 0.8 0.9 1
x−axis brightness
[image:6.595.69.262.75.269.2]Object Detected (with bar filter)
Fig. 14 Horizontal axis’ brightness values and selected cars (with bar filter).
0 200 400 600
0.1 0.2 0.3 0.4 0.5 0.6 0.7 0.8 0.9 1
x−axis brightness Object Detected (with grate filter)
Fig. 15 Horizontal axis’ brightness values and selected cars (with grate filter).
by the grate filter, as shown in Figure 15.
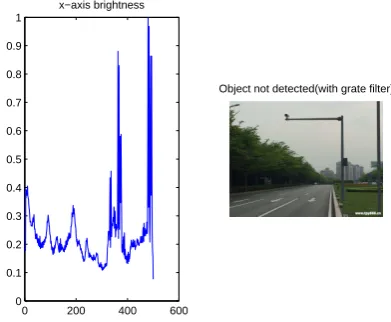
Next, we used some images of an empty road to test our proposed algorithm, the original images and detected results of which are shown in Figures 16 to 27.
[image:6.595.323.521.105.266.2]Original Image
Fig. 16 Empty road (1).
0 200 400 600
0.2 0.3 0.4 0.5 0.6 0.7 0.8 0.9 1
x−axis brightness
[image:6.595.71.264.316.475.2]Object not detected(with bar filter)
Fig. 17 Horizontal axis’ brightness values and search result (with bar filter).
0 200 400 600
0 0.1 0.2 0.3 0.4 0.5 0.6 0.7 0.8 0.9 1
x−axis brightness
Object not detected(with grate filter)
Fig. 18 Horizontal axis’ brightness values and search result (with grate filter).
[image:6.595.321.523.319.481.2]In Figure 16, there are no vehicles or people on the road. However, we see that there are several flower beds and lamp posts in the image which may affect our search process. Figures 17 and 18 show that the flower beds and lamp posts are not wide high-frequency areas. The high impulses at the right end of each figure is from the edge of the original image. Although the noise level does not meet our threshold requirement, we can see some differences in the results of the two filters. With the grate filter, the noise values are lower, not even reaching 0.5, which is a better result. Lastly, both results show the label: “Object not detected”. So this image is properly recognized as a background image.
[image:6.595.81.257.618.722.2]Original Image
Fig. 19 Empty road (2).
0 200 400 600
0.1 0.2 0.3 0.4 0.5 0.6 0.7 0.8 0.9 1
x−axis brightness
[image:7.595.80.256.107.241.2]Object not detected(with bar filter)
Fig. 20 Horizontal axis’ brightness values and search result (with bar filter).
0 200 400 600
0 0.1 0.2 0.3 0.4 0.5 0.6 0.7 0.8 0.9 1
x−axis brightness
Object not detected(with grate filter)
Fig. 21 Horizontal axis’ brightness values and search result (with grate filter).
high-frequency areas and, again, the high impulses at the right end in each figure is from the edge of the original image. Although the grate filter provides more detail in the resulting brightness values, the noise
level does not meet our threshold requirement, so they will not be considered as objects. Lastly, both filters conclude: “Object not detected”, which properly indicates that the original image can be used to update the background.
[image:7.595.337.511.188.326.2]Original Image
Fig. 22 Empty road (3).
0 200 400 600
0 0.1 0.2 0.3 0.4 0.5 0.6 0.7 0.8 0.9 1
x−axis brightness
Object not detected(with bar filter)
[image:7.595.321.517.188.546.2]Fig. 23 Horizontal axis’ brightness values and search result (with bar filter).
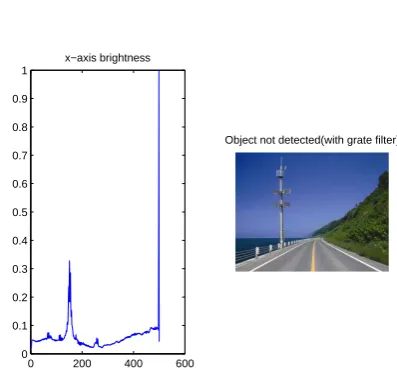
Figure 22 shows a third empty road image, in which there are mainly green trees and blue sea, as well as one high-rise transmission tower. The corresponding horizontal axis’ brightness values (Figures 23 and 24) reflect the presence of this high-rise transmission tower. We can see that the grate filter yields lower brightness values than the bar filter, which makes the computer’s decision more accurate. Lastly, the decisions from both filters are “Object not detected”, so the original image can be used to update the background.
[image:7.595.70.266.502.663.2]0 200 400 600 0
0.1 0.2 0.3 0.4 0.5 0.6 0.7 0.8 0.9 1
x−axis brightness
[image:8.595.67.266.79.269.2]Object not detected(with grate filter)
Fig. 24 Horizontal axis’ brightness values and search result (with grate filter).
[image:8.595.323.522.104.267.2]Original Image
Fig. 25 Empty road (4).
0 200 400 600
0.1 0.2 0.3 0.4 0.5 0.6 0.7 0.8 0.9 1
x−axis brightness
Object not detected(with bar filter)
Fig. 26 Horizontal axis’ brightness values and search result (with bar filter).
areas, all of which can be individually recognized. Once again, the grate filter shows more detail in the brightness values of the posts. None of the objects in the area meets our threshold requirement. They are all judged to be
0 200 400 600
0.1 0.2 0.3 0.4 0.5 0.6 0.7 0.8 0.9 1
x−axis brightness
[image:8.595.81.257.320.453.2]Object not detected(with grate filter)
Fig. 27 Horizontal axis’ brightness values and search result (with grate filter).
noise and the decisions of both filters are correct, i.e., “Object not detected”. Since no objects were identified in this image, it can be used to update the background.
4
Conclusions
In this paper, we proposed a new grate filter that can identify whether there are objects in images captured by cameras in urban surveillance systems. With this technique, background images are updated from time to time when no object is detected. The proposed method provides a low-complexity solution that facilitates the setup of the background image for urban surveillance systems, and thus makes the foreground detection process easier. This method requires no complex computation for background detection. In addition, it is robust with respect to the impact of changing light conditions and does not depend on the motion of objects. We tested and compared the proposed grate filter with the bar-shaped filter. The results confirm that the grate filter obtains greater detail on the intercorrelation results of images with a lower computational load.
Acknowledgment
This work was supported by the projects under the grant codes 2016B050502001, 2015A050502003 and CSA7035.
References
[image:8.595.73.263.347.657.2]Informatics, Vol. 13, Issue 2, pp. 800 - 809, April 2017. [2] M. M. Rathore, A. Ahmad, A. Paul, IoT-based Smart
City Development using Big Data Analytical Approach, 2016 IEEE International Conference on Automatica (ICA-ACCA), pp. 1-8, 2016.
[3] S. Chen, H. Xu, D. Liu, B. Hu, H. Wang, A Vision of IoT: Applications, Challenges, and Opportunities with China Perspective,IEEE Internet of Things Journal, Vol. 1, Issue 4, pp. 349 - 359, Aug 2014.
[4] M. Handte, S. Foell, S. Wagner, G. Kortuem, P. Marrn, An Internet-of-Things Enabled Connected Navigation System for Urban Bus Riders,IEEE Internet of Things Journal, Vol. 3, Issue 5, pp. 735 - 744, Oct 2016.
[5] H. Liu, X. Hou, Moving Detection Research of Background Frame Difference Based on Gaussian Model, 2012 International Conference on Computer Science and Service System, pp. 258 - 261, Year: 2012.
[6] X. Han, Y. Gao, Z. Lu, Research on Moving Object Detection Algorithm Based on Improved Three Frame Difference Method and Optical Flow,Fifth International Conference on Instrumentation and Measurement, Computer, Communication and Control, 2015.
[7] Y. Zhuang, C. Wu, Y. Zhang, S. Feng, Detection and Tracking Algorithm based on Frame Difference Method
and Particle Filter Algorithm,2017 29th Chinese Control and Decision Conference (CCDC), pp. 161 - 166. [8] J. Suhr, H. Jung, G. Li, J. Kim, Mixture of
Gaussians-Based Background Subtraction for Bayer-Pattern Image Sequences,IEEE Transactions on Circuits and Systems for Video Technology, pp. 365 - 370, Vol. 21, Issue 3, March 2011.
[9] D. Mukherjee, Q. Wu, T. Nguyen, Gaussian Mixture Model With Advanced Distance Measure Based on Support Weights and Histogram of Gradients for Background Suppression,IEEE Transactions on Industrial Informatics, pp. 1086 - 1096, Vol. 10, Issue 2, May 2014. [10] V. Sikri, Proposition and Comprehensive Efficiency
Evaluation of a Foreground Detection Algorithm based on Optical Flow and Canny Edge Detection for Video Surveillance Systems, 2016 International Conference on Wireless Communications, Signal Processing and Networking (WiSPNET), pp. 1466 - 1472, 2016.
[11] L. Hu, Q. Ni, IoT-Driven Automated Object Detection Algorithm for Urban Surveillance Systems in Smart Cities, accepted to appear in IEEE Internet of Things Journal, DOI: 10.1109/JIOT.2017.2705560, May 2017.
Ling Hu is a PhD student at School of Computing and Communications, Lancaster University, Lancaster, U.K. She got Bachelor of Engineering from Huazhong University of Science and Technology, China, Master of Science from ´Ecole Sup´erieure d’Ingenieurs en
´
Electronique et ´Electrotechnique, France and Master of Engineering from Dublin City University, Ireland. She has both work experiences of industrial world and academic world as engineer and research assistant.
Qiang Ni is a Professor at School of Computing and Communications, Lancaster University, Lancaster, U.K. He is also a member of Data Science Institute at Lancaster University. He is a Fellow of IET and Senior Member of IEEE. His main research interests lie in the area of
future generation networks, clouds, big data analytics and machine learning. He had already published over 200 papers that have attracted 6000+ citations.