A New Prediction Method of Rain Attenuation along Millimeter
Wave Links Based on a Bivariate Model for the Effective Path
Length and Weibull Distribution
Spiros Livieratos1, *, Zisis Ioannidis2, Stylianos Savaidis3, Stelios Mitilineos3, and Nikolaos Stathopoulos3
Abstract—Cellular technology is moving towards its 5th generation (5G) that will employ millimeter wave (mmWave) frequencies in the attempt to offer more spectrum and multi-Gigabit-per-second (Gbps) data rates to mobile devices. Various unfavorable propagation phenomena affect mmWave communications, rain attenuation being the most severe one. Various rain attenuation prediction models can be taken into account in the design of terrestrial links based either on cumbersome statistical regression, when sufficient local experimental data are available, or on analytical models where only local rain rate measurements are provided. In this paper, a new prediction method for the rain attenuation is proposed based on a bivariate model for the numerical estimation of the effective path length of a millimeter wave terrestrial link and on Weibull distribution for the representation of the point rainfall rate statistics. To validate the proposed prediction method, the actual data taken into account are extracted from experiments included in the databank of ITU-R SG3. The numerical results obtained show a significant improvement of the prediction accuracy compared to existing prediction models.
1. INTRODUCTION
To address the increasing demand per subscriber in wireless data traffic, wireless networks migrate to the 5th generation (5G) that will use millimeter wave (mmWave) frequencies since they offer channel bandwidths more than ten times wider than the 20 MHz channels offered by the 4th generation Long-Term-Evolution (4G LTE) [1]. In service-driven wireless networks, the operators aim at efficiently and flexibly providing diversified services such as enhanced mobile broadband, ultra-reliable and low-latency communications and massive machine type communications [2]. Since, compared to 4G microwave frequencies currently in use by LTE, at mmWave the wavelengths shrink by an order of magnitude, atmospheric precipitation, diffraction, and material penetration will incur greater attenuation. Hence, determining the effect of atmospheric phenomena in the design of new mmWave protocols becomes critical and using more accurate propagation models becomes imperative. Over the past few years, measurements and models concerning a plethora of scenarios have been presented by many companies and research groups [3–6]. However, due to the fundamental differences between mmWave communications and the existing communication systems operating in the microwaves band, such as in the 2.4 GHz and 5 GHz bands, many propagation problems related to mmWave communications affecting the physical (PHY) layer and thereafter the medium access control (MAC) and subsequent layers are expected to have a severe impact on 5G wireless networks.
Received 17 August 2019, Accepted 7 November 2019, Scheduled 15 November 2019 * Corresponding author: Spiros Livieratos ([email protected]).
Attenuation due to rain imposes important constraints on frequency bands above 10 GHz as it restricts the range of radio communication systems. Rainfall is a complex meteorological phenomenon due to its stochastic behavior with regard to duration, location and occurrence frequency. Since for every location on Earth the statistical distribution of rain attenuation is obtained from local data concerning the rainfall rate distribution, the accuracy of the rainfall rate measurements affects the accuracy of the rain attenuation estimation.
The usual procedure for the estimation of rain attenuation statistics for a given terrestrial or Earth-space link is to insert local or regional precipitation statistics into a propagation model. In other words, to successfully estimate the rain fade margin of a future link, annual point rainfall rate statistics must be available in the location where the radio communication link is planned. Rain rate data within an average year allow the estimation of the percentage of time during which attenuation due to rain is significant. Unfortunately, long-term rainfall rate data covering the whole distribution are not always available everywhere. Therefore, there is a need for an accurate mathematical model for predicting rain rate cumulative distribution within an average year.Several propagation models have been proposed so far and their main differences depend either on the assumption regarding the probability distribution that represents the rainfall rate statistics properly or on how they take into account the rainfall structure across the propagation path [7–10]. The most usually employed distributions for the representation of the rainfall rate in analytical models are (i) Lognormal [7], (ii) Gamma [8] and (iii) Weibull [11]. The Lognormal model gives a good approximation for many climatic zones only in the region of low rainfall rates, whereas the Gamma model is quite accurate in the region of high rainfall rates. Livieratos et al. [11] proposed Weibull distribution for the representation of the point rainfall rate statistics which showed an almost excellent fitting to rainfall rate data distributions over all climatic zones. The superiority of the approach employing Weibull distribution to represent the rain rate statistical behavior is due to the fact that it is simple and it works globally and more accurately than other distributions [11]. Moreover, it would be expected that if rain rate is Weibull distributed the assumption that the specific rain attenuation and/or rain attenuation is also Weibull distributed can lead to more accurate predictions retaining the mathematical validity of the prediction model. As far as the rainfall structure across the radio link is concerned, the existing propagation models are also differentiated to each other with respect to how the effective path length of the radio propagation path is numerically estimated. The effective path length aims at replacing the actual path length with a hypothetical one that is equivalently affected by uniform point rainfall along its span.
The existing ITU-R prediction model for rain induced attenuation over terrestrial line-of-sight (LOS) links does not perform accurately on a global level [12]. Although it is widely used by engineers and researchers in the field of radio propagation, it is theoretically hampered by the fact that it is rather a regression model with parameters being expressed by formulas which cannot be easily interpreted with a physical meaning. This constitutes the main motivation to formulate alternative prediction models which, by employing appropriate attributes, apply better to specific locations or climatic zones and ideally could be expressed in a simple and probabilistically solid manner. In any case, it is not an easy task to employ a complex prediction model for rain attenuation that applies to any location and climatic region. In the present paper a new prediction method is presented that is based on two new approaches. A new bivariate model for the numerical estimation of the effective path length is introduced along with the employment of Weibull distribution not only for the description of the rainfall rate statistics but also for the specific rain attenuation. The proposed method accomplishes an improved accuracy of the rain attenuation prediction over terrestrial LOS links.
2. EXISTING RAIN ATTENUATION PREDICTION MODELS
Rain induced attenuation may severely degrade radio wave propagation. Due to absorption and scattering at frequencies above 10 GHz, liquid rain drops become a serious contribution to transmission losses [13]. In terrestrial LOS links or Earth-space links operating above 10 GHz, the occurrence of rain along the transmission path constitutes the most important impairment factor for microwave system degradation [14]. The rain attenuation over a terrestrial path is determined as the product of the specific rain attenuationγR(dB/km) and the effective propagation path lengthdeff (km) [13]. The specific rain
attenuation, which is the main parameter characterizing the rain attenuation on a local basis, depends on frequency, polarization, and latitude [11]. The ITU-R recommendation P.838-3 [15] establishes the procedure relating the specific rain attenuation γR to the rain intensityR(mm/h). γR is obtained from
Rexceeded at pexcpercent of the time on a yearly basis Rpexc (mm/h) using the power law relationship
γR=k(Rpexc)α (1)
wherekandadepend on the frequency and polarization of the electromagnetic wave. These parameters appear in recommendation tables in [15] and can also be obtained by interpolation on a logarithmic scale for k and linear for a. The rain attenuation A (dB) exceeded for pexc percent of the time on a yearly basis is calculated from
A=γRdeff (2)
Since rainfall is not uniform along the actual propagation path, the effective propagation path lengthdeff
depends drastically on the actual path length. Four of the most frequently encountered rain attenuation prediction models are following.
2.1. ITU-R P.530-16
Based on the previous approach for the calculation of the specific attenuation the ITU-R Recommendation 530-16 [16] determines the path attenuation exceeded for 0.01% of the time. Employing an empirical formula, the results obtained are scaled by to percentages of time ranging from 1% to 0.001%. This method is advised to be used in all parts of the world which stated that the rain attenuation needs to be considered for any operating frequency beyond 5 GHz and for frequencies up to 100 GHz with path lengths up to 60 km. The prediction calculations rely on the following steps:
i. Determine the effective propagation path length of the link, deff, by multiplying the actual path
length L(km) by the path reduction factor r, which can be expressed as:
r = 1
0.477L0.633R0.073a
0.01%f0.123−10.579 (1−exp (−0.024L))
(3)
where f (GHz) is the frequency, and a is the exponent of the specific rain attenuation model. Maximum recommended r is 2.5, so if the denominator of Eq. (3) is less than 0.4 use r = 2.5.
R0.01% is the rain rate exceeded for 0.01% of the time in a year. If this information is not locally
available, an estimate can be obtained from the information given in Recommendation ITU-R P.837-7 [17].
ii. The rain attenuation exceeded for 0.01% of the yearly time is calculated as
A0.01%=γRdeff =γRLr (4)
The purpose of introducing the path reduction factor is to replace the actual path length with a hypothetical path length equivalently affected by uniform point rainfall.
iii. The prediction of the rain attenuation for other exceeded time percentagesP, ranging from 0.001% to 1%, is given by
A(P) =A0.01%C1P−(C2+C3log10P) (5)
2.2. Da Silva Mello Model
This model uses the numerical coefficients derived for effective rain rate and equivalent rain cell diameter obtained by multiple non-linear regressions, using the measured data available in the ITU-R databank. In the model proposed by Da Silva Mello et al. in [18], the effective path lengthdeff is calculated as:
deff =
1 1 +dL
0
L (6)
where
d0 = 119R(P)−0.244 (7)
The prediction of the rain attenuation exceeded for P percent of the time is achieved as:
A(P) =kRaeffdeff (8)
whereReff, i.e., the effective rain rate, is:
Reff = 1.763R(P)0.753+0.197/L (9)
2.3. Moupfouma’s Model
This model uses only the parameterR0.01%(mm/h) which, in the area of interest, represents the rainfall
rate value exceeded for 0.01% per year. This model does not need rainfall rate numerical values for all time percentages. Similarly to the ITU-R model, the prediction method proposed by Moupfouma in [19] receives R0.01% as the input to predictA as:
A(P) =kRa0.01%Leq(P L) (10)
Leq is the equivalent path length denoting what exactly deff expresses. It is calculated as:
Leq(P, L) =Lexp
− R(P)
1 +ζ(L)R(P)
(11)
where
ζ(L) = ⎧ ⎨ ⎩
−100, L≤7 (km)
44.2
L
0.78
, L >7 (km) (12)
2.4. Lin Model
The methodology proposed by Lin in [20] takes advantage of the concept of the path reduction factor to estimate rain attenuation statistics on terrestrial links. The method accounts for partially correlated rainfall rate variations along the propagation path length. According to this model,the rain attenuation exceeded for a percentage P of the yearly time can be calculated as:
A(P) =kR(P)adeff =kR(P)aLr (13)
R(P) is the rainfall rate exceeded for the same percentageP of the time. The factorrtakes the following simple expression:
r = 1
1 + L
L(R)
(14)
where
L(R) = 2623
3. SPECIFIC RAIN ATTENUATION AS A WEIBULL DISTRIBUTED RANDOM VARIABLE
The fundamental assumption of the present paper is that the rainfall rate is a Weibull distributed random variable (rv) on a global level as presented and verified in [11]. For simplicity reasons let us consider the rv X denoting the rainfall rate. The probability density function (pdf) ofX is
fX(x) = b
λ x λ
b−1 e−(xλ)
b
(16)
where b > 0 is the shape parameter, and λ > 0 is the scale parameter of the distribution. The corresponding cumulative distribution function (cdf) is
FX(x) = Prob (X < x) = 1−e−(xλ) b
(17)
Further, let us consider the rvY denoting the specific rain attenuation. Taking into account Eq. (1) we have
Y =g(X) =kXa (18)
where parameters k and a have been mentioned in Section 2. Moreover, g is a differentiable and monotonically increasing function. Given that the distribution of X is Weibull, we are coming up with a direct formula to find the distribution ofY, which is a function ofX, in the cases where the function
g is differentiable and monotonic, as follows:
FY (y) = Prob (Y ≤y) = Prob (g(X)≤y) = ProbX ≤g−1(y)=FXg−1(y) (19) where FY is the cdf of Y, and g−1 is the inverse function of g. Taking the derivative of Eq. (19) we obtain
fY (y) =FY (y) = ∂
∂y
FXg−1(y)=fXg−1(y) ∂
∂y
g−1(y) (20)
Solving the equation expressed in Eq. (18) with respect to X, the root is
X = Y k 1 a (21)
Inserting (21) in (20) the pdf of Y can be obtained
fY (y) =fX y k 1 a ∂ ∂y y k 1 a (22)
which after some algebraic calculations becomes
fY (y) =
b a kλα y kλα b a−1
e−(kλαy ) b a
(23)
By the above we conclude that if the rainfall rate is a Weibull distributed rv with shape parameterband scale parameterλ, then the corresponding specific rain attenuation is also a Weibull distributed rv with shape parameter ba and scale parameter kλα wherek and a depend on the frequency and polarization of the electromagnetic wave and are calculated employing [15].
4. THE PROPOSED PREDICTION METHOD AND NUMERICAL RESULTS
all other assumptions remain the same as those of the models that employ Lognormal and Gamma distributions [11]. As it is shown in Section 2, the existing rain attenuation prediction models, amongst others, are differentiated one another mainly with respect to how the effective propagation path length
deff is modelled and numerically calculated. So, it seems that a more efficient model fordeff can facilitate
a more accurate prediction of the rain attenuation. In general, the inputs required by most prediction models for rain induced attenuation over terrestrial links are the rainfall rate exceeded for a specific time percentage, the propagation path length, the operation frequency, and the wave polarization.
The terrestrial LOS links included in the ITU-R databank provide experimental data for the location and climatic zone such as local rainfall rate, path length, operation frequency, wave polarization and the corresponding rain induced attenuation for specific exceedance probability levels, namely 0.001%, 0.002%, 0.003%, 0.006%, 0.01%, 0.02%, 0.03%, 0.06% and 0.1% referred to on one-year period. Hereafter, these levels will be called reference exceedance probability levels (REPLs). A(p%) is the rain attenuation in dB exceeded for the REPL that is equal to p% on a per year basis. In general, this is expressed as
Prob (A > A(p%)) =p% (24)
Taking into account (2), (24) becomes
Prob (γRdeff > A(p%)) =p% (25)
and equivalently
Prob
deff >
A(p%)
k(R(p%))α
=p% (26)
From Eq. (26) it is obvious that deff can take different values for the various REPLs for the same
terrestrial radio link.
The availability of data regarding rainfall rate and rain induced attenuation referred to real terrestrial LOS links of the ITU-R databank that operate in various locations encourages the development of an alternative bivariate regression model for calculating the effective propagation path length. The proposed method represents the effective propagation path length, denoted as deff, biv, as a bivariate function of the effective path length determined in the frame of the ITU-R rain attenuation model, denoted asdeff,ITU, and of the actual path lengthL:
deff, biv(p%) =fregression(deff,ITU, L) (27)
The actual values ofdeff, biv can be calculated as
deff, biv(p%) =
A(p%)
k(R(p%))α (28)
where
A(p%) is the rain induced attenuation in dB exceeded for each REPL that is equal top%,
R(p%) is the rainfall rate exceeded for each REPL that is equal to p%, andkandadepend on the frequency and polarization of the electromagnetic wave which range from 7 GHz to 137 GHz and from 0 degrees to 90 degrees respectively.
The algebraic expression proposed for the regression function is
deff, biv(p%) =c1(p%)deffc2(p,ITU%) Lc3(p%) (29)
where
deff, biv(p%) is the effective propagation path length corresponding to a REPL equal top%,
deff,ITU(p%) is the effective propagation path length as calculated for the ITU-R model
corresponding to a REPL equal top%,
L is the length of the real propagation path and ranges from 0.5 km to 58 km, and
Table 1. Coefficients of the proposed model for the effective propagation path length obtained from bivariate regression.
REPL c1 c2 c3 R2
0.001% 1.381 0.5136 0.15230 88.9% 0.002% 1.154 0.7017 0.10540 90.3% 0.003% 1.139 0.7823 0.06675 90.6% 0.006% 1.165 0.7949 0.08788 92.0% 0.01% 1.176 0.9280 0.00720 89.3% 0.02% 1.206 0.8342 0.11490 88.3% 0.03% 1.081 1.0080 0.04603 86.1% 0.06% 1.296 0.8431 0.17980 82.4% 0.1% 1.531 0.6182 0.34860 79.4%
The numerical results obtained from the regression analysis that employed all the experiments of the ITU-R databank are tabulated in Table 1.
The effectiveness of the regression is expressed employing the R2 metric that ranges from 0 to 1. R2 is a statistical measure called coefficient of determination and provides a measure of how well the observed outputs are replicated by the regression function. R2 essentially expresses the proportion of the variance in the dependent response deff, biv that is predictable from the independent variables
deff,ITU andL. Indicatively, the interpretation ofR2= 90% is that 90% of the variance in the response
can be attributed to the employed independent variables whereas the remaining 10% can be attributed to unknown, lurking variables or inherent variability. The proposed bivariate regression model can be applied independently from the distribution employed to describe the rainfall rate statistics. The proposed bivariate model fordeff is essentially a synthetic variable that takes into account the real length
of the radio path and the estimation of the ITU-R model aiming at correcting the former estimation and bringing it closer to its actual values as calculated using Eq. (26). Employing synthetic variables is usually followed in the field of data analytics as a facilitator of accurate regression and/or classification modeling so that they can successfully replace original variables [21].
If the rain attenuation A, expressed in dB, exceeds A(p%) forp% on a per year basis, as provided in the ITU-R databank, the following equation is satisfied
Prob (A > A(p%)) =p% (30)
Given Eq. (2), Eq. (30) becomes
Prob (γRdeff (p%)> A(p%)) =p% (31)
which equivalently becomes
Prob
γR> A(p%) deff (p%)
=p% (32)
Taking into account that the specific rain attenuation γR is a Weibull distributed rv with parameters
bγR and λγR, Eqs. (17), (32) can take the following algebraic form
e
−
⎛ ⎝
A(p%)
deff(p%)
λγR
⎞ ⎠
bγR
=p%
(33)
In Section 3 it was proved that if the rainfall rate R is a Weibull distributed rv with shape parameter
bR and scale parameter λR, then the specific rain attenuation γR is also a Weibull distributed rv with shape parameter
bγR = bR
a (34)
and scale parameter
wherekandadepend on the frequency and polarization of the electromagnetic wave and are calculated employing [15]. Hence, if the rainfall rate data of each experiment is used to determine via regression the exact Weibull distribution that describes the local rainfall rate behavior, the parameters of the distribution of the corresponding specific rain attenuation can be determined too by using Eqs. (34) and (35). If in Eq. (33) deff(p%) is replaced withdeff, biv(p%), then applying the logarithmic function
in Eq. (33) it is obtained
AW(p%) =deff, biv(p%) (−lnp%)
1
bγRλγR (36)
where
bγR is the shape parameter of the specific rain attenuation γR given in Eq. (34),
λγR is the scale parameter of the specific rain attenuation γR given in Eq. (35),
deff, biv(p%) is the effective propagation path length expressed in Eq. (29) along with the parameters
c1, c2 and c3 which are tabulated in Table 1, and AW(p%) is the rain induced attenuation in dB
exceeded for each REPL that is equal to p% if rainfall rate is taken as a Weibull distributed rv with shape parameterbR and scale parameterλR.
It is important to consider how the proposed method performs in comparison to the existing prediction models for rain attenuation that were presented in Section 2. Numerical calculations were performed using rainfall rate data extracted from the ITU-R experiment databank. First, a regression analysis was conducted regarding the local rainfall data for each experiment included in the databank employing Weibull distribution so that the parameters bR and λR were determined. By applying the calculation process recommended in [15] the parameters of specific rain attenuation, which is also a Weibull distributed rv, were also determined for each experiment. Using Eq. (36) the rain induced attenuation exceeded for each REPL can be calculated provided thatdeff, biv has been calculated using
Eq. (29) and Table 1. To become comparable, the respective results have been normalized adopting the test variableρV proposed by ITU-R in Recommendation P.311-13 [22]. According to [22], for each time percentage examined and each radio link of the ITU-R databank considered, say the ith link, the ratio of the predicted rain attenuation, Ap(dB), to the measured rain attenuation, Am(dB), is calculated from
Si= Ap, i
Am, i (37)
Next, the variableVi is calculated from
Vi = ⎧ ⎨ ⎩
Am, i
10 0.2
lnSi, forAm, i<10 dB
lnSi, forAm, i≥10 dB
(38)
Then, the meanμV and standard deviationσV of theVi values for each time percentage are calculated. Finally, the test variable is determined as the RMS (root mean square) value
ρV =
μ2
V +σ2V (39)
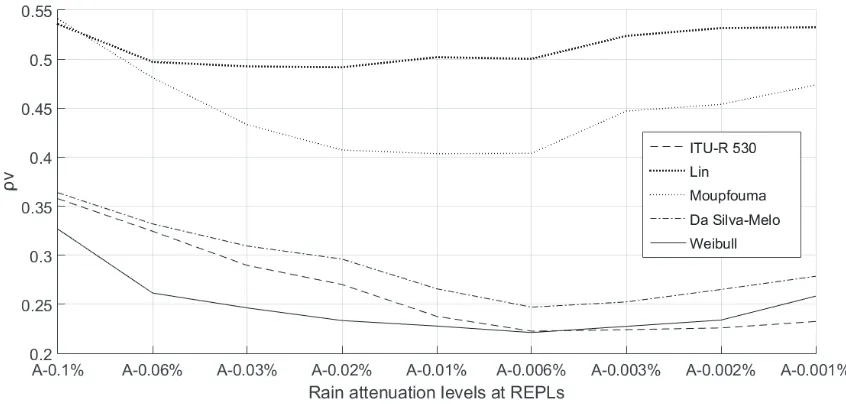
In comparing the various prediction methods, it should be noted that the lower the test variableρV is, the better the prediction method is. The numerical results obtained following the above comparison procedure are depicted in Fig. 1. As readily observed from Fig. 1, the proposed prediction method based on Weibull distribution performs significantly better than the four prediction models under comparison whereas its accuracy is similar to or slightly less than that of the ITU-R model for exceeded times lower than 0.003% on a yearly basis. Obviously the prediction models mentioned in Section 2, other than the ITU-Rone, are simulation models that have lower accuracy and are differentiated as far as deff is
Figure 1. Regression effectiveness expressed in the form of the test variableρV employing various rain attenuation prediction models and the proposed prediction method employing a bivariate function for the effective radio propagation path as well as Weibull distribution for the statistical representation of point rainfall rate and specific rain attenuation.
Although the effectiveness of the proposed model is illustrated in Fig. 1 in terms of the test variable
ρV [22], a similar check can be made considering the following Table 2, in which the RMS value of the regression error is tabulated for the various REPLs. In particular, the RMS error is defined as
εRMS(dB) =
ε2
mean(dB) +ε2std(dB) (40)
where εmean is the mean value of the regression error, Am−Ap, and is calculated for each REPL, and
εstd is the standard deviation of the regression error,Am−Ap, and is calculated for each REPL.
Table 2. RMS error of the proposed and the existing rain attenuation prediction models.
REPL εRMS,Weibull (dB)
εRMS,ITU-R.530
(dB)
εRMS,Da Silva Mello
(dB)
εRMS,Moupfouma
(dB)
εRMS,Lin
(dB)
0.001% 7.46 7.35 9.37 13.79 18.02
0.002% 7.49 7.08 8.15 11.87 15.88
0.003% 6.69 6.81 7.11 10.90 14.09
0.006% 5.73 5.65 6.68 8.84 13.58
0.01% 5.70 6.03 6.99 8.87 13.54
0.02% 5.17 5.43 6.52 6.46 11.10
0.03% 4.69 5.13 6.07 6.03 10.90
0.06% 3.68 4.15 4.33 4.39 8.10
0.1% 3.10 3.50 3.57 3.76 5.77
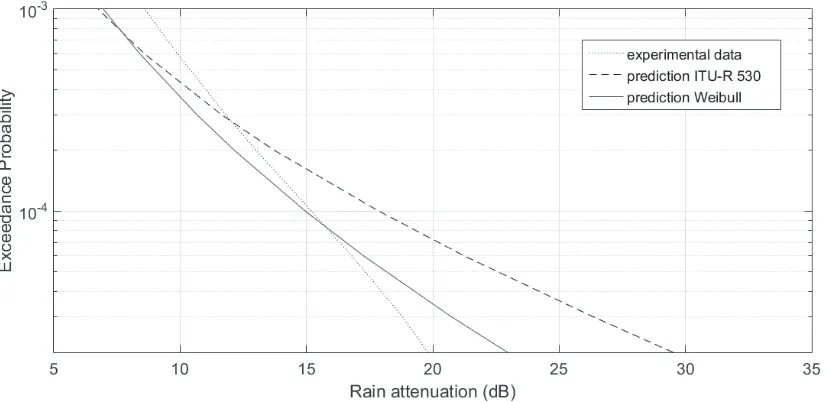
Figure 2. Exceedance probability, Mendlesham, UK, frequency 20.1 GHz, path length 16.6 km and vertical polarization.
Figure 3. Exceedance probability, Chilbolton, UK, frequency 137 GHz, path length 0.5 km and vertical polarization.
year, i.e., 10 min provided that one year has 525,600 minutes.
It is of high importance to see how the proposed method performs for higher frequencies closer to mmWave wavelengths. In Figs. 3, 4, and 5 the exceedance probability that the rain induced attenuation will be higher than a certain level in dB is illustrated for the same terrestrial link in Chilbolton, UK, which is included in the ITU-R databank. Apart from the rainfall rate and the rain attenuation actual data of the aforementioned link that are available, its other operational characteristics aref = 137 GHz, 97 GHz and 57 GHz respectively whereas path lengthL = 0.5 km and the used polarization is vertical. In Fig. 3, where the operating frequency is 137 GHz, the proposed method fits much better to the experimental data than the ITU-R model. Particularly for probabilities ranging from 2 10−5 to 2 10−4 the proposed method has a very slight deviation from the actual experimental data whereas the ITU-R model has a significantly lower accuracy. The aforementioned range of exceedance probabilities is of high importance in practice. It refers to exceeded time percentages ranging from 0.002% to 0.02% on
Figure 4. Exceedance probability, Chilbolton, UK, frequency 97 GHz, path length 0.5 km and vertical polarization.
a per year basis and in turn to cumulative time periods that rain attenuation is expected to exceed the respective levels of 20 dB and 13 dB which are 10 min and 105 min respectively. Such information can be very useful for the network planning as it facilitates the estimation of reliability and availability figures of the links under study.
In Fig. 4 the same experimental configuration is considered, but the operating frequency is 97 GHz. The proposed method fits much better to the experimental data than the ITU-R model especially for probabilities ranging from 5 10−5 to 10−3 which correspond to cumulative time periods that rain attenuation is expected to exceed the respective levels of 16 dB and 6 dB which are 26 min and 525 min respectively. Moreover, the proposed method slightly overestimates the exceedance probability providing an additional safety margin for planning purposes. Likewise, important conclusions can be obtained from Fig. 5 where the experimental configuration remains the same but the operating frequency is 57 GHz. The proposed method fits much better to the experimental data than the ITU-R model for the entire range of exceedance probabilities providing an additional safety margin as in the previous case.
5. CONCLUSIONS
In this paper, two new concepts were introduced. Firstly, a new bivariate regression for the estimation of the effective propagation path length was presented. This approach is differentiated from the existing methods intended to estimate the effective propagation path length, which essentially go along with and reflect the various rain attenuation prediction models. The independent variables are the real path length and the effective propagation path length as calculated from the ITU-R model. Further investigation may be conducted possibly aiming at a more efficient multivariate approach. Secondly, Weibull distribution for both rainfall rate and specific rain attenuation statistics was employed and the algebraic expressions of their interrelation were provided. The proposed method to predict rain attenuation is based on the combination of the two aforementioned concepts in a single prediction model as presented in Section 4. The proposed method has been validated taking into account experimental data from the ITU-R databank concerning LOS terrestrial links. The numerical results obtained showed a prediction accuracy improvement over the prediction accuracy offered by the existing prediction models currently in use, reaching very high accuracy levels. New propagation data can be collected if new experiments can be properly planned, so that to be employed towards improving the proposed method and dealing with various propagation phenomena.
REFERENCES
1. Rappaport, T. S., et al., “Millimeter wave mobile communications for 5G cellular: It will work!,”
IEEE Access, Vol. 1, 335–349, May 2013.
2. Kibria, M. G., K. Nguyen, G. P. Villardi, O. Zhao, K. Ishizu, and F. Kojima, “Big data analytics, machine learning, and artificial intelligence in next-generation wireless networks,” IEEE Access, Vol. 6, 32328–32338, May 2018.
3. Rangan, S., T. S. Rappaport, and E. Erkip, “Millimeter-wave cellular wireless networks: Potentials and challenges,”Proceedings of the IEEE, Vol. 102, No. 3, 366–385, Mar. 2014.
4. MacCartney, G. R. and T. S. Rappaport, “Rural macrocell path loss models for millimeter wave wireless communications,” IEEE Journal on Selected Areas in Communications, Vol. 35, No. 7, 1663–1677, Jul. 2017.
5. Thomas, T. A., et al., “A prediction study of path loss models from 2–73.5 GHz in an urban-macro environment,”2016 IEEE 83rd Vehicular Technology Conference (VTC 2016-Spring), 1–5, Nanjing, China, May 2016.
6. Shrestha, S. and D. Y. Choi, “Rain attenuation statistics over millimeter wave bands in South Korea,” Journal of Atmospheric and Solar-Terrestrial Physics, Vol. 152, 1–10, Jan. 2017.
7. Lin, S. H., “A method for calculating rain attenuation distribution on microwave paths,”Bell Syst. Tech. J., Vol. 54, 1051–1086, 1975.
9. Fedi, F., “Prediction of attenuation due to rainfall on terrestrial links,” Radio Sci., Vol. 16, No. 5, 731–743, 1981.
10. Moupfouma, F., “Improvement of rain attenuation method for terrestrial microwave links,” IEEE Trans. Ant. and Prop., Vol. 32, 1368–1372, 1984.
11. Livieratos, S. N., V. Katsabas, and J. D. Kanellopoulos, “A global method for the prediction of the slant path rain attenuation statistics,” Journal of Electromagnetic Waves and Applications, Vol. 14, No. 5, 713–724, Jan. 2000.
12. Moupfouma, F. and L. Martin, “Modeling of the rainfall rate cumulative distribution for the design of satellite and terrestrial communication systems,” International Journal of Satellite Communications, Vol. 13, 105–115, Mar./Apr. 1995.
13. Crane, R. K., Electromagnetic Wave Propagation through Rain, John Wiley & Sons Series, UK, 1996.
14. Freeman, R. L., Radio System Design for Telecommunication, 3rd Edition, A Wiley Inter-science Publication, Wiley, John Wiley & Sons Inc., San Francisco, United States, 2007.
15. ITU-R Recommendation P.838–3, Specific Attenuation Model for Rain for Use in Prediction Methods, ITU, Geneva, Switzerland, 2005.
16. ITU-R Recommendation P.530-16, Propagation Data and Prediction Methods Required for the Design of Terrestrial Line-of-Sight Systems, ITU, Geneva, Switzerland, 2015.
17. ITU-R Recommendation P.837-7,Characteristics of Precipitation for Propagation Modelling, ITU, Geneva, Switzerland, 2017.
18. Da Silva Mello, L. A. R., M. S. Pontes, R. M. D. Souza, and N. A. P. Garcia, “Prediction of rain attenuation in terrestrial links using full rainfall rate distribution,” IEEE Electron. Lett., Vol. 43, 1442–1443, Dec. 2007.
19. Moupfouma, F., “Electromagnetic waves attenuation due to rain: A prediction model for terrestrial or L.O.S SHF and EHF radio communication links,”J. Infrared Millim. Terahertz Waves, Vol. 30, 622–632, Mar. 2009.
20. Lin, S. H., “National long term rain statistics and empirical calculation of 11 GHz microwave rain attenuation,”Bell Syst. Tech. J., Vol. 56, 1581–1604, Nov. 1977.
21. Patki, N., R. Wedge, and K. Veeramachaneni, “The synthetic data vault,” IEEE International
Conference on Data Science and Advanced Analytics (DSAA) 2016, 399–410, Montreal, Canada,
Oct. 2016.