HRV based Human Heart Disease Prediction and
Classification using Machine Learning
Santosh Maher
Department of Computer Science & IT, Dr. BAM University Aurangabad
Shaikh Abdul Hannan
Department of Computer Science and Information
Technology, Albaha University, Albaha, Kingdom of Saudi Arabia
Sumegh Tharewal
Department of Computer Science & IT,Dr. BAM University Aurangabad
K. V. Kale
Department of Computer Science & IT,Dr. BAM University Aurangabad
ABSTRACT
The increase in popularity of different sensors and gadget coming in market (MI HRV band, apple watch Microsoft band) which capable to observe every activity of heart and its related condition. One of the most prevalent healthcare problems today is the poor survival rate of out-of hospital sudden cardiac arrests. Heart Disease is the number 1 cause of death globally more people die annually from Heart Disease than from any other disease such as Heart attack and stroke. According WHO Report say an expected 17.9 million people died from Heart Disease in 2016 according to WHO health report, representing 31% of all global deaths. Heart attacks and strokes main reason are tobacco or smoking, unhealthy diet, physical inactivity and the harmful use of alcohol. Of these deaths, 85% are due to heart attack and stroke. Heart disease is the Noteworthy reason for short life. Large population of people depends on the healthcare system so that they can get accurate result in less time. The main aim of this paper is to apply machine learning algorithm our on dataset which collect data by the healthcare organization and KVK research Lab on the daily basis. This paper proposes to prediction of heart disease and classification of unique attribute extraction method to increase the accuracy of classification.This kind of system is very helpful in reducing the risk of death.
Keywords
Heart Disease, Machine learning, HRV, ECG, Logistic Regression, SVM,CHD,
1.
INTRODUCTION
Heart function is to pump blood around the body. The heart is a key factor of the human body, and acting as filter of blood and transfers oxygenated and deoxygenated blood around the body [1]. World Health Organization has estimated 12 million deaths occur worldwide, every year due to Heart diseases. Half the deaths in the United States and other developed countries are due to cardio vascular diseases. The World Health Organization (WHO) estimates that by 2030, 23.6 million people worldwide will die from heart disease [2]. This research intends to pinpoint the most relevant/risk factors of heart disease as well as predict the overall risk using machine learning algorithms like logistic regression support vector machine Decision tree ,Random Forest, Extra tree, ensemble and voting classifier etc. Heart attacks and strokes can also be caused by bleeding from a blood vessel in the brain if HBP Blood pressure readings higher than 120/80 millimeters of mercury (mm Hg) [3]. The cause of heart attacks and strokes are usually the presence of a combination of risk factors such as using tobacco can cause your blood pressure to temporarily increase and can contribute to damaged arteries. Secondhand smoke, contact to other people’s smoke, also increases the risk of heart disease for nonsmokers [4]. unhealthy
diet that is too high in salt consumption, as well as calories, saturated and trans fat and sugar, carries an additional risk of high blood pressure. The researches study say the physical inactivity and harmful use of alcohol including heart failure, stroke and an irregular heartbeat (arrhythmia). It can cause your blood pressure to increase significantly and can also increase your risk of cancer, obesity, alcoholism, suicide and accidents. all of intermediate risks factors attributes” can be measured in primary care facilities and indicate an increased risk of developing a heart attack, stroke, heart failure and other complications[5]. If the disease is detected during the Early stages we can prevent the possibility of the heart attack and we can take precautions [6].There is so much of data unknown in the medical records have a lot of information which may be helpful, for predicting the disease.
The researchers convert the unused data in the form of the dataset attributes information that is in the form of tables. A number of deaths occur unexpectedly due to heart diseases because they cannot discover the disease and also the symptoms that they are suffering and not considering them [3]. Prediction of heart disease is expected to reduce the number of patients with heart disease with early prediction of heart disease.[4] Machine learning Algorithm Logistic Regression, Artificial Neural Network (ANN) and Support Vector Machine (SVM) has been widely used for predication and classification of heart disease based on inserts a few variables or symptom of heart disease[5].
The objective of this paper is to analyze the existing works on heart disease and implement new machine learning algorithm and different techniques to get more accuracy to prediction of heart disease. In This paper has been structured as follows. The introduction is presented in Section I, briefly discussed in heart disease Section II, Data collection III, Methodology IV, Result and Discussion V.
2.
HEART
DISEASE
history or Family history Physical inactivity etc. [9]. The most common types of heart disease are:
Coronary artery disease (CAD) This occurs when problems arise with the blood vessels due to high cholesterol, diabetes, smoking, high blood pressure and inherit from parents [10]. Angina is a symptom of CAD, which a chest pain and occurs discomfort in neck, arms, shoulders, back and pain even feels like indigestion [11] Congestive heart failure (CHF) The function of the heart is to pump blood, CHF is found when heart is not pumping a normal level Abnormal heart rhythms This is a problem in the heart with electrical activity, which makes the heart beat too fast or too slow is called Tachycardia or bradycardia. Bad rhythm‘s stops pumping blood in the heart [12].Heart diseases are also called as silent killers because symptoms are very difficult to detect. Some of the common symptoms or risk factor are: shortness of breath, uncontrolled heart palpitations, chest pain, skin discoloration, swelling in legs and dizziness. HD can be diagnosed in many ways based on the doctor‘s recommendation and symptoms. Few of the commonly recommended tests are [13].
3.
DATA
COLLECTION
An intelligent system for accurate heart disease prediction and medical facilities recommendation plays a major role in successful treatment and diagnosis. This system takes the symptoms from subject or patient and predicts the most accurate disease. Additionally, sensor module helps in continuous evaluation of vitals like heart rate, blood pressure and sugar level for patient which is fed in the system at runtime for analysis. We are developed an RRI measurement and data acquisition system and calculate Heart rate (HR) using analog pulse sensor for sensing person/patient data during resting position. Resting is useful for healthcare disease prevention. Among HR sensing methods, photoplethysmography (PPG) is known as a simple and non-invasive method, which illuminates the skin by a light emitting diode (LED) and measures the intensity of the light changed by the blood volume pulses (BVPs) under the skin by a photo detector (PD) [14].
However, the light intensity can be also changed by the thickness variations of the skin tissue around the HR sensor, which is referred to as motion artifact (MA), so we need to cancel MA out of PPG sensor output. The system that can be interfaced with Raspberry Pi and Arduino Microcontroller chip that utilizes change in amount of reflection of light sensed by a photo transistor. Computer using serial or USB port connected to computer through serial port or USB port (using a serial to USB Bridge), this makes the system more flexible and versatile. Details of design and construction and performance analysis of three types of PPG signal based pulse sensors are presented and its use in biometric and biomedical device and application is also presented [15]
Fig: 1 Data acquisition Using Analog pulse sensor and ECG the pulses are detected at the fingertips of the subject.
Fig: 2 Analog Heart beat detection using pulse sensor
Fig.4 IR Based Pulse detection Sensor with the measuring Unit Transmitter-Receiver Pair of heartbeat sensor
The Arduino Uno is a microcontroller board based on the ATmega328P which connect pulse sensor and interface serial communication via serial/USB cable to Raspberry pi (ARM) processor.1.4GHz 64-bit quad-core processor. All the data acquisition, pre-processing and RR time series data done in python 3.6 programming language anaconda Jupiter idle.
Data acquisition tools:
● Arduino kit
● Pulse sensor (Analog)
● Raspberry pi 3 B model ● PPG sensor (Digital)
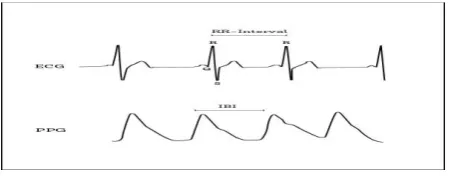
Analog pulse sensor device capture and record 1 min to 5 min data of a subject in raw data. Data was recorded using an IR based pulse detection sensor, at 100 Hz in rest position and store into CSV file. The microcontroller unit measures the time duration between two consecutive pulses and transmits it through the RS232 serial communication via serial/USB bridge adaptor. The acquisition tools create using Python 3.7 and Anaconda Jupyter idle programming and acquire data and perform pre-processing of RR time series data. RR intervals are the differences of successive heart beats(R-peaks) in an ECG as the result of automated heartbeat detection. On a standard ECG, the maximum upwards deflection of a normal QRS complex is at the peak of the R wave, and the duration between two adjacent R wave peaks is termed the R-R interval.
Fig 5: pulses sensor signals indicating the RR-Intervals between two consecutive heart beats [18].
Database Specification:
We having collected the data heart rate for people with heart disease abnormal and normal people are carried out. The formulation of the data on a historical heart rate so that other incoming data can be recognized as people with heart disease. The database set It contains recordings of 150 patients(normal subject) (75 males and 75 females, 18 to 35 years old) 10 samples(each subject) were measured continuously for 1 minute in resting condition in different sessions morning(10.30 To11:45) , afternoon(01:30 To 2:30) ,evening(4:30 To 6:00) also collect some relevant attribute information mention on Based on the same databases of the MIT-BIH and Cleveland database set which 75 attribute.[16] In this paper we take 10 attribute which more important to find out heart diseases age, sex, Rest ECG,
smoke, year of smoker ,BP, HR, fbs, family history of CAD[16].
[image:3.595.300.549.117.371.2]Analog pulse sensor device capture 1 min Raw data value(1603)
Table 1 Heart disease dataset Attributes
No Attributes Values
1 Age
2 Sex 1=Male 0=Female
3 Rest_ECG
4 Smoke If True =1 False =0
5 Smoke_yer
6 BP >120 & 80<
7 HR
8 RR_interval
9 Fbs: fasting blood sugar>120
mg/d
1=True 0=False
10 Familiy_his If Yes=1 No=0
11 Thal (HC) 1=Normal 0=Abnormal
12 prevalentHyp True=1 False=0
A. Discription of aatributes:
Variables:
Each attribute is a potential risk factor. There are both demographic, behavioural and medical risk factors.
Demographic:
o sex: male or female;(Nominal)
o age: age of the patient;(Continuous - Although the recorded ages have been truncated to whole numbers, the concept of age is continuous)
Behavioral
o current Smoker: whether or not the patient is a current smoker (Nominal)
o CigsPerDay: the number of cigarettes that the person smoked on average in one day.(can be considered continuous as one can have any number of cigarettes, even half a cigarette.)
Medical( history):
o BPMeds: whether or not the patient was on blood pressure medication (Nominal)
o prevalentStroke: whether or not the patient had previously had a stroke (Nominal)
o prevalentHyp: whether or not the patient was hypertensive (Nominal)
[image:3.595.60.288.498.586.2] Medical(current):
o sysBP: systolic blood pressure (Continuous)
o diaBP: diastolic blood pressure (Continuous)
o heartRate: heart rate (Continuous - In medical research, variables such as heart rate though in fact discrete, yet are considered continuous because of large number of possible values.)
Predict variable (desired target):
o Outcomes of coronary heart disease CHD (binary: “1”, means “Yes”, “0” means “No”)
We indicated a heart disease (abnormal) by 1 and healthy (normal) by 0.For purpose of this research; the multi-class classification problem is changed to binary classification problem [17]. Machine learning algorithms are investigated for assessing and predicting the severity of heart failure by artificial neural networks (ANN), Support vector machine (SVM), classification, Logistic regression [14].
4.
METHODOLOGY
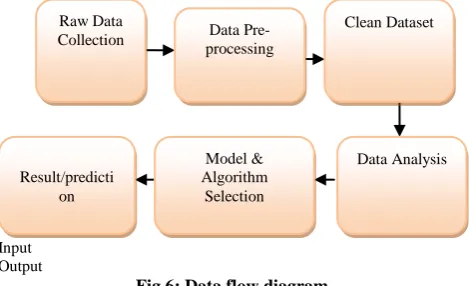
The purposed system workflow can be seen Fig 5. It is a six step process and initial three steps to execute in parallel with the data acquisition process.
Raw Data Collection:
The first step is the data collection and normalization of all data. The data taken from using pulse sensor which interfaces between arduino board and serial communication with raspberry pi and access into python to take 1 min to 5 min reading raw data and store into csv file.
Data Pre-processing:
After data collection we process data to reduce some noise, cheek outliers, missing value etc.
[image:4.595.55.290.462.605.2]Input Output
Fig 6: Data flow diagram
Clean Dataset:
While working on a Data outlier is an observation point that is distant from other observations. The outliers can be a result of a mistake during data collection or it can be just an indication of variance. A box plot is a method for graphically depicting groups of numerical data through their quartiles .dealing with missing value and replace with some statistic technique method like mean and mode.
Data Analysis:
Data Analysis based on which attribute dependent on independent variable like age is show the relationship of disease based on smoking. And observe and calculate based correlation between variable age and smoking with as gender category to
show disease having on analysis based to show how many male or female are having heart disease.
Model & algorithm:
A. Logistic Regression:
Logistic Regression is a standard classification technique based on the probabilistic statistics of the data. It is used to predict a binary response from a binary predictor. Let us assume our hypothesis is given by hθ(x). We will choose
Where is called the logistic function or the sigmoid function. Assuming all the training examples are generated independently, it is easier to maximize the log likelihood. Similar to the derivation in case of standard linear regression, we can use any gradient descent algorithm to achieve the optimal points. The updates will be given by θ:=θ-α∆θl(θ), where l is the log likelihood function.
Select multiple algorithms which is the best suitable model of training dataset to understand for better prediction and classification that gives more accuracy.
5.
RESULT
AND
DISCUSSION
[image:4.595.308.556.526.641.2]The performance of our proposed has been tested with own collected data set .We recorded the heart rate data of standing, walking, and rest condition collecting raw data from the using pulse sensors. Pulse is the number of heart beats per minute.pules gives important information about health and if any change from normal heart rate can indicate a health problem. Heart Rate Variability (HRV) represents an instantaneous heart rate signal counting the beat-to-beat changeability in heart rate. The analysis of HRV, heart rhythms is a powerful, noninvasive measure of neurocar-diac function that reflect heart-brain interaction and autonomic nervous system dynamics.HRV also show regular and irregular heart beat which indicate if an irregular is an arrhythmias also called dysrhythmia. HR calculated by Rate = 60/(R-R interval) Heart rate can also be irregular.
Fig 5: RR_interval calculation unit of measurement is milliseconds (ms) [18].
Heart Rate Variability is a measure which indicates how much variation there is in your heartbeats within a specific timeframe. The unit of measurement is milliseconds (ms).
If the intervals between your heartbeats are rather stable, your HRV is low.
If their length is change, your HRV is high [18].
Raw Data
Collection processing Data
Pre-Clean Dataset
Data Analysis Model &
Algorithm Selection Result/predicti
A normal human heart rate or beat is 50 to 100 beats per minute is called as Arrhythmias can occur with a normal heart rate and another is tachyarrhythmia’s is faster than 100 beats per minute. RR moving interval, Calculated on the basis of normal maximum and minimum Heart rate (Heart beat) and its relevant information. The machine learning models trained on kvk database. Data is taken by using tool/device pulse sensor, micro controller Arduino Uno (R3) board and ARM processor Raspberry pi model 3 using all data collected in UGC fundedlab (multimodal biometric sap lab) using HRV device. We design and developed HRV device to collect data of single person recording 1 min to 5 min data in raw (digital signal) and store into csv file and then preprocess data and extract RR interval. We are collected normal (healthy) and abnormal (unhealthy) subject 150 people’s data which divided into two groups (male and female) with its patient attribute data symptoms. We apply Logistic regression analysis in statistics used for prediction of outcome of a categorical dependent variable from a set of predictor or independent variables. In logistic regression the dependent variable is always binary. Logistic regression is mainly used to for prediction and also calculating the probability of success.
a)Logistic regression equation:
P=eβ0+β1X1/1+eβ0+β1X1 When all features plugged in:
[image:5.595.301.548.84.258.2]logit(p)=log(p/(1−p))=β0+β1*Sex_male+β2*age Machine learning classifier which is gives beater prediction 73% accuracy. 19 male and 11 female Total=30 having Heart Disease indicating having Heart disease and 119 subject is normal.
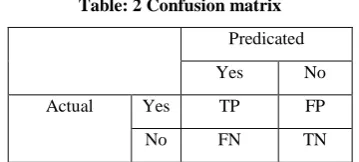
Table: 2 Confusion matrix
Predicated
Yes No
Actual Yes TP FP
No FN TN
The confusion matrix shows 22+0 = 22 correct predictions and 6+2= 8 incorrect predictions.
True Positives: 0
True Negatives: 22
False Positives: 2 (Type I error)
False Negatives: 6 (Type II error)'
Fig: 6. The confusion matrix shows 22+0 = 22 correct predictions and 6+2= 8 incorrect predictions.
Table 2: Results for heart disease Prediction
Algorithm
Accuracy MSR
Logistic Regression 80% 20%
SVM 80% 20%
Decision Tree 75% 25%
Random Forest 77% 23%
AdaBoost_cl 76% 24%
SGBoosting 77% 23%
Gradient Boosting 77% 23%
Naïve Bayes 70% 30%
6.
CONCLUSION
All attributes selected after the elimination process show Values lower than 5% and thereby suggesting significant role in the Heart disease prediction. Men seem to be more susceptible to heart disease than women. Increase in Age, number of cigarettes smoked per day and systolic Blood Pressure also show increasing odds of having heart disease. We are Applying voting classifier and ensemble technique on multiple algorithms which show Logistic Regression and SVM support vector machine prediction 80% accuracy. And confusion matrix shows 22+0 = 22 correct predictions and 6+2= 8 incorrect predictions. The model is more specific than sensitive. Overall model could be improved with more data.
7.
REFERENCES
[1]. Santosh K Maher, Sumegh Tharewal, Abdul Hannan, Suvarnsing G Bhable and K V Kale. Review on HRV based Prediction and Detection of Heart Disease. International Journal of Computer Applications 179(46):7-12, June 2018. 10.5120/ijca2018917083, ISBN : 973-93-80898-75-8
[2]. https://www.who.int/en/news-room/fact sheets/detail/cardiovascular-diseases-(cvds)
https://www.mayoclinic.org/diseases-conditions/stroke/symptoms-causes/syc-20350113
[3]. https://www.heart.org/en/health-topics/high-blood- pressure/why-high-blood-pressure-is-a-silent-killer/know-your-risk-factors-for-high-blood-pressure
[4]. P. Sudeshna S.Bhanumathi et.al “Identifying Symptoms and Treatment for Heart Disease from Biomedical Literature Using Text Data Mining”, 2017 International Conference on Computation of Power, Energy, Information and Communication (ICCPEIC). 978-1-5090-4324-8/17/$31.00 ©2017 IEEE
[5]. Jagdeep Singh, Amit Kamra et.al “Prediction of Heart Diseases Using Associative Classification” 978-1-5090-0893-3/16/$31.00 ©2016 IEEE
[6]. Selzer, A. (1992). Understanding Heart Disease. Berkeley: Universityof California Press.
[image:5.595.81.261.412.493.2][8]. Rifki Wijaya, Ary Setijadi Prihatmanto,et.al “Preliminary Design of Estimation Heart disease by using machine learning ANN within one year” , 2013 Joint International Conference on Rural Information & Communication Technology and Electric-Vehicle Technology (rICT & ICeV-T) November 26-28, 2013, Bandung-Bali, Indonesia, 978-1-4799-3365-5/13/$31.00 ©2013 IEEE
[9]. Wikipedia.(2018)
Https://Simple.Wikipedia.Org/Wiki/Heart_Disease
[10]. American Heart Association (2017)
[11]. American Heart Association 2017, Http://Www.Heart.Org/HEARTORG/Conditions/
Arrhythmia/Arrhythmia_UCM_002013_Subhomepage.Jsp
[12]. Team Dr Lab path labs
(2017)Https://Www.Lalpathlabs.Com/Blog/What-Are-The-Different-Types-Of-Heart-Diseases/
[13]. Kusuma.S1, Divya Udayan, “Machine Learning and Deep Learning Methods in Heart Disease (HD) Research, International Journal of Pure and Applied Mathematics,
Volume 119 No. 18 2018, 1483-1496, ISSN: 1314-3395 (on-line version)url:http://www.acadpubl.eu/hub/Special Issue.
[14]. Nazneen Akhter, Sumegh Tharewal, Hanumant Gite, K. V. Kale , “Microcontroller Based RR-Interval Measurement Using PPG Signals for Heart Rate Variability based Biometric Application”, 2015 International Conference on Advances in Computing, Communications and Informatics (ICACCI) 978-1-4799-8792-4/15/$31.00_c 2015 IEEE
[15]. Uci. 2010. V. A. Medical Center, Long Beach and Cleveland Clinic Foundation: Robert Detrano, M.D., Ph.D. [Online]. Available: http://archive.ics.uci.edu/ml/machine-learning-databases/heart-diseas e/heart-disease.names.