On the Spectrum and Energy Efficiency in
Dynamic Licensed Shared Access Systems:
A Multiobjective Optimization Approach
SAMUEL O. ONIDARE , KEIVAN NAVAIE , (Senior Member, IEEE), AND QIANG NI , (Senior Member, IEEE)
School of Computing and Communications, Lancaster University, Lancaster LA1 4WA, U.K.
Corresponding author: Keivan Navaie (k.navaie@ lancaster.ac.uk)
This work was supported by the National Information Technology Development (NITDA), through the Federal Ministry of Communications Technology, Federal Republic of Nigeria, European H2020-MSCA-RISE-2015 Project, ATOM 690750, and UK Engineering and Physical Sciences Research Council (EPSRC) under Grant EP/S009620/1.
ABSTRACT In licensed shared access (LSA) systems, the protection of the incumbent in the shared spectrum may degrade the spectrum and energy efficiency of the licensee. In this paper, we examine the optimization of these two performance metrics in a LSA vertical sharing scenario between an airport incumbent, and a mobile network operator licensee. Considering a restriction zone of a pre-defined radius, we derive the probability of the incumbent’s interference threshold and then formulate a power allocation scheme as a multi-objective optimization of both energy and spectrum efficiency. We then adopt the weighted sum method to convert this multi-objective optimization into a single objective optimization and convert that into a quasi concave optimization problem. The optimum power allocation is then obtained using fractional programming. We further investigate the impact of various critical operational parameters in conjunction with the two performance metrics. Simulation results indicate a significantly improved energy efficiency in the licensee network as well as the spectrum efficiency comparable to even when the LSA spectrum utilization is unrestricted by the incumbent’s maximum interference threshold. Furthermore, we show that with careful selection of the licensee eNodeB coverage radius, transmit power, and users number per eNodeB coverage area, one can engineer the best possible trade-off between the spectrum and energy efficiency.
INDEX TERMS Energy efficiency, interference probability, licensed shared access (LSA), spectrum efficiency.
I. INTRODUCTION
In the ultra-dense heterogeneous network environment of the 5G, it is exceedingly important to ensure that the maximum interference threshold of each of the co-existing system is not exceeded. This is more so in order to protect the right of exclusivity of the primary owners in a dynamic spectrum sharing scheme (DSS) [1]. The licensed shared access (LSA) facilitates dynamic spectrum sharing between the original owner of a frequency band, the incumbent, and additional user(s) referred to as the licensee, who is/are authorized to use the spectrum (or part of the spectrum) in accordance with defined rules included in their spectrum usage rights [2].
LSA aims to ensure a certain level of guarantee in terms of spectrum access and quality of service for both the
incum-The associate editor coordinating the review of this manuscript and approving it for publication was Derek Abbott .
bent(s) and LSA licensee(s); but more importantly, protec-tion of the incumbent(s) against harmful interference. This implies the viability of the LSA is largely dependent on keep-ing the interference generated by the licensee’s transmission below the incumbent’s interference threshold. This is more pertinent when the incumbent includes critical public safety and national security organisations such as the aeronautical telemetry or military radar systems.
The implication of protecting the incumbent’s system from harmful interference is the creation of exclusion, protection, and restriction zones, where the licensee is not permitted to transmit or must reduce its transmission power level signif-icantly. The resulting effect of this is a possible degrada-tion of the licensee network spectrum efficiency (SE) and by extension its energy efficiency (EE). For instance, if the incumbent is an airport, the exclusion zone could be about 25 km radius [3] or excluding over sixty percent (60%) of the
United States (US) population if the incumbent is the United States Department of Defence. This amounts to a significant spatial under-utilization of the spectrum, one of the main cause of ‘spectrum scarcity’ that the LSA is meant to address. In the same vein, operating at reduced transmission power in the restriction zone could lead to a significant decrease in the licensee system SE and EE. In view of the objective of the LSA and the spectrum sharing paradigm, this is an unde-sirable situation [4]. Furthermore, the exponential growth of bandwidth demand [5], as well as the 5G SE requirement goal [6], necessitate high spectral efficiency in any 5G technology. Similarly, the unexpectedly high increase in power consump-tion of the informaconsump-tion and communicaconsump-tion technology (ICT) sector [7] when compared with the slow rate of achieved improvement in battery power [8], has also made EE a fun-damental design consideration of future wireless systems.
Nevertheless, simultaneously increasing the system SE and EE is not always achievable as both metrics often conflict one another. In wireless communication resource allocation problems, obtaining a trade-off between the SE and EE seems to be the achievable practical solution [9]. It thus becomes imperative, in a LSA spectrum sharing, to balance the man-agement of the incumbent’s tolerable interference with the licensee’s network performance. In this paper, we optimize the licensee’s, a mobile network operator (MNO) system, SE and EE while ensuring that the maximum interference threshold of the incumbent, an airport traffic control (ATC) system, is not exceeded.
A. RELATED WORKS
Different aspects of the LSA have been investigated in the literature. The regulatory framework for the LSA is provided in [2] while [10] provided operational and technical informa-tion to facilitate seamless sharing between incumbents of the 2.3 GHz -2.4 GHz frequency band and MNOs. The provided technical specifications are basically for the long term evolu-tion (LTE) system, as the band has been hitherto christened ‘‘LTE band 40’’ by the 3rd Generation Partnership Project (3GPP). The work in [11] proposed a spectrum allocation algorithm which recommends both a fair allocation policy on one hand and a penalty policy for violators of spectrum shar-ing rules. In [12], the idea of an auction-based LSA spectrum allocation was proposed. The proposed scheme’s main aim was revenue maximization in order to increase incumbent(s) motivation to participate in LSA while also ensuring higher satisfaction for the licensee(s).
The authors of [13] developed a generic cognitive radio system trial environment (CORE) to experimentally validate dynamic spectrum sharing. The test carried out on a LSA type scheme, the authorised shared access, confirmed the practical viability of the scheme. A major requirement of the LSA is the protection of the incumbent from harmful interfer-ence from the licensee’s transmission. In [14], interferinterfer-ence measurements are conducted to determine the interference protection ratio for a LSA sharing between a MNO as the
licensee and programme-making and special events (PMSE) wireless cameras as the incumbent.
Feasibility of the LSA is also demonstrated in [15] using a live field trial of spectrum sharing between a MNO licensee, and a PMSE incumbent system. The results show that the evacuation of the licensee from the LSA spectrum, when needed by the incumbent, is possible at a reasonable amount of time and without adversely affecting the desired quality-of-service to its end users. Regulatory requirements of such sys-tems are further studied in [16] based on an experimental field trial. The study examined licensee compliance with defined incumbents protection requirements and sharing rules such as the interference -to- noise ratio, maximum allowed interfer-ence level for different incumbents protection zone as well as the allowed effective isotropic radiated power for their respective restriction zones.
The authors of [17], developed a mathematical model as well as a simulator for the LSA operation through which they provided insights on performance metrics such as service request blocking probability, probability of the LSA spec-trum’s unavailability, and the average number of users that suffer service interruption as a result of the spectrum not being available. It is important to note that up to this point, none of these works have given due consideration to the achievable bit rate and EE of the LSA scheme, especially that of the licensee’s.
A critical limiting factor of the LSA is the existence of an often large exclusion zone, which is defined to protect the incumbent’s communications. In the exclusion zone, the licensee operation is completely suspended while the incumbent system is active [3]. In addressing this challenge,
the EU funded ADEL (Advanced Dynamic spectrum 5G
mobile networksEmployingLicensed shared access) project proposeddynamic sharingas one of the several extensions to the LSA in [18]. The authors of [19] then suggested two algorithms: proportional fairness, and ranking based for this dynamic form of the LSA. The work in [20] submits that the dynamic LSA sharing can be actualised by employing the radio environment map (REM) to detect the specific area of the incumbent’s activity at a particular time instance.
Describing a scenario involving an airport system as the incumbent and a MNO licensee, the authors of [3] proposed a reduced transmit power regime to implement this dynamic LSA. Formulation of the mathematical model of the reduced transmit power is provided in [21], while [22] further shows the impact of limiting transmission power on the achievable rate. Although [22] shows that the licensee network may experience a reduction in the achievable capacity, which is indeed much better than zero capacity due to complete sus-pension, it does not examine the achieved EE in the licensee network, neither does it investigate the improvement of the overall SE.
number of connected users, service failure in [26], [27]. The authors of [26], [27] also analyse the performance of dynamic LSA adopting tools of queueing theory and Markov process. The work in [28] recommended the LSA for the flexible spectrum management requirement of the ‘smart city’ in the emerging 5G era. Similarly, the LSA is considered as one of the candidate solutions to unexpected network downtime in public safety network during disaster outbreak and rescue operations [29]. However, they examined neither the LSA’s SE nor its EE.
Furthermore, the authors of [30] demonstrated that LSA resources can be optimized either by reducing transmit power or adjusting antenna downtilt angle to protect the incumbent from suffering harmful interference. Results obtained from the simulation for the three different incumbent systems considered, revealed improvement in throughput, when each of the proposed interference reduction method (antenna downtilt or power reduction) is used. However, the work specifically examined how their proposed imple-mentation of dynamic LSA impacts on the number of licensee cells in the exclusion zone that needs to be shut down, when the incumbent is making use of its spectrum.
In [31], it was demonstrated that using opportunistic beamforming for resource allocation and scheduling of the secondary system in a LSA sharing between two MNOs, the overall throughput of both networks can be improved. However, the work in [31] is a horizontal sharing scheme and not a vertical sharing scheme. Moreover, the challenge of the incumbent’s maximum tolerable interference was not consid-ered. The interference threshold constraints of the primary user and the quality of service (QoS) requirement of the sec-ondary user is considered in a multi-objective optimization of the SE and EE in [32]. However, the spectrum sharing system considered is an opportunistic spectrum sharing scheme that lacks the well-defined rules and coordination of the LSA. Similarly, authors of [33] investigated the EE and area SE of a three-tier heterogeneous hybrid of millimetre Wave and sub-6 GHz networks. Contrary to our work, the investigated system in [33] assumed the traditional fixed spectrum access.
B. CONTRIBUTIONS
In this paper, we consider a more sensitive vertical LSA sharing between an airport incumbent and a MNO licensee. We focus on the optimum system efficiency (EE and SE) of the licensee in a vertical LSA sharing scheme while the incumbent’s interference threshold is not exceeded during the period the LSA spectrum is not available. In our work, we maximize the licensee system’s EE and SE while both the incumbent, the airport radar system, and the licensee, a cellular MNO, (two different systems) are transmitting simultaneously. We further investigate the effect of critical operational parameters on both performance metrics and analyse the trade-off between them.
Considering a LSA system with an exclusion zone as in [3], we obtain the distribution of the licensee’s interference and from there derive the received maximum interference
probability of the incumbent. This is then imposed as a constraint on the operating transmission power of the MNO during the period of communication between the ATC and aircrafts landing or taking off. Furthermore, we formulate the optimization of the licensee’s system efficiency as a multi-objective problem (MOP). Using the weighted sum approach and the fractional programming method, subject to the trans-mission power and the incumbent’s interference threshold constraint, we then obtain the optimal power allocation.
In addition, we analyse the improvement obtained by our proposed method by comparing the achievable EE and SE of the licensee when operating under the restriction of reduced transmit power (i.e. when LSA spectrum is busy) and when the spectrum is always available with the ability to transmit at maximum power. Simulation results indicate a signifi-cantly improved EE in the licensee network as well as the SE comparable to even when the LSA spectrum utilization is unrestricted by the incumbent’s maximum interference threshold. The impact of the investigated operational param-eters, eNodeB radius, transmit power and number of chan-nels, also provides useful quantitative insight for practical design considerations of a LSA network deployment. Finally, we examine how the network design priorities and circuit power affect the achievable SE and EE trade-off.
C. ORGANIZATION OF THE PAPER
The rest of this paper is organised as the following. In Section II, we present the system model and derive an expression for the maximum interference probability. Then in Section III, we formulate the system operation using a multi-objective optimization problem to optimize both EE and SE subject to the interference threshold. We then adopt the weighted sum method to convert this multi-objective opti-mization into a single objective optiopti-mization and further find the solutions by using fractional programming. In Section IV we discuss the simulation results and finish the paper by drawing conclusions in Section V.
II. SYSTEM MODEL
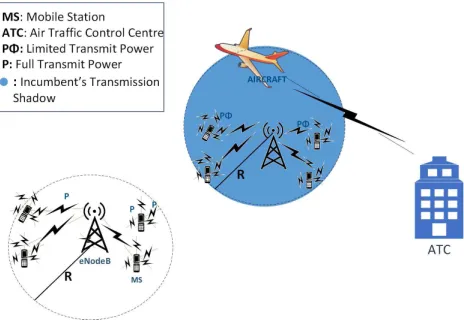
We consider a circular exclusion zone, an incumbent system, and a LSA licensee with multiple eNodeBs each with a circular coverage area of radiusR, see, Fig.1. The incumbent uses the spectrum solely to communicate with the aircraft(s) during landing or take-off. During the time of such com-munication, the spectrum is referred to as busy or unavail-able, otherwise, the spectrum is free for unrestricted MNO access. For easy references, the symbols used in this paper are given in Table I. Each of the incumbent and licensee systems perform based on their own standards and the coordination among the nodes in each of the systems above remains the same as it was without using LSA.
FIGURE 1. LSA system model: Limited power is only necessary at the regions where incumbent’s transmission shadow (blue shaded circle) intersects with the licensee eNodeB coverage area.
k=1,2, . . . ,Kand3is the number of transmitting antenna. Thus the channel input-output relationship is:
Xk =HkP+N, (1) where Xk is the channel output, P = [P1, . . . ,P3] is the
transmit power vector, and N is the complex noise, for the
kth UE. Furthermore, we also assume that the transmission link from the ATC to the aircraft uses the same channel as our licensee uplink transmission and equivalently the reverse link, i.e., from the aircraft to the ATC, uses the same channel as the MNO downlink.
In practice, the justification for using LSA is made for small airports with a rather low air traffic. In such cases, one may consider the fact that an airplane will not receive interference in all places within the exclusion zone but rather in just a very small portion of it, i.e., precisely where the licensee transmission is within the shadow radius, [3], [21]. Furthermore, the requirements set by the LSA framework ensure the incumbent system is protected from harmful inter-ference hence its reliability is not compromised. Based on the LSA, the incumbent and licensee are expected to have agreed on the specifications of their communications systems to ensure safe operation for the incumbent. In addition, the ATC interference threshold and the interference probability are designed conservatively enough to ensure the reliability of the ATC.
A. RECEIVED INTERFERENCE
In this section, we consider the interference on the ATC transmission to the flying aircraft during take-off or landing. We assume that the eNodeB antenna height is sufficiently low relative to the ATC tower with a directional pattern, (tilted downwards to the UE). Therefore, the omni-directional uplink transmissions of the UE become the main component of the interference signal.
We further consider the spatial distribution of the active UE in the eNodeB coverage area as a Poisson Point
TABLE 1.List of parameters.
Process (PPP),
ϕ = {k1,k2, . . .kK}. (2)
The interference received at a given aircraft located atyin the vicinity of the cellular network is therefore,
Iϕ(y)=X
k∈ϕ
Pkhkl(kya−ykk), (3)
We then define the distance between the aircraft and a node,{kya−ykk,{yk ∈ ϕ}}as krk ≤ Dand the interven-ing area between them can then be represented as a sphere
[image:4.576.301.530.81.528.2]of d-dimensional unit hyper - ball. Based on the above, the interference received at the aircraft from UE located within distanceDof the aircraft is
ID=
X
r∈ϕI
l(r). (4)
The following proposition gives the probability density func-tion (pdf) ofID.
Proposition 1:The pdf of the received interference is
fI(i;θ) = 1 πi
∞
X
k=1
0(θk+1)
k! λ
Iπ0(1−θ)
iθ
k
sinkπ(1−θ),
= 1
πi
∞
X
k=1
0(θk+1)
k! ρ
iθ
k
sinkπ(1−θ), (5)
whereθ= 2
n,0(·) is the gamma function,ρ=λIπ0(1−θ), and limr→0,l(r)= ∞, and limr→∞l(r)=0.
Proof:ForIDwe write,
FID(ω)=E{expjωID}, (6)
whereF(·) andE{·}are Fourier transform, and expectation
operator, respectively. We then writeFID(ω) as the follow-ing:
FID(ω)=E{E{expjωID|k}} =
∞
X
k=0
exp−λIπD2(λ
IπD2)k
k! E{exp
jωID|k}. (7)
Locations of the UE within b(y,D) are random variables determined by the direction and speed of movement of users from their previous location. We assume that the initial dis-tribution of the UE before movement follow a radial density as follows:
fR(r)=
2r
D2 0≤r≤D,
0 otherwise.
(8)
The interference,ID, is the summation of independent random variables, therefore,E{expjωID|k}is
E{expjωID|k} =
E{expjωl(r)} k , = Z D 0 2r D2exp
jωl(r)dr k
. (9)
Combining (6), (7), and (9) yields:
FID(ω)=exp
λIπD2
−1+
Z D 0
2r D2exp
jωl(r)dr
. (10)
SettingD → ∞,r(x) =l−1(x), followed by straightfor-ward manipulations, it is then easy to show that
lim
D→∞FID(ω)
= lim
D→∞D
2−1+Z D 0
2r D2exp
jωl(r)dr,
= Z ∞
0
(l−1(x))2jωexpjωxdx. (11)
Therefore,
FI(ω)=exp
jλIπω
Z ∞ 0
(l−1(x))2expjωxdx
. (12)
Applying the standard path-loss model,l(r) = r−n, (12) is then reduced to:
FI(ω)=exp
jλIπω
Z ∞
0
x−2n expjωxdx
. (13)
The transmission path between the UE interferers and the aircraft is characterised by the ground- aerial channel model. Hence
r= q
gd2+vd2, (14) wherer is the distance between the UE and the aircraft,gd andvdare the horizontal distance and height between the UE and aircraft. Ifn ≤ 2, the integral in (13) diverges hence, the interference is infinite [34]. However, whenn>2, then, 0<2n <1 and (13) is further simplified to
FI(ω)=exp
−λIπ0(1−θ) exp−πθ2 ωθ
, ω≥0, (15)
whereθ= 2
n, andFI
∗(−ω)=F I(ω).
The following proposition proofs thatn>2.
Proposition 2: The air- to -ground (ATG) channel path loss (PLATG) between the licensee UE and the aircraft is
equivalent tor−(2+δ), δ >0.
Proof: We first show that the ATG channel can be approximated by the standard path-loss model,l(r) = r−n
and then we show thatn >2. The ATG path - loss in dB is [35]:
PLATG(dB)=FSPL+1%, (16)
where FSPL is the free space path-loss,1is the excessive path-loss which depends on the propagation group % ∈ {LoS, NLoS}. Thus:
PLATG= (
FSPL+1LoS %=LoS,
FSPL+1NLoS %=NLoS. (17)
The spatial expectation of the path-loss between the aircraft and all UE can thus be expressed as:
E{PLATG(dB)} = X
%
PL%Pr{%}, (18)
where Pr{·}is the probability of occurrence of line of sight (LoS) or non-line of sight (NLoS) propagation which is linked by the expression
Pr{LoS} =1−Pr{NLoS} (19)
By the virtue of (19), we have two extremes: (i) when the Pr{LoS} =1, which implies only LoS propagation and (ii) when Pr{LoS} =0, which is when only NLoS propagation exists between all the UE and the aircraft. Thus assuming only LoS propagation, (16) in watts is:
PLLoS(w)=10
From (20) and applying the standard distance - path loss relation, PL∝r−n, we can write
r−n=r−(2+δ) δ >0. (21)
where the index ’2’ is the path loss exponent for FSPL and δ is the exponent of the excessive path loss. Since path-loss exponent n for NLoS is shown to be greater than 2, and 1NLoS1LoS, hence we can conclude thatn>2.
Following the same line of argument as in [36], the pdf of (15) is then estimated as an infinite series. Applying to it inverse Fourier transform, we then obtain
fI(i;θ)= 1 πi
∞
X
k=1
0(θk+1)
k! λ
Iπ0(1−θ)
iθ
k
sinkπ(1−θ)
= 1
πi
∞
X
k=1
0(θk+1)
k! ρ
iθ
k
sinkπ(1−θ), (22)
whereρ=λIπ0(1−θ), andfI(i;θ) is the pdf of the received
interference.
B. INTERFERENCE THRESHOLD
When the incumbent is transmitting on its spectrum, the licensee has to adjust its transmission appropriately to pre-vent outage or disruption in the ATC communication. At these time instants, the licensee must adjust its transmit power to ensure that the maximum incumbent’s tolerable interference (the interference threshold) is not exceeded. This requirement is expressed by the interference probability equation [37]:
Pr
I >Ith ≤ζ, (23)
where ζ 1 denotes the maximum probability that the
interference is larger than the threshold that can be tolerated by the incumbent system.
To derive the expression for the constraint placed on the licensee operation as stated in (23), we proceed by taking the integral of the distribution function in (22) withIthas the limit
of the integration interval:
PrI ≤Ith =
Z Ith
0 Pk 1 πi ∞ X
k=1
0(θk+1)
k! ρ
iθ
k
sinkπ(1−θ)di. (24)
Equation (24) is the cumulative distribution of (22) ati=Ith
scaled byPk. Following the same line of argument as in [36], this can be approximated as an infinite series
PrnI ≤Ith o
= 1
π ∞
X
k=1
Pk0(θk)
k! ρ
Ithθ
k
sinkπ(1−θ). (25)
Thus, the probability of exceeding the incumbent’s interfer-ence threshold can then be written as:
PrnI >Ith o
=1−1
π ∞
X
k=1
Pk0(θk)
k! ρ
Ithθ
k
sinkπ(1−θ). (26)
C. UE MOBILITY MODEL
In this paper, we adopt the random waypoint model to char-acterise the mobility of the UE in a circular eNodeB coverage area of radiusR. Before moving, the UE are initially placed randomly in the eNodeB coverage area with a radial density according to (8). LetT represent the total travel time andj
the index of different travel times either side of the pause time Tp. If the randomly selected speed of movement of the UE is denoted byV and their corresponding destination is represented byM, the UE mobility process can then be characterised [38] as
Mj,Tp,j,Vj
=
M1,Tp,1,V1, . . . ,MN,Tp,N,VN ∀j=1, . . . ,N,
(27)
whereMj is the destination point of a UE at a specific jth travel time, withMj 3 {Xj,Yj},Tp,j,is the pause time atMj andVjis the velocity of the UE during thejthtravel time.
For the circular eNodeB coverage area of radiusR, the ran-dom destination pointsMj3 {Xj,Yj} =Mj3 {pj, ϑj}in polar coordinates has their pdf given as [39]
fM(p;ϑ)= 1
πR2 for 0≤p≤R, and 0≤ϑ≤2π. (28)
Furthermore,Tpis chosen from the interval [Tp,min,Tp,max]
with an arbitrary pdf and expected value E{Tp} and Vj is randomly and uniformly chosen from [Vmin,Vmax] under the
assumption thatVmin>0 andTp,min≥0 [38]. III. ENERGY AND SPECTRUM EFFICIENCY
Following the convention adopted in [40], we define UE to eNodeB sub-channel setK=[1, . . . ,k], the normalised sub-channel gain over noise from UE to eNodeB as g and the transmit power asPk and thus the total SE is
C=
K
X
k=1
log21+Pkg
k
· (29)
The total consumed power,PSis
PS=Pc+ 1
K
X
k=1
Pk,
wherePcis the circuit power andis the amplifier efficiency. The circuit power is the consumed power in the electronics of the transmitter. Transmission power is the actual transmitted signal power. In many cases, the circuit power is constant and the transmission power is adjusted based on the resource allocation strategy. Therefore, EE,ηis:
η= C
PS
. (30)
A. OPTIMAL POWER ALLOCATION
problem:
max P
{C, η},
s.t. PrI>Ith ≤ζ,
Pk >0,k=1,2, . . . ,K. (31) To obtain the solution to the above problem, we adopt the weighted sum method which converts the multi objective optimization problem in (31) to a single objective optimiza-tion problem by assigning weights to the objectives [41] as the following:
max
P w(
C
Cmax)+(1−w)
η ηmax,
s.t. 1− 1
π ∞
X
k=1
Pk0(θk)
k! ρ
Ithθ
k
sinkπ(1−θ)≤ζ,
Pk >0, k=1,2, . . . ,K. (32)
The main challenge in using the weighted sum method for solving a MOP is to establish a consistent comparison between the different objective functions. Hence the two con-flicting objectives (SE and EE) are normalized withCmax, and ηmax, correspondingly. In this formulation,Cmax, andηmax
are defined as the maximum achievableC andηwhen the spectrum is idle such that the licensee transmit power is not constrained by the interference threshold. The optimization problem in (32) is then converted to a minimization as the following: min P w Cmax C
+(1−w)
ηmaxP
s
C
,
s.t. 1− 1
π ∞
X
k=1
Pk0(θk)
k! ρ
Ithθ
k
sinkπ(1−θ)≤ζ,
Pk >0,k=1,2, . . . ,K, (33)
and equivalently (33) is
max P
C
wCmax+(1−w)ηmaxP
s
,
s.t. 1− 1
π ∞
X
k=1
Pk0(θk)
k! ρ
Ithθ
k
sinkπ(1−θ)≤ζ,
Pk >0,k=1,2, . . . ,K, (34)
Proposition 3: The objective function in (34) is strictly quasi-convex.
Proof:We show thatC in (34) is a convex function of
Pk. By substituting (29) into (34), we have:
C =max Pk
K
X
k=1
log21+Pkgk
. (35)
Therefore,
∂C
∂Pk
= gk
2 ln(2)(1+Pkgk)
. (36)
To investigate the convexity ofC, here we obtain its Hessian, ∂2C
∂Pk2
= − (gk) 2
2 ln(2)
1
(1+Pkgk)2
<0, (37)
As it is seen, ∂∂2C Pk2
≤ 0, therefore,C is concave. Thus, (34) is a ratio of a concave to an affine function, and according to [42] the objective function is strictly quasi-convex.
Since the objective function in (34) is strictly quasi-convex, the solutions of this problem can be obtained using fractional programming [43]. Using the Charnes-Cooper transforma-tion [44], a ratio of a concave to an affine functransforma-tion optimiza-tion problem of the form: max
x f(x)
g(x) can be transformed into a
convex optimization problem as:
max t,x t
·fφ t
s.t. t·gφ t
=1, ∀i=1, . . . ,I (38) by using the transformation variable:φ = x
g(x),t = 1
g(x),
wheret>0.
Adopting similar techniques we introduce9 =wCmax+
(1−w)ηmaxPs]−1, and thus the equivalent concave optimiza-tion problem is as the following.
max Pk,9
9·C, 0<w<1, s.t.9· wCmax+(1−w)ηmaxPs
=1
1− 1
π ∞
X
k=1
Pk0(θk)
k! ρ
Ithθ
k
sinkπ(1−θ)≤ζ,
Pk >0 k=1,2, . . . ,K· (39)
The Lagrangian function corresponding to (39) is:
L(Pk,u, χ,vk)
=9C+u
9 wCmax+(1−w)ηmaxPs−1
−χ
1− 1
π ∞
X
k=1
Pk0(θk)
k! ρ
Ithθ
k
sinkπ(1−θ)−ζ
+
K
X
k=1
vkPk· (40)
The stationarity conditions corresponding to the Lagrangian in (40) are:
∂L(Pk,u, χ,vk) ∂Pk
=0, ∂L(Pk,u, χ,vk)
∂9 =0,
which are respectively written as:
gk·9
2 ln(2)(1+Pkgk)
+u·9 (1−
w)ηmax
−χ8k+vk =0 (41)
and
C+uwCmax+(1−w)ηmaxPs
FIGURE 2. SE, EE, and the Trade-off curves.
FIGURE 3. Effect of UE movement on the SE, EE, and the Trade-off curves.
TABLE 2. Simulation parameters.
The optimal power allocation is then obtained as
P∗k = 9.
2 ln(2)χ8k−u9(1−w)ηmax
−
1
gk, k=1,. . .,K·
(43)
where8k = π1P∞k=10 (θk)
k!
ρ Ithθ
k
sinkπ(1−θ).
FIGURE 4.Effect ofIthon EE vs. Transmit power for different user number.
IV. SIMULATION RESULTS AND ANALYSIS
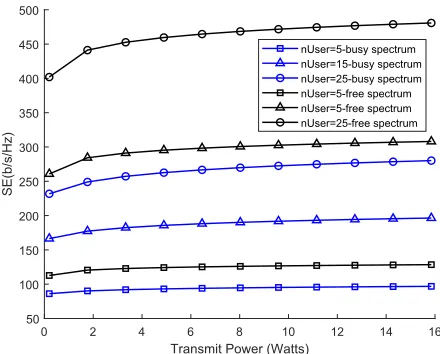
[image:8.576.300.534.382.586.2] [image:8.576.39.276.418.619.2]FIGURE 5. Effect ofIthon SE vs. Transmit power for different user number.
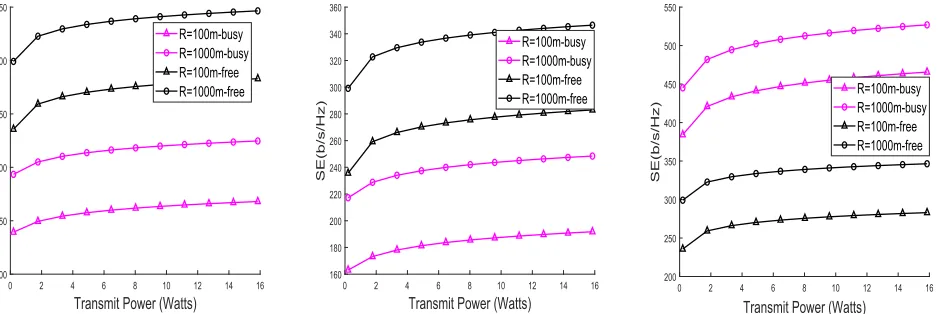
FIGURE 6. Effect ofIthon EE vs. Transmit power for different eNodeB coverage radius.
and their trade-off has a direct relationship with increasing number of users present in the licensee eNodeB coverage area. Fig. 3 examined the impact of the UE movement on the system’s EE and SE and their trade-off. The five different time steps plotted show that there is no significant variation in the investigated performance metrics as a result of the changing location of the UE.
Figs.4and5, show the effect of the interference threshold constraint on the licensee system’s SE and EE. We compare both metrics when the spectrum is free, when not constrained by the incumbent’s maximum tolerable interference, and when it is, i.e. when the spectrum is busy. For the EE vs. trans-mit power, instead of a monotonically decreasing function observed for the free spectrum curve, the busy spectrum curve gently increases monotonically. This is due to the optimal power allocation adopted to boost the performance of the licensee during the busy spectrum. However, the full impact of reduced transmission power on the SE is reflected in Fig.5, where the SE during the period when the spectrum is free is better than when the spectrum is busy.
[image:9.576.47.265.271.447.2]FIGURE 7. Effect ofIthon SE vs. Transmit power for different eNodeB coverage radius.
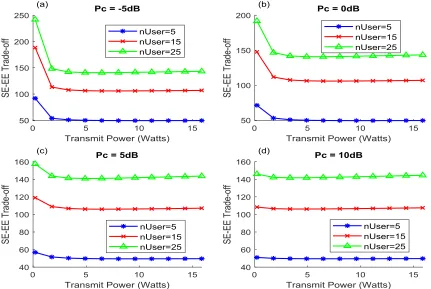
FIGURE 8. Effect ofwon SE-EE Trade-off vs. Transmit power for different user number.
[image:9.576.316.515.288.645.2]FIGURE 9. Effect ofwon SE-EE Trade-off vs. Transmit power for different eNodeB coverage radius.
FIGURE 10. Comparison of free and idle spectrum SE vs. Transmit power at different values ofw.
a slight increase with increasing transmit power, the reverse is the case in the non-optimized free spectrum system, where the observed marginal difference decreases further with increas-ing transmit power. Consequently, in Figs.6and7, we show the effect of different eNodeB coverage radius on the contrast between the licensee network EE and SE when the LSA spec-trum is free and when it is busy. With increasing radius, the EE of the non-optimized system approximately converges to the same value with increasing power, while in the optimized
system, the increase with increasing eNodeB coverage radius remains approximately constant for increasing power. The SE for different radius displays the same trend observed for different number of UE.
A. EFFECT OF IMPORTANCE WEIGHT ON THE EE-SE TRADE-OFF
[image:10.576.55.525.404.561.2]optimization objective function in (34). In Fig.8, it is seen that atw= 0, the SE-EE optimization reduces to a EE problem while whenw= 1, the joint-SE-EE optimization tends to a SE optimization. Also noteworthy is the shape and magnitude of the SE-EE trade-off curve as we move from where the EE is dominant, (i.e., atw =0) to the other extreme where the system’s SE is dominant (i.e., atw = 1). We observe that as ‘w’ increases, the SE-EE trade-off curve changes from a monotonically decreasing function to an increasing function. Furthermore, the magnitude of the trade-off function shows a five times (5×) increase between the two extremes ofw.
A similar trend in terms of the magnitude of the trade-off function is observed in the graph for the effect ofwfor different eNodeB coverage radius in Fig. 9. Analogously, the variation in the shape of the curve is akin to the obser-vation in Fig. 8. At w = 0, the curve is monotonically decreasing. The same trend is observed atw=0.3, but with a less steep slope. However, atw = 0.7, the curve initially decreases, reaches a minimum at approximately the 2wmark, and then gradually increases. Atw=1, the curve reverts to a monotone but increasing function of transmit power.
In Fig.10we examine how the importance weight param-eter, w, impacts on the free and idle spectrum SE of the licensee. As it is seen from the graphs, in the trade-off section betweenw=0.1−0.9 (i.e., Fig.10a, &b), the achievable SE is higher during the period the licensee has the LSA spectrum to itself alone than when the spectrum is occupied by the incumbent. But atw = 1, when the SE totally dominates the SE-EE joint optimization function, the relationship is reversed, with the licensee achieving better SE during the period the LSA spectrum is busy than when the spectrum is free. Expectedly, the magnitude increases with increasing number of transmitting UE.
On one hand, this can be attributed to the fact that the system with busy spectrum is, in fact, an optimized system in terms of SE, and not optimized for the case where the spectrum is free. On the other hand, when the difference between the interference from the licensee system and the incumbent’s threshold is small, the required reduction in the licensee transmit power could be minimal/marginal. The optimal power allocation adopted for the busy spectrum thus results in a higher SE than the free spectrum SE which is not optimized. Furthermore, we note that atw=1, the joint optimization function is no longer a trade-off between SE-EE, but an outright optimization of the SE only. This is in agree-ment with what was observed in Fig. 3, which indicates a 5× increase in the objective function between w = 0 andw=1.
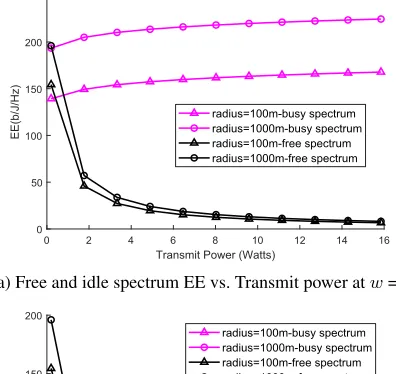
[image:11.576.314.512.70.257.2]The effect ofwon the system’s EE was also investigated in Fig. 11. It is seen that at w = 0.1, the EE of the busy spectrum out performs that of the free spectrum. This is a combination of two effects: the increase in the SE as a result of the optimal power allocation and a reduction in transmit power due to the limited power regime during the time the spectrum is busy. Nominally, the EE is a decreasing function of transmit power as seen in the free spectrum EE vs. transmit
FIGURE 11. Comparison of free and idle spectrum EE vs. Transmit power at different values ofw.
power curve. However, the SE-EE joint optimization pro-duces a gently increasing EE vs. transmit power curve. This combined with the reduction in the total power consumed as a result of limited transmit power, further accounts for a better EE during the busy spectrum. The same trend was observed for all values ofw<1. Furthermore, the achieved EE for different values ofw<1 is approximately the same, while increase in eNodeB coverage radius translates to a larger achieved EE value. However, whenwexactly equals 1, the EE curve for the busy spectrum lies on the x-axis. This is expected because, atw=1, the joint SE-EE optimization strictly becomes an SE optimization problem and the EE of the system, no longer comes into play in the optimization objective.
B. EFFECT OF CIRCUIT POWER ON THE EE-SE TRADE-OFF
After examining the effect of the trade-off priority, the impor-tance weightwon the licensee network performance, we then proceed to investigate how the circuit power (Pc) impacts on our optimization objective. In Fig.12, we plot the SE-EE trade-off function against eNodeB transmit power for differ-ent values ofPcat different importancew.
FIGURE 12. Effect of different values ofPcon the trade-off function at differentw.
FIGURE 13. Effect ofPcon the trade-off function for different user number.
to lower value of the trade-off function especially forw=0 and w = 0.3 plots. At w = 0.7, there is a slight incon-sistency, with the largest value of Pc having higher values
especially at eNodeB transmit power above the 2w mark. Atw
[image:12.576.73.504.367.656.2]FIGURE 14. Effect ofPcon the trade-off function for different radius.
FIGURE 15. Comparison of free and idle spectrum SE vs. Transmit power at different values ofPc.
different values of w < 1, the values for the case when
Pc = −5dB, is approximately the same, while there is an increase with increasing value ofwfor the other three values of circuit power (Pc=0dB,Pc=5dB,Pc=10dB).
In Figs. 13 and 14, at a fixed value of the importance weight, w = 0.5, we investigate the trade-off function for
FIGURE 16. Comparison of free and idle spectrum EE vs. Transmit power at different values ofPc.
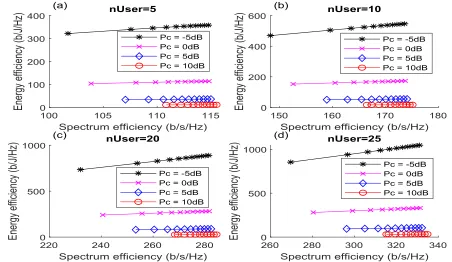
FIGURE 17. EE vs. SE for differentPcand users number.
Pc. This is consistent with the observation in the first 2 plots (i.e., a, & b) of Fig.12, where lowerPcvalue yields higher value of the trade-off function.
In Figs.15and16, we examine the effect of circuit power on the busy and idle spectrum SE and EE comparison respec-tively. As earlier observed at w = 1, the optimal power allocation model ensures a better SE for the busy spectrum than when the spectrum is free while the EE is significantly better especially atw=0. However, while the achievable SE
remains constant for different values ofPc, the EE shows a multifold increase with decreasingPcvalue. This is expected since the EE is a function of circuit power while the SE is not dependent on circuit power.
[image:14.576.60.512.340.602.2]traditional EE vs. SE curve, that increases exponentially to a peak value and then falls at a similar rate. The implication of this is that with the proposed optimal power allocation model, and especially using low circuit power, the EE-SE trade-off function can achieve simultaneous increase of both perfor-mance metrics under the incumbent’s interference threshold constraint.
V. CONCLUSION
In this paper, we examined the optimization of the EE and SE, two critical performance metrics of wireless networks in a LSA vertical sharing between an airport incumbent, and a MNO licensee. Considering a restriction zone of a pre-defined radius, we modelled the received interference by the incumbent from the licensee transmissions. We then formu-lated a multi-objective optimization of EE and SE subject to the incumbents’ maximum interference probability. We also investigated the effect of limiting the licensee transmission power as a result of the incumbent’s maximum interference threshold on the achievable EE and SE of its network and compare it with when it has the freedom to operate with its maximum transmission power. Furthermore, we investigated the impact of various critical operational parameters in con-junction with the two performance metrics and their joint trade-off function.
Results obtained indicate that by adopting the proposed optimal power allocation, the licensee system can even achieve a better EE during the period when the LSA spectrum is not available. The impact of limiting transmit power in order to comply with the incumbent interference require-ment is seen in the lower achievable SE of the licensee (at least 50%) as compared to when the LSA spectrum is available. However, by increasing the trade-off importance weight parameterwto favour the SE more than the EE, we can equally obtain a better SE during the reduced transmit power regime i.e., when the LSA spectrum is busy. Finally, it is seen that by proper selection of the trade-off priority parameter, the importance weight, and the circuit power, it is possible to achieve simultaneous maximization of both the SE and EE. The results presented in this paper provide quantitative insights on the performance of LSA and its feasibility in a rather sensitive application. The presented results can be fur-ther utilized in the design of LSA systems as proposed in [45]. For future work, it will be interesting to investigate these performance metrics in a three-tier dynamic sharing scheme like the United States citizens broadband radio ser-vice with spectrum assess system (SAS) [46]. Another pos-sible future work of interest is to analyse the performance of the co-existence of a Mobile/Fixed Communication Net-work operating local high-quality wireless netNet-works under the emerging evolved LSA (eLSA) scheme [45]. Note that it has been shown in [47] that for finite length codewords, in an opportunistic spectrum sharing systems with rate adap-tation, the system achievable rate can be severely affected by the length of the codeword. [47] shows that the secondary throughput is significantly decreased for short codewords
(less than 100 channel uses). This negative impact is however decreased by increasing the codeword length. Therefore, as a future work in LSA one can look at the optimal power allo-cation in both systems so that for a given codeword dropping probability in the incumbent system, the throughput of the licensee is maximized.
REFERENCES
[1] Q. Ni and C. C. Zarakovitis, ‘‘Nash bargaining game theoretic scheduling for joint channel and power allocation in cognitive radio systems,’’IEEE J. Sel.Areas Commun., vol. 30, no. 1, pp. 70–81, Jan. 2012.
[2] Report 205: Licensed Shared Access (LSA), CEPT Working Group Fre-quency Management, ECC, Copenhagen, Denmark, Feb. 2014. [3] A. Ponomarenko-Timofeev, A. Pyattaev, S. Andreev, Y. Koucheryavy,
M. Mueck, and I. Karls, ‘‘Highly dynamic spectrum management within licensed shared access regulatory framework,’’IEEE Commun. Mag., vol. 54, no. 3, pp. 100–109, Mar. 2016.
[4] A. Al-Dulaimi, A. Anpalagan, S. Al-Rubaye, and Q. Ni, ‘‘Adaptive man-agement of cognitive radio networks employing femtocells,’’IEEE Syst. J., vol. 11, no. 4, pp. 2687–2698, Dec. 2017.
[5] Ericsson Mobility Report, Ericsson, Stockholm, Sweden, Jun. 2018. [6] IMT Vision Framework and Overall Objectives of the Future Development
of IMT for 2020 and Beyond, dovument ITU-R (REC-M.2083-0), Interna-tional Telecommunication Union, Geneva, Switzerland, Sep. 2015. [7] B. Lannoo, S. Lambert, and W. Van Heddeghem, ‘‘D8. 1. Overview of
ICT energy consumption,’’ Eur. Union FP7 (SEVENTH FRAMEWORK), Brussels, Belgium, Tech. Rep. FP7-288021, 2012.
[8] K. Lahiri, A. Raghunathan, S. Dey, and D. Panigrahi, ‘‘Battery-driven system design: A new frontier in low power design,’’ inProc. Asia South Pacific Design Automat. Conf., Jan. 2002, p. 261.
[9] O. Amin, E. Bedeer, M. H. Ahmed, and O. A. Dobre, ‘‘Energy efficiency-spectral efficiency tradeoff: A multiobjective optimization approach,’’
IEEE Trans. Veh. Technol., vol. 65, no. 4, pp. 1975–1981, Apr. 2016. [10] ‘‘Electromagnetic compatibility and radio spectrum matters (ERM);
sys-tem reference document (SRdoc); mobile broadband services in the 2300 MHz–2400 MHz frequency band under licensed shared access regime,’’ ETSI, Sophia Antipolis, France, Tech. Rep. ETSI TR 103 113 V1.1.1, Jul. 2013.
[11] M. M. Butt, C. Galiotto, and N. Marchetti, ‘‘Fair and regulated spectrum allocation in licensed shared access networks,’’ inProc. IEEE 27th Annu. Int. Symp. Pers., Indoor, Mobile Radio Commun. (PIMRC), Sep. 2016, pp. 1–6.
[12] H. Wang, E. Dutkiewicz, G. Fang, and M. D. Mueck, ‘‘Spectrum sharing based on truthful auction in licensed shared access systems,’’ inProc. IEEE 82nd Veh. Technol. Conf., Sep. 2015, pp. 1–5.
[13] M. Matinmikko, M. Palola, H. Saarnisaari, M. Heikkilä, J. Prokkola, T. Kippola, T. Hänninen, M. Jokinen, and S. Yrjölä, ‘‘Cognitive radio trial environment: First live authorized shared access-based spectrum-sharing demonstration,’’IEEE Veh. Technol. Mag., vol. 8, no. 3, pp. 30–37, Sep. 2013.
[14] J. Kalliovaara, T. Jokela, R. Ekman, J. Hallio, M. Jakobsson, T. Kippola, and M. Matinmikko, ‘‘Interference measurements for Licensed Shared Access (LSA) between LTE and wireless cameras in 2.3 GHz band,’’ inProc. IEEE Int. Symp. Dyn. Spectr. Access Netw., Sep./Oct. 2015, pp. 123–129.
[15] M. Palola, M. Matinmikko, J. Prokkola, M. Mustonen, M. Heikkila, T. Kippola, S. Yrjola, V. Hartikainen, L. Tudose, A. Kivinen, J. Paavola, and K. Heiska, ‘‘Live field trial of Licensed Shared Access (LSA) concept using LTE network in 2.3 GHz band,’’ inProc. IEEE Int. Symp. Dyn. Spectr. Access Netw., Apr. 2014, pp. 38–47.
[16] D. Guiducciet al., ‘‘Sharing under licensed shared access in a live LTE network in the 2.3–2.4 GHz band end-to-end architecture and compliance results,’’ inProc. IEEE Int. Symp. Dyn. Spectr. Access Netw., Mar. 2017, pp. 1–10.
[17] V. Y. Borodakiy, K. E. Samouylov, I. A. Gudkova, D. Y. Ostrikova, A. A. Ponomarenko-Timofeev, A. M. Turlikov, and S. D. Andreev, ‘‘Mod-eling unreliable LSA operation in 3GPP LTE cellular networks,’’ in
Proc. 6th Int. Congr. Ultra Mod. Telecommun. Control Syst. Workshops, Oct. 2014, pp. 390–396.
[19] V. Frascolla, A. J. Morgado, A. Gomes, M. M. Butt, N. Marchetti, K. Voulgaris, and C. B. Papadias, ‘‘Dynamic licensed shared access–A new architecture and spectrum allocation techniques,’’ inProc. IEEE 84th Veh. Technol. Conf., Sep. 2016, pp. 1–5.
[20] B. A. Jayawickrama, E. Dutkiewicz, and M. Mueck, ‘‘Incumbent user active area detection for licensed shared access,’’ inProc. IEEE 82nd Veh. Technol. Conf., Sep. 2015, pp. 1–5.
[21] E. Mokrov, A. Ponomarenko-Timofeev, I. Gudkova, P. Masek, J. Hosek, S. Andreev, Y. Koucheryavy, and Y. Gaidamaka, ‘‘Modeling transmit power reduction for a typical cell with licensed shared access capabilities,’’
IEEE Trans. Veh. Technol., vol. 67, no. 6, pp. 5505–5509, Jun. 2018. [22] I. Gudkova, E. Markova, P. Masek, S. Andreev, J. Hosek, N. Yarkina,
K. Samouylov, and Y. Koucheryavy, ‘‘Modeling the utilization of a multi-tenant band in 3GPP LTE system with licensed shared access,’’ inProc. 8th Int. Congr. Ultra Mod. Telecommun. Control Syst. Workshops, Oct. 2016, pp. 119–123.
[23] P. Masek, E. Mokrov, A. Pyattaev, K. Zeman, A. Ponomarenko-Timofeev, A. Samuylov, E. Sopin, J. Hosek, I. A. Gudkova, S. Andreev, V. Novotny, Y. Koucheryavy, and K. Samouylov, ‘‘Experimental evaluation of dynamic licensed shared access operation in live 3GPP LTE system,’’ inProc. IEEE Global Commun. Conf., Dec. 2016, pp. 1–6.
[24] M. Matinmikko, M. Palola, M. Mustonen, T. Rautio, M. Heikkilä, T. Kippola, S. Yrjölä, V. Hartikainen, L. Tudose, A. Kivinen, H. Kokkinen, and M. Mäkeläinen, ‘‘Field trial of licensed shared access (LSA) with enhanced LTE resource optimization and incumbent protection,’’ inProc. IEEE Int. Symp. Dyn. Spectr. Access Netw., Sep./Oct. 2015, pp. 263–264. [25] M. Palolo, T. Rautio, M. Matinmikko, J. Prokkola, M. Mustonen,
M. Heikkilä, T. Kippola, S. Yrjölä, V. Hartikainen, L. Tudose, A. Kivinen, J. Paavola, J. Okkonen, M. Mäkeläinen, T. Hänninen, and H. Kokkinen, ‘‘Licensed shared access (LSA) trial demonstration using real LTE net-work,’’ inProc. 9th Int. Conf. Cogn. Radio Oriented Wireless Netw. Com-mun., Jun. 2014, pp. 498–502.
[26] I. Gudkova, K. Samouylov, D. Ostrikova, E. Mokrov, A. Ponomarenko-Timofeev, S. Andreev, and Y. Koucheryavy, ‘‘Service failure and interruption probability analysis for Licensed Shared Access regulatory framework,’’ inProc. 7th Int. Congr. Ultra Mod. Telecommun. Control Syst. Workshops, Oct. 2015, pp. 123–131.
[27] I. Gudkova, A. Korotysheva, A. Zeifman, G. Shilova, V. Korolev, S. Shorgin, and R. Razumchik, ‘‘Modeling and analyzing licensed shared access operation for 5G network as an inhomogeneous queue with catas-trophes,’’ inProc. 8th Int. Congr. Ultra Mod. Telecommun. Control Syst. Workshops (ICUMT), Oct. 2016, pp. 282–287.
[28] E. Markova, I. Gudkova, A. Ometov, I. Dzantiev, S. Andreev, Y. Koucheryavy, and K. Samouylov, ‘‘Flexible spectrum management in a smart city within licensed shared access framework,’’IEEE Access, vol. 5, pp. 22252–22261, 2017.
[29] K. Laehetkangas, H. Saarnisaari, and A. Hulkkonen, ‘‘Licensed shared access system development for public safety,’’ inProc. 22th Eur. Wireless Conf., May 2016, pp. 1–6.
[30] E. Pérez, K. Friederichs, I. Viering, and J. D. Naranjo, ‘‘Optimization of authorised/licensed shared access resources,’’ inProc. 9th Int. Conf. Cogn. Radio Oriented Wireless Netw. Commun., Jun. 2014, pp. 241–246. [31] N. Taramas, G. C. Alexandropoulos, and C. B. Papadias, ‘‘Opportunistic
beamforming for secondary users in licensed shared access networks,’’ inProc. 6th Int. Symp. Commun., Control Signal Process. (ISCCSP), May 2014, pp. 526–529.
[32] E. Bedeer, O. A. Dobre, M. H. Ahmed, and K. E. Baddour, ‘‘A multiob-jective optimization approach for optimal link adaptation of ofdm-based cognitive radio systems with imperfect spectrum sensing,’’IEEE Trans. Wireless Commun., vol. 13, no. 4, pp. 2339–2351, Apr. 2014.
[33] M. S. Omar, S. A. Hassan, H. Pervaiz, Q. Ni, L. Musavian, S. Mumtaz, and O. A. Dobre, ‘‘Multiobjective optimization in 5G hybrid networks,’’IEEE Internet Things J., vol. 5, no. 3, pp. 1588–1597, Jun. 2018.
[34] M. Haenggi,Stochastic Geometry for Wireless Networks, 1st ed. New York, NY, USA: Cambridge Univ. Press, 2012.
[35] A. Al-Hourani, S. Kandeepan, and S. Lardner, ‘‘Optimal LAP altitude for maximum coverage,’’IEEE Wireless Commun. Lett., vol. 3, no. 6, pp. 569–572, Dec. 2014.
[36] E. S. Sousa and J. A. Silvester, ‘‘Optimum transmission ranges in a direct-sequence spread-spectrum multihop packet radio network,’’IEEE J. Sel. Areas Commun., vol. 8, no. 5, pp. 762–771, Jun. 1990.
[37] A. Ghasemi and E. S. Sousa, ‘‘Interference aggregation in spectrum-sensing cognitive wireless networks,’’IEEE J. Sel. Topics Signal Process., vol. 2, no. 1, pp. 41–56, Feb. 2008.
[38] C. Bettstetter, G. Resta, and P. Santi, ‘‘The node distribution of the random waypoint mobility model for wireless ad hoc networks,’’IEEE Trans. Mobile Comput., vol. 2, no. 3, pp. 257–269, Jul. 2003.
[39] C. Bettstetter, H. Hartenstein, and X. Pérez-Costa, ‘‘Stochastic properties of the random waypoint mobility model: Epoch length, direction distribu-tion, and cell change rate,’’ inProc. 5th ACM Int. Workshop Modeling Anal. Simulation Wireless Mobile Syst., 2002, pp. 7–14.
[40] Z. Song, Q. Ni, K. Navaie, S. Hou, S. Wu, and X. Sun, ‘‘On the spectral-energy efficiency and rate fairness tradeoff in relay-aided coop-erative OFDMA systems,’’IEEE Trans. Wireless Commun., vol. 15, no. 9, pp. 6342–6355, Sep. 2016.
[41] R. T. Marler and J. S. Arora, ‘‘Survey of multi-objective optimization methods for engineering,’’Struct. Multidisciplinary Optim., vol. 26, no. 6, pp. 369–395, Apr. 2004.
[42] S. Schaible, ‘‘Minimization of ratios,’’J. Optim. Theory Appl., vol. 19, no. 2, pp. 347–352, Jun. 1976.
[43] I. M. Stancu-Minasian,Fractional Programming: Theory, Methods and Applications. Norwell, MA, USA: Kluwer, 1997.
[44] A. Zappone and E. Jorswieck, ‘‘Energy efficiency in wireless networks via fractional programming theory,’’Found. Trends Commun. Inf. Theory, vol. 11, nos. 3–4, pp. 185–396, 2015.
[45] Reconfigurable Radio Systems (RRS); Evolved Licensed Shared Access (eLSA); Part 1: System Requirements, dovument TS 103 652-1–V1.1.1, ETSI, ETSI, 2019.
[46] Reconfigurable Radio Systems (RRS); Feasibility Study on Temporary Spectrum Access for Local High-Quality Wireless Networks,dovument TR 103 588 V1.1.1, 2018.
[47] B. Makki, T. Svensson, and M. Zorzi, ‘‘Finite block-length analysis of spectrum sharing networks using rate adaptation,’’IEEE Trans. Commun., vol. 63, no. 8, pp. 2823–2835, Aug. 2015.
SAMUEL O. ONIDARE received the B.Tech. degree in electronic and electrical engineering from the Ladoke Akintola University of Technol-ogy, Ogbomoso, Oyo State, Nigeria, in 2000, and the M.Sc. degree in electrical engineering, with the emphasis on telecommunication, from Blekinge Teckniska Hogskola, Karlskrona, Blekinge, Swe-den, in 2010. He is currently pursuing the Ph.D. degree in communication with the School of Com-puting and Communication System, Lancaster University, U.K.
His research interests include mobile wireless communication and net-works, with an emphasis on spectrum sharing, green communications, and wireless resource allocation and optimization.
KEIVAN NAVAIEis currently with the School of Computing and Communications, Lancaster Uni-versity, U.K. His research interests include pro-visioning dependable connectivity and position-ing to intelligent cyber-physical systems. He is a Fellow of the IET, a Senior Fellow of the HEA, and a Chartered Engineer in the U.K. He currently serves on the Editorial Board of the IEEE TRANSACTIONS ONWIRELESSCOMMUNICATIONS,
the IEEE COMMUNICATIONSLETTERS, and the IEEE COMMUNICATIONSSURVEYS ANDTUTORIAL.