© 2016, IRJET ISO 9001:2008 Certified Journal
Page 743
FEASIBILITY STUDY ON CARBON SEQUESTRATION USING ALGAE
A.Mohamed Abubakar Sithik Ali
1, S.Vignesh
2, B.Boomapriya
3,D.Prasanya
41234
Assistant Professor, Civil, Srividya College of Engineering and Technology,Virudhunagar,Tamilnadu,India
---***---Abstract -
The increase in the atmospheric CO2 has lead to severe impacts on the global climate change, which has made carbon sequestration the need of the hour. Among the different carbon sequestration techniques photosynthetic algal sequestration has gained importance due to the fact that the algal biomass formed as a product of carbon sequestration is very useful in many ways like generation of Bio-fuel , bio-ethanol, methane , hydrogen , power, nutrient food supplements and so on. But the cost of the project becomes very high. Therefore the optimum design of photo-bioreactors with optimum environmental conditions like light intensity, pH, Temperature, nutrients, concentration is to be found out for practical implementation. In this project these varying conditions are tested for the Carbon utilization rate and the optimum conditions are to be determined for a particular algae species called Chlorella vulgaris by setting up a lab scale photo-bioreactor and artificial supply of CO2 is given. The maximum carbon fixation rate and the effectiveness of Carbon Capture for the particular species are to be studied in this project.Key Words: climate change, photosynthetic algal sequestration, photo-bioreactors, Chlorella vulgaris, carbon fixation rate .
1.INTRODUCTION
The most commonly considered indicator of
climate change and global warming is the surface air
temperature. Atmospheric CO
2and other greenhouse
gases are primarily the result of combustion of fossil
fuels. Atmospheric CO
2had been balanced through
various cyclic phenomena of the decreasing effect by
photosynthetic fixation by plants and dissolving in
the seawater and of the increasing effect due to
releasing from decaying plants and the seawater. Due
to the anthropogenic emissions, greenhouse gases in
the atmosphere have been steadily increasing
thereby causing great anxiety in global warming. The
growing evidence that links carbon dioxide (CO
2) and
global climate change highlights the need to develop
cost effective carbon sequestration schemes. The
main challenge of CO
2capture and storage is the high
cost of using current state-of-the-art technologies.
Various technologies have been used to
mitigate the fossil fuel-fired power plant stack
emissions including the (1) physical-chemical
processes, such as wet or dry absorption and
membrane separation techniques and (2) biological
methods,
in
particular
using
microalgal
photosynthesis. Chlorophyll in photosynthetic algae
captures light energy, which is used to convert
simple molecules (CO
2and H
2O) into carbohydrates
(sugars and starches) with the release of O
2.
Microalgae are of particular interest because of their
rapid growth rates, tolerance to varying
environmental conditions and can also fix greater
amounts of CO
2per land area than higher plants.
Capture and utilization of the carbon dioxide and
other flue gases by microalgae has emerged as a
promising technology to help reduce emissions from
fossil fuel-fired powered plants. The carbon fixed by
microalgae is incorporated into carbohydrates, lipids
and proteins, so energy, chemicals or foods can be
produced from algal biomass. The energy rich
biomass is widely used as a source fuel (liquid and
gaseous), health foods, animal feed and also in
producing vitamins and pigments. Processes in
conversion of algal biomass to such useful products
would indirectly decrease dependence on fossil fuels.
2. MATERIALS AND METHODS
2.1
CULTURING ALGAE
5 ml of Chlorella vulgaris mother culture is suspended in 100 ml Bold’s Basal medium in 250 ml flasks and kept in open air shaker at 100 rpm under 6 fluorescent lamps of light intensity 7000 Lux at Temperature of 260 C for 15 days and then Centrifuged at
250 C at 5000 rpm for 6 min .Then the required algae is
loaded in photo-bioreactor.
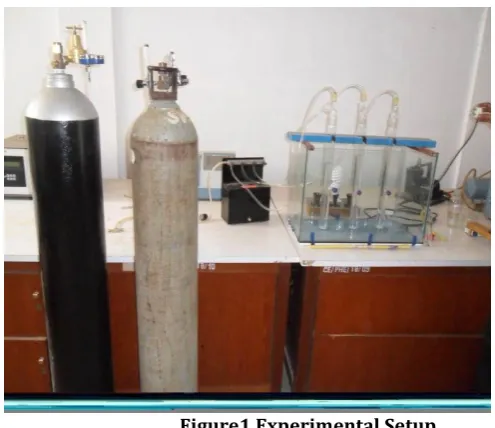
2.2 EXPERIMENTAL SETUP
The lab scale photo-bioreactor consists of three cylindrical glass reactors of size 40 mm diameter and 500 mm height in which the alga is grown in the Bolds’ Basal Medium with a free board of 10 cms. The three reactors are properly hold over a rectangular glass container of size 60 mm x 30 mm x 40 mm. CO2 and Air stored in cylinders
© 2016, IRJET ISO 9001:2008 Certified Journal
Page 744
and the required CO2 –air ratio is maintained .The CO2 andAir is mixed and collected using a Y-Joint and taken to the distributor where the CO2 – Air mixture is distributed to
three reactors. There is an air exit through which uncaptured gas escapes out. The alga is supplied with external light source containing 1 number of 45 watts Compact Fluorescent Lamp. The overall experimental setup is shown in Figure 3.1.
Figure1.Experimental Setup
2.3 EXPERIMENTAL PROCEDURE
The cultured alga is transferred into the suspension medium in the rectangular tank. CO2 and air mixture is
supplied using sparger. In the presence of external light source, the growth of algae is found out for a period of 3 days for varying conditions of CO2 concentration, CO2 flow
rate, light intensity, pH, temperature, nutrient concentration. The carbon utilization rate and carbon fixation efficiency is calculated for each case.
2.4
.
EXPERIMENTAL STUDY
A known volume of algae with initial known concentration (X0) of the starter culture is inoculated into the three reactors separately and several trials with varying conditions of CO2 percentage, CO2 flow rate, light
intensity, and pH are done. In each trial the absorbance values for 730 nm and 750 nm are found using UV-Visible spectrophotometer. pH was measured using pH meter. Monitoring of pH was necessary to keep the culture in good condition. pH was measured 2 times a day and was maintained by the addition of 0.01 M NaOH was added. Light intensity was measured using Lux meter. The sensor was inserted into the outer surface of reactor holding algal suspension deep below and the reading is taken twice a day.
The cell growth is studied in all trials and the final concentration after 3 days is found from which CO2
fixation rate and CO2 capture efficiency is calculated.
2.5.Algal concentration determination
Known volumes of microalgal samples were filtered through membrane filters using vacuum suction whose initial weight is already known. Filters are dried in hot air oven at 105-1100 C for 24 hrs then cooled to room
temperature to get final weight.
Biomass (mg) = Final Weight –initial weight Algae concentration (mg/l) = (Biomass/volume)*1000
2.6 Calibration between Optical Density and
concentration of Algae
Four samples whose dry mass concentration is already known are taken. Absorbance values in Spectrophotometer are measured for wavelength of 438,678,730,750 nm. A graph is plotted and the value of k=concentration / Absorbance is found out and also the average values of concentration/Absorbance for all samples.
3.EXPERIMENTAL OBSERVATIONS
3.1 DETERMINATION OF ALGAL CONCENTRATION
Table 1. Determination of Algal Concentration S.No Initial
Wt (g) Weight Final (g)
Net Weight
(g)
Algal Concentration
(mg/L)
1 52.0900 52.0968 0.0085 170
2 56.6512 56.6613 0.0101 202
3 40.8610 40.8734 0.0124 248
4 51.4208 51.4280 0.0072 144
[image:2.595.34.282.213.427.2]3.2 CALIBRATION BETWEEN OPTICAL DENSITY AND CONCENTRATION OF ALGAE
Table 2. Calibration between Optical Density and concentration of Algae
Sam
ples Concentration (mg/L)
Abs at 438
nm
Abs at 678
nm
Abs at 730
nm
Abs at 750
nm 1 170 0.9039 0.6802 0.6101 0.5936
2 202 0.9169 0.6795 0.6044 0.5864
3 248 1.1428 0.8040 0.7055 0.6870
4 144 0.8596 0.6426 0.5789 0.5723
Avera ge k=Co nc/Ab
s
198.25 269.75 303.44 310.5
Algal Cell Concentration (mg/L)
© 2016, IRJET ISO 9001:2008 Certified Journal
Page 745
=303.5 X Absorbance for Wavelength of 730 nm.3.3 VARIATION OF INFLUENCING PARAMETERS
The various influencing parameters are varied as shown in TableTable 3 . Values of influencing parameters in each study
TRIALS CO2 %
PH Light Intensity in Lux Rr 1 Rr 2 Rr3 Rr1 Rr2 Rr3 TRIAL 1 20 7.5 8.5 9.5 1000 1500 1000
TRIAL 2 11 7 8 9 2500 3500 2500
TRIAL 3 20 7 8 9 3000 4500 3000
TRIAL 4 15 7 8 9 2500 3500 2500
TRIAL 5 25 7 8 9 3500 4500 3500
TRIAL 6 15 7 8 9 3500 5000 3500
Experimental study 1
Table 4.Algal Growth for study 1
Reactor 1 Reactor 2 Reactor 3 Time
pH mg/L Conc pH mg/L Conc pH mg/L Conc
Day 1 9.5 39.86 8.5 39.96 7.5 40.148
Day 2 8.15 42.85 7.7 50.301 7.07 41.34
Day 3 6.23 46.575 6.15 52.785 6.04 43.47
Day 4 5.85 51.23 5.80 57.75 5.79 45.954
Day 5 5.82 52.785 5.79 62.1 5.79 50.301
In trial 1 it is seen that the growth is linear upto a particular period of time and after that it is stationary. This is due to the fact that the Ph gradually reduced to around 5 which is acidic in nature, which hinders the growth of the algae.
Therefore maintaining the pH in the alkaline region is the must for maximum growth and therefore for maximum CO2 capture.
[image:3.595.301.568.609.768.2]Experimental study 2
Table 5. Algal growth for study-2 Reactor 1
(pH= 7) Reactor 2 (pH= 8) Reactor 3 (pH= 9)
DAYS Conce
ntratio n (mg/l)
light inte nsity (lux)
Conce ntratio n mg/l
light inte nsity (lux)
Conce ntrati on mg/l
light inten sity (lux) DAY 1 40.63 2500 39.50 3000 37.66 2500 DAY 2 55.15 2530 52.90 3220 50.38 2530 DAY 3 65.33 2750 63.93 3750 65.10 2630 DAY 4 111.71 2600 111.26 3150 104.6 2600
DAY 5 125.32 2530 135.3 3500 128.6 2520 DAY 6 168.75 2570 195.7 3330 171.0 2600 DAY 7 196.31 2580 204.3 3510 211.0 2600
In study 2 constant pH is maintained around 7, 8, and 9 in the reactors 1, 2 and 3 respectively The reactor with the highest light intensity showed the maximum CO2 capture
rate.. Therefore maintaining a pH of 9 and light intensity of 3500 is considered to be optimum.
Experimental study 3
Table 6. Algal growth for study-3 Reactor 1
(pH= 7) Reactor 2 (pH= 8) Reactor 3 (pH= 9)
DAYS Conce
ntrati on (mg/
L) light
inte nsity (lux)
Conce ntrati on (mg/
L ) light
inte nsity (lux)
Conce ntratio
n (mg/L)
light inten sity (lux) DAY 1 57.26 3200 41.48 4480 97.96 3100 DAY 2 54.23 3210 75.34 4480 88.75 3120 DAY 3 54.95 2900 67.96 4200 76.61 2920
In trial 3 due to some contaminations the growth is seen to be fluctuating and a steady increase in the growth could not be found out. So no inference can be taken from this trial.
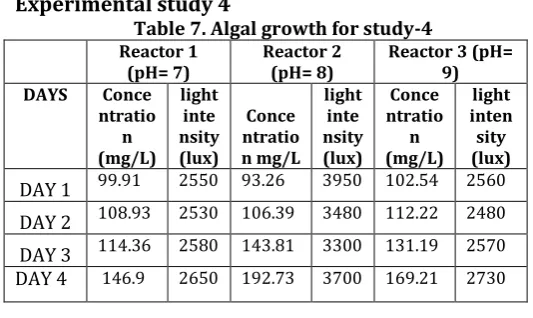
Experimental study 4
Table 7. Algal growth for study-4 Reactor 1
(pH= 7) Reactor 2 (pH= 8) Reactor 3 (pH= 9)
DAYS Conce
ntratio n (mg/L)
light inte nsity (lux)
Conce ntratio n mg/L
light inte nsity (lux)
Conce ntratio
n (mg/L)
© 2016, IRJET ISO 9001:2008 Certified Journal
Page 746
In Trial 4, the CO2 utilization rate of 29, 60, 40mg/l/day respectively in the three reactors is achieved for the first three days itself. The middle reactor with light intensity of 3500 lux and pH of 8 with a CO2 % of 15% is
higher than that of the trial 2 with CO2 % of 10% .
Therefore a CO2 concentration of 15% is advisable than
10%.
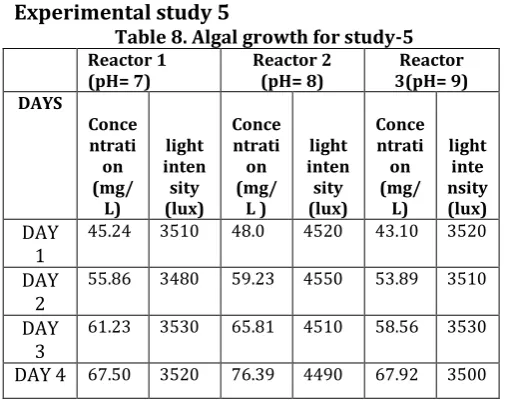
Experimental study 5
Table 8. Algal growth for study-5 Reactor 1
(pH= 7) Reactor 2 (pH= 8) 3(pH= 9) Reactor
DAYS
Conce ntrati on (mg/
L) light inten sity (lux)
Conce ntrati on (mg/
L ) light inten sity (lux)
Conce ntrati on (mg/
L) light
inte nsity (lux) DAY
1
45.24 3510 48.0 4520 43.10 3520
DAY 2
55.86 3480 59.23 4550 53.89 3510
DAY 3
61.23 3530 65.81 4510 58.56 3530
DAY 4 67.50 3520 76.39 4490 67.92 3500
In trial 5 even though the light intensity is increased, Since the CO2 % is increased to 25% maximum
growth is not achieved. So CO2 % greater than 15% is not
suitable for maximum growth. But still growth can be seen.
[image:4.595.29.284.192.394.2]Experimental study 6
Table 9. Algal growth for study-6 Reactor 1
(pH= 7) Reactor 2 (pH= 8) Reactor 3 (pH= 9)
DAYS Conce
ntratio n (mg/L)
light inte nsity (lux)
Conce ntratio
n( mg/L)
light inte nsity (lux)
Conce ntratio
n (mg/L)
light inten sity (lux) DAY
1
60.62 3500 73.01 5400 65.31 3500
DAY 2
130.60 3500 96.35 5150 88.41 3550
DAY 3
141.20 3420 141.64 6200 87.40 3520
DAY 4 184.56 3500 187.23 5400 114.27 3510
In study 6 , unexpectedly , the first reactor with pH =7 gave maximum growth. This may be due to the fact that thorough mixing was taking place in the first reactor .So complete suspension of algae is far more important because more contact area for algae is achieved. This parameter is more influencing than other parameters.
4 RESULTS AND DISCUSSIONS
The CO2 fixation rate and CO2 fixation efficiency are
calculated in each trial. The following results were obtained as shown in Table 10.
Table 10. Results in each study TRIA
LS CO(mg/L/Day) 2 Fixation Rate CO2 Fixation Efficiency in % Reacto
r 1 Reactor 2 Reactor 3 Reactor 1 Reactor 2 Reactor 3
1 5.91 10.15 4.65 0.005 0.008 0.004
2 50 57 51 0.04 0.048 0.043
3 Observations are inappropriate
4 29 60 40 0.0246 0.052 0.0346
5 13.6 17.35 15.17 0.0115 0.0147 0.013
6 75.74 69.801 29.92 0.129 0.119 0.05
It can be seen that in all the studies the centre reactor results shows maximum CO2 utilization. So we can
say that upto 4500 Lux photo inhibition did not take place so increase in the light intensity has promoted the algal growth. It can be seen that without maintaining constant pH, the medium changes to acidic therefore growth is slown down. Therefore maintaining constant pH is essential. Maintaining a pH of 9 is better than pH=7 in all the trials. Maximum CO2 utilization is seen in 15% CO2
supply. When the total flow rate is reduced proper mixing did not take place and the alga starts to settle down. So maximum growth did not take place. Therefore proper mixing or gas transfer is required for good algal growth. Without considering the last trial ,the maximum growth is obtained in trial 4 under the conditions of CO2 % =15%,
pH = 8, Light intensity of 3500 Lux and CO2 flow rate of
0.0167 l/min and is found to be 60 mg/L/Day. But due to some unknown reasons in the final trial maximum growth was obtained in pH = 7, with CO2 flow rate of 0.025l/min,
CO2 % =15 and light intensity of 3500 lux. . Since this
value is very much less due to various reasons like very less Gas Transfer, little mixing ,etc , it needs further thorough study considering more time interval for growth.
5 CONCLUSION
From our study we can understand that
Maintaining a constant pH within the range of 8 to 9 is best suitable for the algal growth.
As the light intensity increases the growth rate also increases upto the maximum light intensity of our study 5000 lux. Since we have not tested with higher light intensities, the photo inhibition range of light is not found out.
Maximum CO2 capture is obtained when the CO2 % is
about 15% and 10% also comparatively gave good results .Therefore we can say that CO2 % within the
range 10- 15% is optimum. Since the flue gas from the industries contains CO2 % of range 10 to 15%, this
© 2016, IRJET ISO 9001:2008 Certified Journal
Page 747
applicable. But the growth of algae in the presence ofSOx, NOx has to be further studied.
As the CO2 flow rate is reduced the capture efficiency
increased almost five times. This is due to the fact that the retention time of CO2 gas gets increased as the
flow rate is decreased. Therefore increasing the retention time of CO2 plays a very major role in the
algal carbon sequestration technology. Further improved techniques or design is suggested for increasing the retention time of CO2.
In all the trials it is seen that thorough mixing of the algal cells in the media enhances the growth rate. This important influencing parameter overcomes rest all parameters as it is seen in trial 6. Therefore thorough mixing of the algal suspension is the key parameter in microalgal carbon sequestration.
Another important parameter yet to be analyzed is the presence of predators like bacteria, fungi, etc. It is clearly seen in trial 3 that the growth rate is greatly affected due to the presence of contamination. Therefore, for field applications, the photobioreactor free from any contamination is suggested.
REFERENCES
[1] Chinnasamy S, Ramakrishnan B, Bhatnagar A, Das KC (2009). Biomass production potential of a waste water alga Chlorella vulgaris ARC 1under elevated levels of CO2
and temperature. Int. J. Mol. Sci., 10: 518-532.
[2] Karube I, Takeuchi T, Barnes DJ (1992).
Biotechnolgical reduction of CO2 emissions. Adv. Biochem.
Eng. /Biotech., 46:63-79.
[3] Sawayama SS, Inoue YD, Dote, Yokoyama SY (1995). CO2 fixation and oil production through microalga. Ener.
Convers. Manage., 36: 729-731.
[4] Sung KD, Lee JS, Shin CS, Park SC, Choi MJ (1999). CO2
fixation by Chlorella sp. KR-1 and its cultural characteristics. Biore. Tech., 68: 269-273.
[5] Zeiler KG, Heacox DA, Toon ST, Kadam KL, Brown LM (1995). The Use of Microalgae for Assimilation and Utilization of Carbon Dioxide from Fossil Fuel-Fired Power Plant Fuel Gas. Energ. Convers. Manage., 36: 707–712.
[6] Hanagata, N., T. Takeuchi, Y. Fukuju, D.J. Barnes and I. Karube. 1992. Tolerance of microalgae to high CO2 and