N A N O E X P R E S S
Open Access
Changes in the nanoparticle aggregation rate
due to the additional effect of electrostatic and
magnetic forces on mass transport coefficients
Dana Rosick´a
*and Jan ˇSembera
Abstract
The need may arise to be able to simulate the migration of groundwater nanoparticles through the ground.
Transportation velocities of nanoparticles are different from that of water and depend on many processes that occur during migration. Unstable nanoparticles, such as zero-valent iron nanoparticles, are especially slowed down by aggregation between them. The aggregation occurs when attracting forces outweigh repulsive forces between the particles. In the case of iron nanoparticles that are used for remediation, magnetic forces between particles contribute to attractive forces and nanoparticles aggregate rapidly. This paper describes the addition of attractive magnetic forces and repulsive electrostatic forces between particles (by ‘particle’, we mean both single nanoparticles and created aggregates) into a basic model of aggregation which is commonly used. This model is created on the basis of the flow of particles in the proximity of observed particles that gives the rate of aggregation of the observed particle. By using a limit distance that has been described in our previous work, the flow of particles around one particle is observed in larger spacing between the particles. Attractive magnetic forces between particles draw the particles into closer proximity and result in aggregation. This model fits more closely with rapid aggregation which occurs between magnetic nanoparticles.
Keywords: Magnetic nanoparticles, Aggregation, Mass transport coefficient, Limit distance
Background
There are a lot of types of nanoparticles and colloidal particles in groundwater [1]. Some of them are formed naturally, others are generated synthetically and put into the ground by humans. Not only is the reactivity of particles important, but also their migration properties are examined. For example, natural bentonite colloids are released as a consequence of bentonite disposal of radioactive wastes and could carry adsorbed radionuclides in groundwater through granite [2,3]. Zero-valent iron nanoparticles are produced [4-6] and injected into the ground. Iron nanoparticles are able to migrate in ground-water through contaminated areas and remediate the pol-luted soils and water [7]. In the first case, the migration possibility is unwelcome. In the second case, the bet-ter the migration, the more effective of the remediation.
*Correspondence: [email protected]
Technical University of Liberec, Institute of Novel Technologies and Applied Informatics, Liberec 460 01, Czech Republic
That is why a simulation of the migration of nanopar-ticles might be desirable. To simulate the migration of nanoparticles, the coefficient of transport retardation of the nanoparticles is needed. The coefficient represents the possible reduction in the rate of nanoparticle migration compared with nanoparticles with similar properties. The number of nanoparticles with similar properties changes over time due to aggregation and it influences the results of the migration experiments. A dynamic model of aggre-gation has to be included in the simulation programme of nanoparticle transport in flowing water. That is why mass transport coefficients are needed. The coefficients represent the frequency of nanoparticle collisions [8,9].
A commonly used model for mass transport coefficients [10,11] in describing aggregation is based on the colli-sions among nanoparticles caused by heat fluctuation, the velocity gradient of the water in which the nanoparticles are suspended and the different velocities of sedimenta-tion of nanoparticles of varying size. This model does not include the decrease in the rate of aggregation due
to repulsive electrostatic forces which occurs due to the electric double layer which builds up on nanoparticle sur-faces [12]. Further, in the case of magnetic nanoparticles, the aggregation rate is rapidly increased due to the attrac-tive magnetic forces between nanoparticles [4,13-16]. That is the reason why the model of aggregation has been expanded, enabling a more accurate model of aggrega-tion of iron nanoparticles in water to be achieved. The paper describes the extension of the mass transport coef-ficients by the attractive magnetic forces and repulsive electrostatic forces between the nanoparticles.
Methods
A model of nanoparticle aggregation
Particles aggregate easily in groundwater. They create clumps of particles up to the size of several microme-tres [15] that cohere and reduce the ability of particles to migrate through the pores on the ground. The aggrega-tion of the particles is caused by processes that generally occur during particle migration. The reduction in mobil-ity can be formulated by a rate of aggregation given by mass transport coefficientsβ (m3s−1) [9,10]. The coeffi-cients give a probabilityPij for the creation of an aggre-gate from particle i and particle j with concentrations ni, nj of particles i, j, respectively (Equation 1). Parti-cle i means the aggregate is created fromi elementary nanoparticles.
Pij=βijninj, (1)
βij=βij1+βij2+βij3. (2)
The coefficient (Equation 2) is given by the sum of mass transport coefficients of Brownian diffusionβij1, velocity gradientβij2and sedimentationβij3. The concept is adopted from [10].
In the case of small nanoparticles, temperature fluctua-tion of particles has a significant effect on particle aggrega-tion [17]. Brownian diffusion causes a random movement of the particles and it facilitates aggregation. The mass transport coefficient for the Brownian diffusion [10] is
βij1= 2kBT
3η
(di+dj)2 didj
, (3)
where kB stands for Boltzmann constant,T denotes the absolute temperature, η is the viscosity of the medium, anddiis the diameter of the particlei.
Another process causing aggregation is the drifting of nanoparticles in water. Water flowing through a pore of soil has a velocity profile. In the middle of the pore, the velocity of water is highest. Since the particles have differ-ent velocities, according to their location in the flow, the particles can move close together and create an aggregate.
The mass transport coefficient for the velocity gradients of particles [10] is
βij2= 1
6G(di+dj)
3, (4)
whereGis the average velocity gradient in a pore. Particles settle due to gravitational forces. The veloc-ity of the sedimentation varies for different aggregates depending on their size, so particles can move closer together and aggregate. The mass transport coefficient for the sedimentation [10] is
βij3= πg
72η (p−) (di+dj)
2|d2
i −d2j|, (5)
wheregis the acceleration due to gravity,is the density of the medium, andp is the density of the aggregating particles.
The magnetic properties of nanoparticles
Because of the composition of nanoparticles, every nanoparticle has a non-zero vector of magnetization. According to [15], TODA iron nanoparticles produced by the Japanese company Toda Kogyo Corp. (Hiroshima, Japan) [5], with diameter of 40 nm have saturation mag-netization 570 kA/m. This is the value for a substance composed of nanoparticles containing 14.3% of Fe0and 85.7% of Fe3O4. We use these data for our model. There-fore, we assume the same size magnetization vector for all nanoparticles.
Our model of a magnetic field around an iron nanopar-ticle is based on the model of the magnetic field around a magnet described in [18]. The electromagnetic potential in the pointr near a permanent magnet of volumeV is equal to
φ (r)=
V MR
R3 dV, (6)
whereMis the magnetization vector at the point dV, the vectorRis the difference between source of the magnetic field dVand the pointr,Ris the length ofR.
The intensity of the magnetic field H can be subse-quently computed as
H(r)= −grad(φ (r)). (7)
Finally, the magnetic force between the source of the intensity of magnetic fieldHand a permanent magnet of volumeV˜ with a magnetization vectorM0at the pointris equal to
F(r)= −
˜
V
(M0·grad)H(r)dV. (8)
nanoparticle with radiusalocated at the point(0, 0, 0)was derived as follows:
φ (r)=M 2π 0 π 0 a 0
(x3−rcos(θ ))r2sin(θ ) 3
(x21+x22+x23−r2)2
drdθdϕ, (9)
whereais the radius of the nanoparticle, and(x1,x2,x3) are the coordinates of the pointr. Here, the direction of the magnetization vectorMis set towardsx3, andMis the magnitude of the vectorM.
From Equations 7 and 8, the analytical computation of the magnetic force between two iron nanoparticles can be obtained. Since nanoparticles aggregate, the magnetic force between aggregates must be derived. One aggregate can be composed of millions of nanoparticles. It would be time-consuming and very difficult to analytically compute all these forces. As a consequence, the forces are com-puted numerically, either as a sum of the magnetic forces between every nanoparticle in one aggregate with every nanoparticle in the second aggregate
F= n2
j=1 ˜
V(M2j·grad)gradφ(˜ r2j), (10)
or as one magnetic force between two averaged aggregates [20].
F=. V2(M2A·grad)gradφ (R,M1A,√3n1a). (11)
whereV˜ = 43πa3 is the volume of a nanoparticle,r 2j is the location of the centre of thej-th nanoparticle in the second aggregate,M2j is the magnetization vector of the j-th nanoparticle in the second aggregate,M1AandM2A are the averaged magnetization vectors (Equation 12) of the first and the second aggregate respectively, andV2 =
3 √
n2ais the volume of the second aggregate.
The averaged aggregate is a big homogeneous particle with its direction of magnetization vectorsMA which is computed as a vector sum of the magnetization vectors of all nanoparticles in the aggregateMAand computed as an average of the sizes of all nanoparticles divided by the number of nanoparticles in the aggregaten.
MA=
n i=1Mi
n . (12)
The structure of aggregates
When particles aggregate due to magnetic forces, the rate of aggregation depends on the magnetization vectors of the aggregating particles and on the distance between the particles. The rate of aggregation changes with the chang-ing number of nanoparticles within the aggregates, that is, the changing scale of the structure by order. The model which has been chosen for the structure of an aggregate is a sphere with randomly located nanoparticles within
the aggregate, either with random directions of magne-tization vectors for every nanoparticle; or with the same direction of magnetization vectors for all nanoparticles in the aggregate. Aggregate structures were assessed in pre-vious work [21]. A more accurate assessment of the most probable structure of an aggregate was performed for this paper in section ‘The structure of an aggregate based on interaction energy’.
The electrostatic properties of nanoparticles
In an electrolyte, a surface charge builds up on the nanoparticle surface. The surface charge depends on its zeta potential (see e.g. [22]) which is measurable. The zeta potential strongly depends on the pH of the water. The results of this dependence were measured using the Malvern ZetaSizer (Malvern Instruments Inc, Malvern, Worcestershire, UK) as published in [19]. From the zeta potential, the surface potential can be computed, based on the electrical double layer [23,24]
σ = −
80rc RgTsinh F Zζ
2RT (13)
whereσ is the surface charge density of the particle,cis the molar electrolyte concentration, Rg is the molar gas constant,Fis Faraday’s constant,Zis the charge number andζ is the electrostatic potential. The electrostatic force between two particles is equal to
Fc= 1 40r
πd2id2jσiσj
D2 , (14)
where D is the distance between the particles i and j. The electrostatic forces repel nanoparticles with the same polarity and cause a reduction in the rate of aggregation. Inclusion of the dependence is done in section ‘The inclu-sion of the limit distance into mass transport coefficients’.
The limit distance
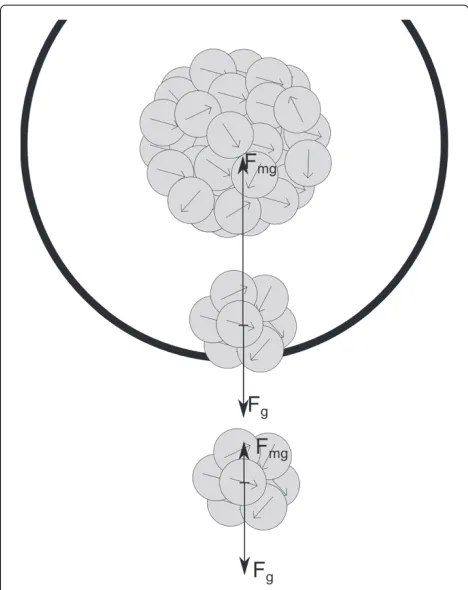
The effect of magnetic forces on the rate of aggregation was assessed by one parameter - the limit distanceLD. This dimension expresses the range of magnetic forces between particles. The definition of this parameter is as follows: this is the distance from centre of an aggregate up to which attractive magnetic forces cause the aggregation between the aggregate and a particle placed in this range. Hence, in a range larger than the limit distance, other forces outweigh the magnetic forces (Figure 1). The limit distanceLDcan be defined as the distance of the point in which gravitationFgand magnetic forcesFmgeffecting on the aggregate are equal
Figure 1Sketch of the limit distance.A comparison of the forces acting on aggregates depicted by a two-dimensional figure. Inside the circle with diameter equal to the limit distance, the magnetic forces outweigh the gravitational force and aggregation occurs. Outside this, the aggregates settle.
The limit distance takes the form
LD,0= 4
Fmg(R0) Fg
R0. (16)
The magnetic force between two single domain mag-netic nanoparticles falls by the power of 4. In the case of aggregates, the fall depends on the structure of the aggre-gates and iteration of limit distance computation is needed [20].
LD,1= 4
Fmg(LD,0) Fg
LD,0. (17)
When including electrostatic forces, we define the limit distance as the distance where the repulsive magnetic forces is equal to the sum of attractive forcesFmgandFC. As the effect of electrostatic forces falls by the power of 2,
electrostatic forces can be included into the equilibrium of force in the following way [20]
LD,0=
F2
C(R0)+4FgFmg(R0)−FC(R0) 2Fg
R0, (18)
LD,1=
F2
C(LD,0)+4FgFmg(LD,0)−FC(LD,0) 2Fg
LD,0.
(19)
The values of magnetization vector and surface charge were selected as follows: M = 570 kA/m; σ = 2.5× 10⁻⁵C/m2. We used these selected values for all the com-putations of the interaction energies and mass transport coefficients.
Simulation software
All the computations of magnetic forces, limit distance, electrostatic forces and mass transport coefficients were performed using Matlab R2009a software (MathWorks Inc, Natick, MA, USA). The computation was carried out for different sizes of aggregatesiandj, mostly varying in the order of the number of nanoparticles that the aggre-gates were composed of. The magnetic forces between two aggregates were computed either by summation of the magnetic force between every nanoparticle in the first aggregate and every nanoparticle in the second aggregate (when the ratio LD/R0 expresses distance between the aggregates was lower than 15 [20]), or by the averaging of the first and second aggregates. Values for the mag-netization vector and surface charge were selected in the following way:M=570 kA/m; σ =2.5×10⁻⁵C/m2. For the velocity gradient, we chose the dimensionless value 50. We used these selected values for all the computations of the interaction energies and mass transport coefficients.
Results and discussion
The structure of an aggregate based on interaction energy To assess the most probable structures of aggregates, one can compute an interaction energy E between the nanoparticles which make up the aggregate, according to [25]
E= −m·B. (20)
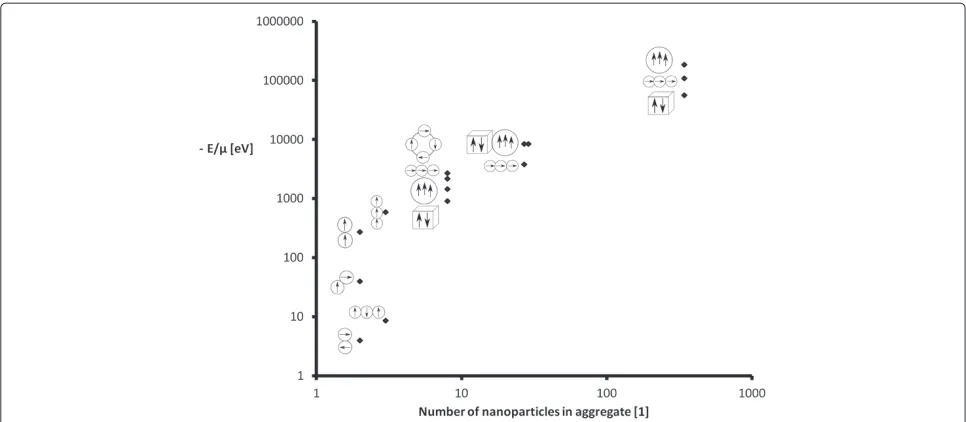
Figure 2The interaction energies of different structures of aggregates.A comparison of the interaction energies of different structures of aggregates expressing the rate of probability of the structures (the larger the negative energy, the bigger the probability of structure).
between every two nanoparticles in an aggregate, one can deduct the probability of stability of the different struc-tures of the aggregates (the higher the negative interaction energy, the higher the probability of the structure of the aggregate).
The results of interaction energies are shown in Figure 2. The computed interaction energies are displayed for dif-ferent structures of aggregates (according to the schemes: Figures 3, 4, 5, 6). The Figure 2 is shown using a log-arithmic scale. The exact values of interaction energies for different structures of aggregate (Figures 3, 4, 5, 6) and the different numbers of nanoparticles making up the aggregates are in Table 1. Not the absolute values but the comparison between the values of the different structures is relevant. According to Figure 2, the most probable structure of aggregates for the small aggregates are chains and for the bigger aggregates, spherical clusters with the same direction of magnetization vectors of the nanoparticles which make up the aggregate.
[image:5.595.61.295.631.695.2]In their research, Phenrat et al. [15], aggregates of nanoscale zero-valent iron particles were measured using
Figure 3Diagram of a chain structure.A diagram of the chain structure of nanoparticles within an aggregate with schematic directions of the magnetization vectors of the nanoparticles.
dynamic light scattering, optical microscopy and sed-imentation measurements. According to their results, firstly, the nanoparticles created clusters and subse-quently, these aggregates assemble themselves into fractal, chain-like clusters. We presume that it was because of the high concentration of nanoparticles that they used, and the very fast aggregation, first into chains and then into clusters, which lead to the measurement of only larger clusters in [15]. Our presumption that with larger num-bers of nanoparticles, spherical cluster is created which
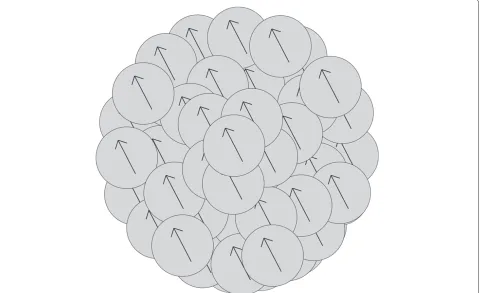
Figure 5Diagram of spherical structure.A diagram of a spherical structure of nanoparticles within an aggregate with schematic directions of the magnetization vectors of the nanoparticles.
leads to the supposition that at very high concentrations of particles, spherically structured aggregates only attach to each other, without changing their structure. This cor-responds to the observations of Phenrat et al. [15]: in high concentrations, first nanoparticles aggregate into clusters, then the created clusters aggregate into pairs or triplets, and finally into chain-like fractal aggregates.
The inclusion of the limit distance into mass transport coefficients
The basic model of aggregation as given in the section, ‘A model of nanoparticle aggregation’, indicates the rate of aggregation caused by the collision of particles (in prox-imity, attractive forces outweigh the repulsive ones). We established a limit distance in which attractive forces out-weigh the repulsive ones. The magnetic forces attract particles closer to each other and then they aggregate due to attractive van der Waals forces.
Mass transport coefficients (in Equations 3, 4, and 5) were derived on the basis of the flux of nanoparticles through an observed volume or circular area around a par-ticle. The area had a radius equal to sum of the radii of both particles. That means that the particles collide and aggregate. According to our supposition, the particles do not have to be in proximity to aggregate when attractive
magnetic forces are acting between them. Therefore, the mass transport coefficients are computed as flux through the spherical or circular area around a particle with a diameter equal to the limit distance:
βij1,mg= 4kBT
3η
1 di +
1 dj
LD,1, (21)
βij2,mg= 4
3G L 3
D,1, (22)
βij3,mg= πg
18η (p−)|d
2
i −d2j|L2D,1, (23)
whereβij1,mg, βij2,mg, andβij3,mg, stand for the mass trans-port coefficient of Brownian motion, the velocity gradient, and sedimentation respectively, with the inclusion of mag-netic forces between particles. The results of this change in mass transport coefficients are discussed in the next section - ‘A comparison of the rate of aggregation with and without the effect of electrostatic and magnetic forces’.
A comparison of the rate of aggregation with and without the effect of electrostatic and magnetic forces
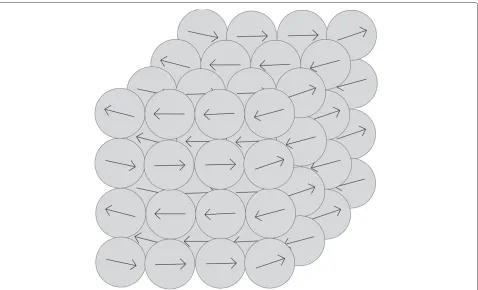
Figure 6Diagram of a cubic structure.A diagram of a cubic structure of nanoparticles within an aggregate with schematic directions of the magnetization vectors of the nanoparticles.
[image:7.595.307.540.522.656.2]because attractive magnetic forces attract the aggre-gates and the rate of aggregation is significantly higher (Figure 7). Table 2 contains a comparison of mass trans-port coefficients computed by primary model, mass transport coefficients computed in distanceLDincluding
Table 1 Interaction energies of different structures of aggregates
Number of nanoparticles [1] Structure Energy/μ(eV)
2 Chain 273
3 Chain 588
8 Cube 903
8 Sphere 1, 449
8 Circle 2, 184
8 Chain 2, 688
27 Chain 3, 780
27 Sphere 8, 400
29 Cube 8, 400
343 Cube 56, 700
343 Chain 109, 200
343 Sphere 184, 800
Computed interaction energies divided by the permittivity constant for different structures of aggregates (according to the diagrams in Figures 3, 4 ,5 ,6) and for different numbers of nanoparticles within the aggregates.
magnetic forces and mass transport coefficients computed in distanceLDincluding both magnetic and electrostatic forces. The computation of LD was performed by aver-aging the magnetic forces for particles with ratioLD/R0 higher than 15; otherwise, the computation of magnetic
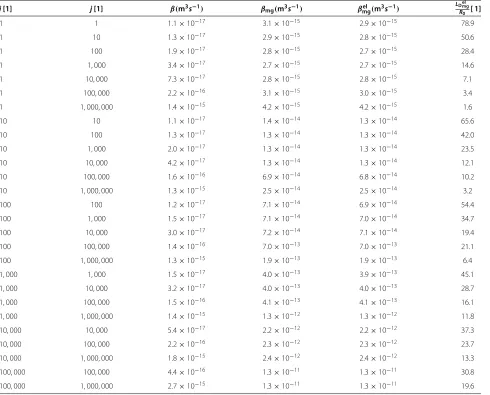
[image:7.595.57.292.523.706.2]Table 2 Comparison of mass transport coefficients
i[1] j[1] β(m3s−1) β
mg(m3s−1) βelmg(m3s−1)
LDelmg
R0 [ 1]
1 1 1.1×10⁻¹⁷ 3.1×10⁻¹⁵ 2.9×10⁻¹⁵ 78.9
1 10 1.3×10⁻¹⁷ 2.9×10⁻¹⁵ 2.8×10⁻¹⁵ 50.6
1 100 1.9×10⁻¹⁷ 2.8×10⁻¹⁵ 2.7×10⁻¹⁵ 28.4
1 1, 000 3.4×10⁻¹⁷ 2.7×10⁻¹⁵ 2.7×10⁻¹⁵ 14.6
1 10, 000 7.3×10⁻¹⁷ 2.8×10⁻¹⁵ 2.8×10⁻¹⁵ 7.1
1 100, 000 2.2×10⁻¹⁶ 3.1×10⁻¹⁵ 3.0×10⁻¹⁵ 3.4
1 1, 000, 000 1.4×10⁻¹⁵ 4.2×10⁻¹⁵ 4.2×10⁻¹⁵ 1.6
10 10 1.1×10⁻¹⁷ 1.4×10⁻¹⁴ 1.3×10⁻¹⁴ 65.6
10 100 1.3×10⁻¹⁷ 1.3×10⁻¹⁴ 1.3×10⁻¹⁴ 42.0
10 1, 000 2.0×10⁻¹⁷ 1.3×10⁻¹⁴ 1.3×10⁻¹⁴ 23.5
10 10, 000 4.2×10⁻¹⁷ 1.3×10⁻¹⁴ 1.3×10⁻¹⁴ 12.1
10 100, 000 1.6×10⁻¹⁶ 6.9×10⁻¹⁴ 6.8×10⁻¹⁴ 10.2
10 1, 000, 000 1.3×10⁻¹⁵ 2.5×10⁻¹⁴ 2.5×10⁻¹⁴ 3.2
100 100 1.2×10⁻¹⁷ 7.1×10⁻¹⁴ 6.9×10⁻¹⁴ 54.4
100 1, 000 1.5×10⁻¹⁷ 7.1×10⁻¹⁴ 7.0×10⁻¹⁴ 34.7
100 10, 000 3.0×10⁻¹⁷ 7.2×10⁻¹⁴ 7.1×10⁻¹⁴ 19.4
100 100, 000 1.4×10⁻¹⁶ 7.0×10⁻¹³ 7.0×10⁻¹³ 21.1
100 1, 000, 000 1.3×10⁻¹⁵ 1.9×10⁻¹³ 1.9×10⁻¹³ 6.4
1, 000 1, 000 1.5×10⁻¹⁷ 4.0×10⁻¹³ 3.9×10⁻¹³ 45.1
1, 000 10, 000 3.2×10⁻¹⁷ 4.0×10⁻¹³ 4.0×10⁻¹³ 28.7
1, 000 100, 000 1.5×10⁻¹⁶ 4.1×10⁻¹³ 4.1×10⁻¹³ 16.1
1, 000 1, 000, 000 1.4×10⁻¹⁵ 1.3×10⁻¹² 1.3×10⁻¹² 11.8
10, 000 10, 000 5.4×10⁻¹⁷ 2.2×10⁻¹² 2.2×10⁻¹² 37.3
10, 000 100, 000 2.2×10⁻¹⁶ 2.3×10⁻¹² 2.3×10⁻¹² 23.7
10, 000 1, 000, 000 1.8×10⁻¹⁵ 2.4×10⁻¹² 2.4×10⁻¹² 13.3
100, 000 100, 000 4.4×10⁻¹⁶ 1.3×10⁻¹¹ 1.3×10⁻¹¹ 30.8
100, 000 1, 000, 000 2.7×10⁻¹⁵ 1.3×10⁻¹¹ 1.3×10⁻¹¹ 19.6
A comparison of mass transport coefficients computed by the primary modelβ, mass transport coefficients computed in distanceLDincluding magnetic forcesβmg,
and mass transport coefficients computed in distanceLDincluding both magnetic forces and electrostatic forcesβelmg. Theβrepresents the sum of the mass transport
coefficients for Brownian motion, velocity gradient and sedimentation. Computation ofLDwas performed by averaging of the magnetic forces (11) for particles with ratioLD/R0higher than 15; otherwise, the computation of magnetic forces was performed accurately by summation (10) (for more information, see [20]). Results were computed using the following values:M=570kA/m;σ=2.5×10−5C/m2
;andG=50.
forces was done accurately by summation (for more infor-mation see [20]). The values in Table 2 are computed with valuesM = 570 kA/m; σ = 2.5·10−5 C/m2; G = 50. According to the results in Table 2 for the chosen values of variables, the attractive magnetic forces between iron nanoparticles have a large effect on the rate of aggrega-tion. The mass transport coefficients are much higher and the aggregation probability increases, which corresponds to our expectations.
Discussion
In future work, the system of grouping of particles accord-ing to their size will be derived for the new extended mass transport coefficients including electrostatic and
magnetic forces. The groups will represent particles with similar transport properties (small particles are easily transportable, large particles remain in the pores in the ground) and a model of aggregation over time will be developed. The model will be compared with the mea-suring of aggregation of zero-valent iron nanoparticles in time.
Subsequently, the limit distance should be derived for the equilibrium of all forces acting on particles depending on specific conditions.
Conclusions
of interaction between nanoparticles described by the probability of collision due to Brownian motion, velocity gradient, and sedimentation is insufficient. In our pre-vious work, we derived the level of effect of repulsive electrostatic forces between the nanoparticles, and we assessed the level of effect of the attractive magnetic forces between magnetic nanoparticles. In this paper, we sum-marised the findings and included it into an analytical model of collisions between magnetic nanoparticles. Due to attractive magnetic forces, the rate of aggregation is sig-nificantly higher, whereas the repulsive electrostatic forces are almost negligible. One can suppose that with other realistic selections of values of magnetization vector or surface charge, this trend would not change dramatically. This modified model of aggregation can better explain the rapid aggregation of zero-valent iron nanoparticles that is observed. This can help with the simulation of the migration of undissolved particles in groundwater.
Competing interests
The authors declare that they have no competing interests.
Authors’ contributions
DR carried out the study of the assessment of the aggregate structure according to interaction energies of the aggregate and with the inclusion of magnetic and electrostatic forces into the aggregation model. JˇS contributed to the conception of the study and to the interpretation of data, and revised the manuscript. Both authors read and approved the final manuscript.
Acknowledgements
This work was supported by the Ministry of Education of the Czech Republic within the project no. 7822 of the Technical University in Liberec and within the research project FR-TI1/456 ‘Development and implementation of the tools additively modulating soil and water bioremediation’ - Programme MPO-TIP supported by the Ministry of Industry and Trade.
Received: 16 October 2012 Accepted: 3 December 2012 Published: 10 January 2013
References
1. Kanchana A, Devarajan S, Rathakrishnan Ayyappan S:Green synthesis and characterization of palladium nanoparticles and its conjugates fromSolanum trilobatumleaf extract.Nano-Micro Lett2010, 2(3):169–176.
2. Alonso U, Missana T:Role of inorganic colloids generated in a high-level deep geological repository in the migration of radionuclides: open questions.J Iberian Geol2006,32:79–94. 3. Matsunaga T, Nagao S, Ueno T, Takeda S, Amano H, Tkachenko Y:
Association of dissolved radionuclides released by the Chernobyl accident with colloidal materials in surface water.Appl Geochem 2004,19(10):1581–1599.
4. Li L, Fan M, Brown RC, Van Leeuwen JH, Wang J, Wang W, Song Y, Zhang P:Synthesis, properties, and environmental applications of nanoscale iron-based materials: a review.Crit Rev in Environ Sci Technol 2006,36(5):405–431.
5. Nurmi JT, Tratnyek PG, Sarathy V, Baer DR, Amonette JE, Pecher K, Wang C, Linehan JC, Matson DW, Penn RL, Driessen MD:Characterization and properties of metallic iron nanoparticles: spectroscopy, electrochemistry, and kinetics.Environ Sci Technol2005, 39(5):1221–1230.
6. Filip J, Zboril R, Schneeweiss O, Zeman J, Cernik M, Kvapil P, Otyepka M: Environmental applications of chemically pure natural ferrihydrite. Environ Sci Technol2007,41(12):4367–4374.
7. Zhang WX:Nanoscale iron particles for environmental remediation: an overview.J Nanopart Res2003,5(3):323–332.
8. Camp TR:Velocity Gradients in Internal Work in Fluid Motion. Cambridge: MIT; 1943.
9. Smoluchowski M:Versuch einer mathematischen Theorie der Koagulationskinetik kolloider L ¨osungen.Z Phys Chem1917, 92:129–168.
10. Buffle J, van Leeuwen HP:Environmental Particles, Vol. 1. Chelsea: Lewis Publishers; 1992.
11. Somasundaran P, Runkana V:Modeling flocculation of colloidal mineral suspensions using population balances.Int J Mineral Process 2003,72(1–4):33–55.
12. Sun Y, Li Xq, Cao J, Zhang Wx, Wang HP:Characterization of zero-valent iron nanoparticles.Adv Colloid Interface Sci2006,120(1–3):47–56. 13. Horak D, Petrovsky E, Kapicka A, Frederichs T:Synthesis and
characterization of magnetic poly(glycidyl methacrylate) microspheres.J Magn Magn Mater2007,311(2):500–506. 14. Masheva V, Grigorova M, Nihtianova D, Schmidt JE, Mikhov M:
Magnetization processes of small gamma-Fe2O3particles in
non-magnetic matrix.J Phys D: Appl Phys1999,32(14):1595–1599. 15. Phenrat T, Saleh N, Sirk K, Tilton RD, Lowry GV:Aggregation and
sedimentation of aqueous nanoscale zerovalent iron dispersions. Environ Sci Technol2007,41:284–290.
16. Wang J, Wei LM, Liu P, Wei H, Zhang YF:Synthesis of Ni nanowires via a hydrazine reduction route in aqueous ethanol solutions assisted by external magnetic fields.NanoMicro Lett2010,1:49–52.
17. Einstein A:On the movement of small particles suspended in stationary liquids required by the molecular-kinetic theory of heat. Annalen der Physik1905,17:549–560.
18. Votruba V, Muzikar C:Teorie Elektromagnetickeho Pole. Praha: Akademia Karolinum; 1958.
19. Rosicka D, Sembera J:Assessment of influence of magnetic forces on aggregation of zero-valent iron nanoparticles.Nanoscale Res Lett 2010,6:10.
20. Sembera J, Rosicka D:Computational methods for assessment of magnetic forces between iron nanoparticles and their influence on aggregation.Adv Sci Eng Med2011,3(1,2):149–154.
21. Rosicka D, Sembera J:Influence of structure of iron nanoparticles in aggregates on their magnetic properties.Nanoscale Res Lett2011, 6:527.
22. Stumm W, Morgan JJ:Aquatic Chemistry: Chemical Equilibria and Rates in Natural Waters. New York: Wiley; 1996.
23. Dzombak DA, Morel FMM:Surface Complexation Modeling: Hydrous Ferric Oxide. 1st edition. New York: Wiley-Interscience; 1990.
24. Lyklema J:Fundamentals of Interface and Colloid Science. Amsterdam: Academic Press; 2005.
25. Sedlak B, Stoll I, Man O:Elektrina a magnetismus. Praha: Academia Karolinum; 1993.
doi:10.1186/1556-276X-8-20
Cite this article as:Rosick´a and ˇSembera:Changes in the nanoparticle aggregation rate due to the additional effect of electrostatic and magnetic forces on mass transport coefficients.Nanoscale Research Letters20138:20.
Submit your manuscript to a
journal and benefi t from:
7Convenient online submission 7Rigorous peer review
7Immediate publication on acceptance 7Open access: articles freely available online 7High visibility within the fi eld
7Retaining the copyright to your article