Technology (IJRASET)
Optimization of Cycle Time by Lean
Manufacturing Techniques-Line Balancing
Approach
Balaji Rathod#1, Prasad Shinde#2, Darshan Raut#3, Govind Waghmare#4
#
Department of Mechanical Engineering, Savitribai Phule Pune University
Abstract— With the importance of being competitive in today's market, many companies are adopting various methods to improve their productivity. One way to achieve this is to adopt lean manufacturing techniques. With the mind-set of building products cheaper, faster, and better to gain a competitive edge in the market, Company ABC Ltd. has used lean techniques such motion study and line balancing. Yamazumi Chart is used for line balancing. Using these tools helped company to develop process with cycle time within the takt time associated with building the product. Having a good understanding of these lean tools allowed for a better understanding of the waste associated with walk and wait that was in the production line and the importance of eliminating it.
Keywords— Lean Manufacturing, Cycle Time, Yamazumi Chart, Line Balancing.
I. INTRODUCTION
Ever changing globalized environment has been posing challenges of competitiveness and survival to all the constituents of the economy. Manufacturers have always faced heightened challenges such as rising customers’ expectation, fluctuating demand, and competition in markets. There is no doubt that these manufacturers are always embracing changes and improvements in their key activities or processes to cope with the challenges. One way to stay competitive in this globalized market is to become more efficient. This could be achieved by Lean Manufacturing. It helps us to achieve best quality, lowest cost, and shortest lead time through the elimination of waste. Waste (“muda” in Japanese) is ‘anything other than the minimum amount of equipment, materials, parts, space, and worker’s time, which are absolutely essential to add value to the product. Muda in production line is related to over production, inventory, defects, transportation, motion, waiting which increases lead time. Lead time for a process decides cycle time for the product (Cycle time is the time required to complete single unit). Hence by using Lean Manufacturing methods we can optimize cycle time. This paper focuses on optimization of cycle time by line balancing.
II. LITERATUREREVIEW
Technology (IJRASET)
workplace the simulation model is built and the initial results obtained. After balancing of the production process and improvement of its performance some further steps of the process optimization by using the improved simulation model are performed. The results of the combination of the line balancing and further process optimization raise the production rate of the process enormously, which is obvious from the research results of this paper. Mr. Silva et al. [6] studied the recent adoption is Lean Manufacturing in Apparel industry in Sri Lanka. The apparel industry faced considerable changes as a result of the removal of Multi Fiber Agreement in 2005. Delivering high quality garments at low cost in shorter lead times are the major challenges faced by the apparel manufacturers. In 2008, global recession badly affected almost all the apparel manufacturing industries in the world. Due to that demand for the low cost garments are increased by the customers. In order to face this global challenge, most of the local apparel manufacturers have adopted lean manufacturing techniques. Dr. Rajesh Kumar Mehta et al. [7] studied the implementation of Lean Manufacturing Practices in Automobile Sector Industry in India. The questionnaire-based survey methodology is applied to meet the set objectives of the project work. This project report has its focus on Lean Manufacturing Practices in the Gear Industries. The purpose of this study is to determine how the senior businesses professionals involve in manufacturing process are implementing the Lean Manufacturing Process. Khalil A El-Namrouty et al. [8] investigated the current situation of wastes elimination of the manufacturing firms in Gaza Strip and its important role for reducing the production cost; in addition it aims to promote lean thinking through studying the seven wastes that are targeted by the lean manufacturing philosophy. Wastes Relations Matrix (WRM) was implemented to analyze the effect of each waste on the other six wastes Priti Khadse et al. [9] studied Lean Manufacturing in Indian Industries by identifying critical lean manufacturing factors responsible for implementation of lean manufacturing in the Indian manufacturing sector and then to incorporate these factors into a framework, which can be represent the present status of lean practices in Indian industries. Also to identify barrier and benefits of lean manufacturing in industries.
A. Cycle Time
Cycle time is one of the important data for the line balancing at any production line. Cycle time is the time it takes to finish one product or the total of time takes before the product leaves the workstation and move to the next workstation. The cycle time required to process a customer order might start with the customer order and end with the order being delivered. The overall process is made up of many sub-processes such as order entry, assembly, inspection, packaging, and delivery. Cycle time is inversely related to throughput, decrease cycle time leads to increased throughput, show in the following equation:
B. Takt Time
Takt is a German word for rhythm and refers to how often the part or product is required or the rate at which the product is required (typically by the customer).
Takt time (time/piece) is computed as:
C. Optimization of Cycle Time
Cycle Time Optimization is identifying and implementing more efficient ways to do things. Reducing cycle time requires eliminating or reducing non-value-added activity, which is defined as any activity that does not add value to the product. Examples of non-value- added activity in which cycle time can be reduced or eliminated include repair due to defects, machine set-up, inspection, test and schedule delays. Reducing cycle time will have a significant impact on a company's bottom line when implemented.
Cycle time reduction is provides tremendous benefit to a company. From the cycle time reduction the non-value added activity will be reduce or eliminated. The benefit from this reduction is following below:
1) Reduced cost
2) Increase throughput
3) Streamlined processes
4) Improved communications
Technology (IJRASET)
6) Schedule integrity7) Improve on-time delivery
D. Motion Study
Motion Study is used for recording the method and determining cycle time of performing task assigned to a particular operator in a cycle. The task is recorded by video recording device like camcorder, smartphone. The task performed by operator is broken down into various time elements for convenience of observation, measurement and analysis. Breakdown into elements separates unproductive work, permitting rate of working to be assessed. After that, time required for each element is measured by watching recorded clip.
E. Line Balancing
Line balancing is the important tool to decreasing production time, maximizing the output or minimizing the cost of a product. It involves arranging the individual processing and assembly tasks at the workstations so that the total time required at each workstation is approximately the same. It helps in eliminating or reducing non-value-added activity, which is defined as any activity that does not add value to the product.
In the line balancing tool the important data is the details of the process flow and the cycle time at each workstation. The classical line balancing problem consists of assigning each operation to a workstation such that the number of workstations is minimized and precedence constraints are satisfied. The sum of time for all operations of this workstation (cycle time) must not exceed the given takt time. The difference between the takt time and cycle time is called idle time. The balance delay time will be minimal if and only if the number of workstations is minimal too. The dual problem is minimization of the cycle time for a given number of workstations.
F. Yamazumi Chart
A Yamazumi chart is a stacked bar chart that shows the balance of cycle time workloads between a number of operators typically in an assembly line or work cell. The Yamazumi chart can be either for a single product or multi product assembly line. Yamazumi is a Japanese word that literally means to stack up. These are simply work balance charts to visually present the work content of a series of tasks and facilitate work balancing and the isolation and elimination of non-value added work content.
G. Line Balance Rate
The line balance rate (LBR), and the related line balance loss rate (which is simply 100% minus the LBR), quantifies how well or poorly the line is balanced.
III. CASESTUDY
Technology (IJRASET)
Fig. 1 Layout before Line Balancing
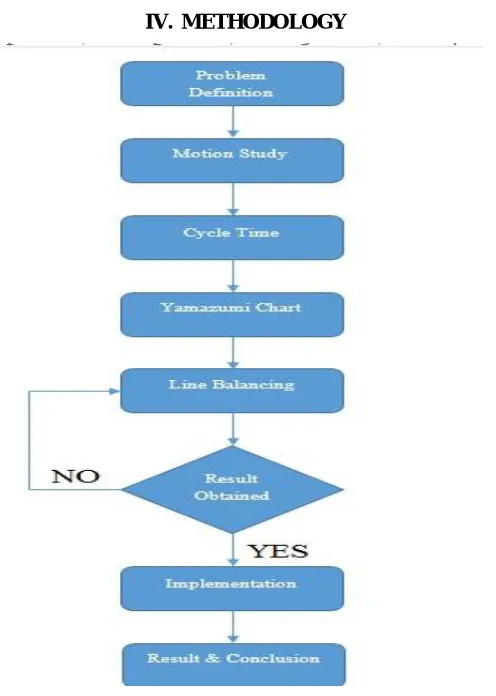
IV. METHODOLOGY
[image:5.612.192.440.349.697.2]Technology (IJRASET)
V. BEFORE LINEBALANCING
Cycle Time for various workstations is calculated for various stations and tabulated as follows. Takt Time for target of 75 axles/day is 720 sec and for 90 axles/day is 600 sec. Using cycle time data from Table I, Yamazumi Chart is drawn.
TABLEI
CYCLE TIME OF WORKSTATIONS BEFORE LINE BALANCING
Fig. 3 Yamazumi Chart before Line Balancing
VI. ACTIONS
In order to balance line, following actions are taken
A. Station 3 & Station 7 are combined to single Station by using different fixture on same machine.
B. Station 6 & Station 8 are placed near each other and are handled by same operator.
C. A part of workload of operator on Station 5 is distributed to operators on Station 4 and on Station 6 & 8.
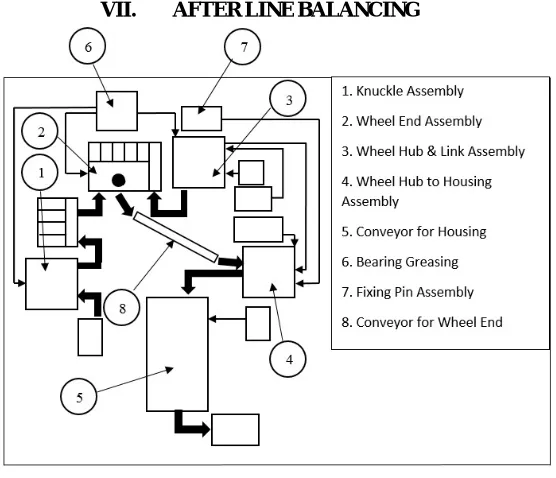
[image:6.612.176.454.440.679.2]VII. AFTERLINEBALANCING
Fig. 4 Layout after Line Balancing
Cycle time for various workstations is calculated for various stations after line balancing and tabulated as follows. Station
No.
Workstation Average
Time(sec)
1. Knuckle Assembly 581
2. Wheel End Assembly 386
3. Wheel Hub Assembly 161
4. Wheel End to Housing Assembly 380 5. Final Axle Assembly on
Conveyor 663
6. Bearing Greasing 160
7. Link Assembly 191
Technology (IJRASET)
TABLEIIICYCLE TIME OF WORKSTATIONS AFTER LINE BALANCING
Station No.
Workstation Average Time(sec)
1. Knuckle Assembly 581
2. Wheel End Assembly 386
3. Wheel Hub & Link Assembly 352 4. Wheel End to Housing Assembly 515 5. Final Axle Assembly on
Conveyor 420
6. Bearing Greasing &
Fixing Pin Preparation 390
Total 2643
Fig. 5 Yamazumi Chart After Line Balancing
VIII. CONCLUSIONS
In this paper focus given on the optimization of cycle time and reduction of non-value added activity. Improvement in the productivity achieved and elimination of non-value added activities has been done. The cost of operation is reduced considerably. Optimization of cycle time study is helpful for low cost automation and bench marking activity at industry production improvement level.
A. The balance rate calculated for present for previous layout is found to be 49.83% for both Sub-Assembly and Final Assembly combined.
B. The balance rate after the line balancing is 76.52% for both Sub-Assembly and Final Assembly combined.
C. Time required for producing one axle is 581 sec.
REFERENCES
[1] Rogstad, Rogney S“Implementating Lean Manufacturing Principles in Manufacturing Envionment”, International Journal of Advanced Engineering Research and Studies E-ISSN2249–8974 .
[2] Priti Khadse, Avnish Sarode,Renu Wasu,“Lean Manufacturing in Indian Industries A Review”, (2003) 266–275. [3] Dr.Shellyanne Wilson, “Just In Time Manufacturing-By Design Or By Default”,011-0839
[4] D.Rajenthirakumar, P.V.Mohanram, S.G.Harikarthik, “Process cycle efficiency through lean: A case study”, 23 March -2011 .
[5] Sandip K. Kumbhar, Nirajan M.R, Sanjay T. Satpute, “Assembly line production improvement by optimization of cycle time”, 1 June 2014. [6] Khalil-A,El-Namrouty, “Seven Waste Elimination Targeted by Lean Manufacturing”(2012)255-4878
[7] Aasheet Kumar, Gaurav Chaudhary, Manish Kalra, Binit Kumar Jha, , “Optimization of Cycle Time for Wire Harness Assembly – Line Balancing and Kaizen Approach”(2010)303-8585
[8] Gratiela Dana, “Kaizen Method In Production Management” E-ISSN2248–8974
[9] Silva, S.K.P.N, “Applicability of Value Stream Mapping (VSM) in the Apparel industry in Sri Lanka”12 June 2015