N A N O E X P R E S S
Open Access
Deposition of F-doped ZnO transparent thin films
using ZnF
2
-doped ZnO target under different
sputtering substrate temperatures
Fang-Hsing Wang
1, Cheng-Fu Yang
2*and Yen-Hsien Lee
1Abstract
Highly transparent and conducting fluorine-doped ZnO (FZO) thin films were deposited onto glass substrates by radio-frequency (RF) magnetron sputtering, using 1.5 wt% zinc fluoride (ZnF2)-doped ZnO as sputtering target. Structural, electrical, and optical properties of the FZO thin films were investigated as a function of substrate temperature ranging from room temperature (RT) to 300°C. The cross-sectional scanning electron microscopy (SEM) observation and X-ray diffraction analyses showed that the FZO thin films were of polycrystalline nature with a preferential growth along (002) plane perpendicular to the surface of the glass substrate. Secondary ion mass spectrometry (SIMS) analyses of the FZO thin films showed that there was incorporation of F atoms in the FZO thin films, even if the substrate temperature was 300°C. Finally, the effect of substrate temperature on the transmittance ratio, optical energy gap, Hall mobility, carrier concentration, and resistivity of the FZO thin films was also investigated.
Keywords:Deposition; FZO thin films; Secondary ion mass spectrometry
Background
Transparent conducting oxide (TCO) thin films based on zinc oxide (ZnO) are promising for applications in various optoelectronic devices. In spite of extensive studies on preparation, characterization, and effect of doping on the properties of ZnO, certain effects of either some dopant or preparation procedures are still remaining unclear. However, ZnO-based thin films present a lot of advantages such as low material cost, non-toxicity, and high chemical stability under the hydrogen plasma as compared to tin-doped indium oxide (ITO) [1]. For that, transparent conducting ZnO thin films have already been extensively used in solar cells, light-emitting diodes, and liquid crystal displays as a substitute for ITO [2,3]. Much more interest has been given to TCOs based on ZnO such as undoped ZnO thin films [4], Al-doped ZnO (AZO) thin films [5], and Ga-doped ZnO (GZO) thin films [6] due to their stability under hydrogen plasma which makes them a potential candidate for solar cells' technology based on thin-film silicon. Fluorine, the ionic radius (0.136 nm)
of which is similar to that of oxygen (0.132 nm), may be an adequate anion doping candidate due to lower lattice distortion compared with Al, Ga, and In, but com-paratively few studies on fluorine-doped ZnO (F-doped ZnO) can be found in the past researches [7].
Many different physical and chemical deposition methods were used to investigate the properties of the F-doped ZnO thin films. For example, the F-doped ZnO thin films were deposited on Corning glass by radio-frequency (RF) magnetron sputtering of pure ZnO target in CF4-containing gas mixtures. The fluorine con-tent in F-doped ZnO thin films increased with increasing CF4concentration in sputter gas [8]. Treharne attempted to achieve substitutional doping of ZnO with F by using trifluoromethane (CHF3) as the partial pressures of Ar-H2-CHF3, where the constant ppH2of 5% was used and the partial pressures of CHF3were changed in the range of 0% to 7% [9]. The F-doped ZnO thin films could also be deposited on glass slide substrates using d.c. reactive magnetron sputter at room temperature, with the substrate holder at the floating potential using an Ar/O2 (/F2) gas mixture by using the pure metallic Zn as target [10]. Anandhi et al. used the SnCl2· 2H2O (0.1 M) and Zn * Correspondence:[email protected]
2
Department of Chemical and Materials Engineering, National University of Kaohsiung, Kaohsiung 81148, Taiwan
Full list of author information is available at the end of the article
(CH3COO)2· 2H2O (0.2 M) as the host precursors and NH4F as the dopant precursor for the deposition of the F-doped SnO2layer on the F-doped ZnO (FZO) layer to get the bi-layer thin films by using a simplified spray pyrolysis technique [11]. Rozati et al. used 0.4 M solution containing zinc acetate dehydrated as the host solution, which was dissolved in a mixture of double-distilled water, methanol (3:7 volume proportion), and acetic acid. They used the ammonium fluoride as the doped starting solu-tion, with a fixed [F]/[Zn] ratio of 2 at.%; the F-doped ZnO thin films were also deposited by using a spray pyrolysis technique [12].
As we know, if the fluorine-based gases are used during the sputtering process, the environmental pollution prob-lem and the probprob-lem of the chamber being etched are unavoidable. When the chemical deposition methods are used to deposit F-doped ZnO thin films on the substrate with large area, surface roughness and thickness uniform-ity are two important problems needed to overcome. In the past, Cao et al. prepared the highly transparent and conducting F-doped ZnO thin films on glass substrates by pulsed laser deposition using a sintered ZnO target containing 1 at.% zinc fluoride (ZnF2) as a function of oxygen pressure ranging from 0.01 to 0.5 Pa [13]. Ku et al. deposited the F-doped ZnO thin films at room temperature by using ZnO target with different ZnF2 contents. The fluorine content which increased almost linearly with increasing ZnF2content in sputter target was expectable [14]. As physical vapor deposition method is used to deposit the TCO thin films, the substrate temperature will have large effect on their physical and electrical characteristics. Nevertheless, the two articles ([13,14]) do not investigate the effect of substrate temperature on the characteristics of the F-doped ZnO thin films.
Despite wide usage of magnetron sputtering technique in the fabrication of TCO thin films, only few studies have been reported on using the F-doped ZnO targets to deposit the FZO thin films by using sputtering technique. In this study, 1.5 wt% ZnF2was added into ZnO powder to prepare the FZO target. The first important topic is that the FZO thin films were deposited by reactive RF mag-netron sputtering on glass substrate by changing the substrate temperature. The effects of different substrate temperatures on the physical and electrical properties of the FZO thin films, including the crystallinity, surface and cross-sectional morphologies, carrier mobility, carrier concentration, resistivity, optical transmission spectrum, and optical band gap (Eg) were all well investigated. Be-cause the substrate temperature is increased from room temperature to 300°C, the second important topic is that the secondary ion mass spectrometry (SIMS) analysis is used to find the effect of substrate temperature on the fluorine content in the FZO thin films.
Methods
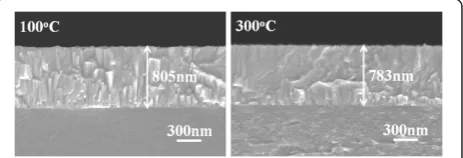
[image:2.595.307.539.626.705.2]The 1.5 wt% ZnF2(99.995%) was mixed with zinc oxide powder (99.999%) to form the FZO composition. After being dried and ground, the FZO powder was calcined at 600°C for 1 h and then ground again and mixed with polyvinyl alcohol (PVA) as binder. The mixed powder was uniaxially pressed into pellets of 5-mm thickness and 54-mm diameter using a steel die. After debindering, the FZO pellet was sintered at 1,060°C for 3 h. The FZO thin films were deposited on 33 mm × 33 mm × 2 mm Corning 1737 glass substrates (Corning, NY, USA) using an RF sput-tering system. Before the deposition process was started, the base chamber pressure was pumped to 5 × 10⁻⁶Torr (detected by using MKS Baratron gauge, Andover, MA, USA), and the substrate temperature was changed from room temperature (RT) to 300°C. During the deposition process, the deposition pressure was controlled at 5 × 10⁻³ Torr, and only argon was introduced in the chamber; the flow rate of pure argon (99.999%) was approximately 20 sccm, and the deposition power was 150 W. The FZO thin films' thickness was measured using a Nano-View SEMF-10 ellipsometer (Ansan, South Korea) and confirmed by averaging five data obtained by field emission scanning electron microscopy (FESEM). The deposition rate was calculated from the measured thickness, while thin films' crystalline structure was identified by X-ray diffraction (XRD). By controlling the deposition time, a thickness of about 790 ± 30 nm was attained for all the FZO thin films, as Figure 1 shows. As calculated from the mea-sured thickness, the deposition rate of the FZO thin films was linearly decreased from 2.37, 2.36, 2.35, to 2.34 Å/s as the substrate temperature was raised from RT, 100°C, 200°C, to 300°C, respectively. Those results suggest that substrate temperature has no apparent effect on the deposition rate of the FZO thin films. FESEM was also used to observe their surface and cross-sectional morphologies. The electrical resistivity was measured using a four-point probe, and the Hall effect coefficient was measured using a Bio-Rad Hall set-up (Hercules, CA, USA). The optical transmission spectrum was re-corded by using a Hitachi U-3300 UV-vis spectropho-tometer (Chiyoda, Tokyo, Japan) in the 300- to 800-nm wavelength range.
Results and discussion
XRD patterns of the FZO thin films as a function of substrate temperature are shown in Figure 2. No extra phases involving fluorine compounds, such as ZnF2, were observed even for the RT-deposited FZO thin film. This can be attributed to low doping concentration of ZnF2. Even if all the FZO thin films exhibited the (002) peak, they really had different diffraction results. The diffraction intensity of (002) peak critically increased as the substrate temperature increased from RT to 300°C, and a weak (004) peak was also observed in the 300°C-deposited FZO thin films. Those results indicate that the c-axis of the FZO thin films is predominantly oriented parallel to the substrate normal. The images in Figure 1 show that the FZO thin films are very dense with wide-bar structure (for RT ~ 200°C-deposited FZO thin films) or nano-scale columnar structure (for 300°C-deposited FZO thin films) normal to the surface of the substrate, thus confirming thec-axis orientation growth as indicated by XRD patterns in Figure 2. The absence of additional peaks in the XRD patterns excludes the possibility of any extra phases and/or large-size precipitates in the FZO thin films. The (002) peaks of the FZO thin films prepared at substrate temperatures = RT, 100°C, 200°C, and 300°C were situated at 2θ= 34.24°, 34.24°, 34.31°, and 34.31°, respect-ively. The lattice constantcwas calculated by using the 2θ value; as substrate temperatures were RT, 100°C, 200°C, and 300°C, the calculated lattice constants (c) were 0.5236, 0.5236, 0.5228, and 0.5228, respectively. As we know, the ionic radius (0.136 nm) of fluorine is similar to that of oxy-gen (0.132 nm). For that, as fluorine is used to substitute the sites of oxygen, the lattice constant cof the FZO thin films similar to that of the ZnO thin films is considerable.
As Figure 2 shows, as substrate temperatures were RT, 100°C, 200°C, and 300°C, the full width at half maximum
(FWHM) values for the (002) peak of the FZO thin films were 0.320°, 0.294°, 0.280°, and 0.268°, respectively. The increase of relative diffraction intensity and the decrease of FWHM value of (002) peak with raising substrate temperature suggest that FZO thin films deposited at higher temperature have the better crystalline structure and the defects in the FZO thin films decrease with raising substrate temperature. This is because as higher substrate temperature is used to deposit the FZO thin films, the FZO particles or molecules can have larger active energy for the crystallization. For that, the number of thin films' defects decreases and the crystallization of the FZO thin films is improved; then, the FWHM value decreases.
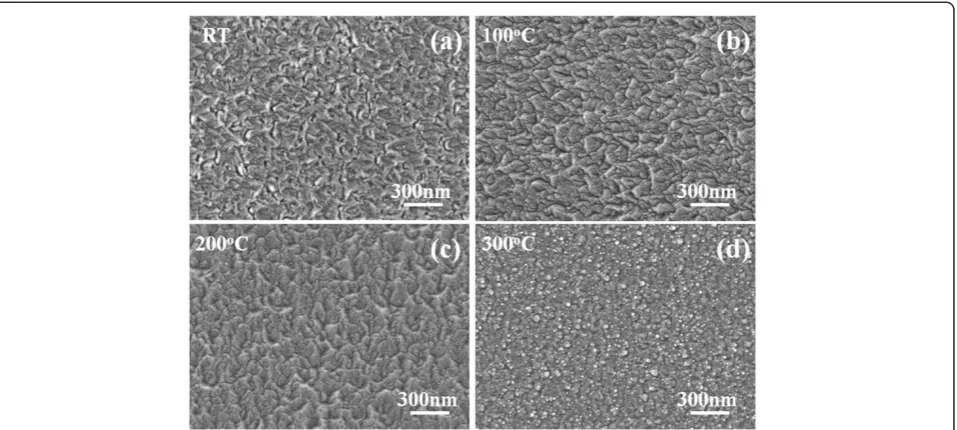
Surface FESEM observations on the FZO thin films were taken to evaluate their surface morphology and lateral grain size, and the results are shown in Figure 3. As lower sub-strate temperatures were used, for example RT (Figure 3a), 100°C (Figure 3b), and 200°C (Figure 3c), the grain bound-aries and roughness morphology were really observed on the surfaces of the FZO thin films. As higher substrate temperature was used, for example 300°C (Figure 3d), the grain boundaries were not easily observed and the densified and flat morphologies were really observed. As lower substrate temperature was used, the FZO particles or molecules have many nuclear points and have no enough active energy to aggregate together for thin films' flatness. As higher substrate temperature was used, the FZO parti-cles or molecules will obtain the enough active energy for thin films' crystallization and flatness. The results in the XRD patterns match the variation in the morphology of the SEM observations that the different morphologies having in cross section (Figure 1) and the surface (Figure 3) of the FZO thin films will lead different crystallization results. The surface morphology in Figure 3d has a large difference as compared with those of Figures 3a,b,c. The cross-sectional observation in Figure 1 can be used to find the reason. The 100°C-deposited FZO thin films have a wide-bar structure, which will result in the cave-like surfaces. The 300°C-deposited ones have the nano-scale columnar aggregation structure, which will result in the small-grain surfaces.
[image:3.595.57.291.527.704.2]Nakanishi et al. pointed out that as electron beam evaporation was used to deposit the ZnF2:Mn thin films, ZnF2was oxidized to ZnO by residual O2gas at a pressure of about 0.13 mPa [15]. In this study, ZnF2was not likely to be transformed into ZnO because O2gas was not intro-duced into the chamber during the sputtering process. SIMS is a high-sensitivity surface analysis technique for the determination of surface composition and contaminant analysis and for depth profile in the uppermost surface layers of a sample, and it can detect very low concen-trations of dopants and impurities. Secondary ions formed during the sputtering process are extracted and analyzed using a mass spectrometer (usually a quadrupole Figure 2XRD patterns of the FZO thin films as a function of
or magnetic sector). For that, the SIMS analysis is used to find the distribution of Zn, O, and F elements, and the results are shown in Figure 4. Figure 4 proves that the thickness of the FZO thin films is around 790 nm (from the depth profiles of F and Zn). The concentrations of Zn and O elements are almost unchanged as the substrate temperature is raised from RT to 300°C. For that, only the concentrations of Zn and O elements of the RT-deposited FZO thin films are shown in Figure 4. Figure 4 also shows that fluorine can be detected in the 300°C-deposited FZO thin films, and the concentration of fluorine element of the RT-deposited FZO thin films is higher than that of 300°C-deposited FZO thin films. However, the relative fluorine concentration of the FZO thin films is lower than that of the prepared FZO
composition. Because oxygen is not introduced during the deposition process, the vaporization of fluorine during the sintering and deposition processes is believed as the rea-son to cause this result.
[image:4.595.61.540.89.304.2]When sputtering method is used to deposit the FZO thin films on a glass substrate, the FZO molecules are changed to plasma by the bombardment of Ar. Many defects are believed to be formed during the deposition process, which will inhibit electron movement. The crys-tallinity of the FZO thin films can be improved by many processes, the increase in the substrate temperature is be-lieved the simplest process. However, as ZnF2 is added into ZnO as dopants and the FZO thin films are deposited at different substrate temperatures, three factors are be-lieved to cause the variations of electrical properties of the FZO thin films. First, the higher substrate temperature provides more energy and thus enhances the mobility of deposition particles or molecules, which can improve crystallization and decrease the number of defects in the FZO thin films; the XRD pattern shown in Figure 2 has proven this result. Second, as the substrate temperature increases, the density of the FZO thin films increases and the barriers inhibiting electron transportation decrease; the SEM morphologies shown in Figure 3 has proven this result. Third, as we know, oxygen vacancies are formed during the deposition processes of the ZnO-based thin films, which will form the intrinsic n-type semiconductors. Too many oxygen vacancies may lead to an increase in the defect and scattering centers of the ZnO-based thin films, which will catch the electron and result in the de-creases of carrier concentration and mobility. As the ZnF2 is added into ZnO as dopants, the fluoride will occupy the sites of ionic oxygen, and the problem in the decreases of Figure 4SIMS analysis of the depth profiles of Zn, O, and
F elements.
[image:4.595.58.291.538.702.2]carrier concentration and mobility can be improved. Figure 4 proves that even if FZO is deposited at 300°C, the fluoride can still be found in the FZO thin films.
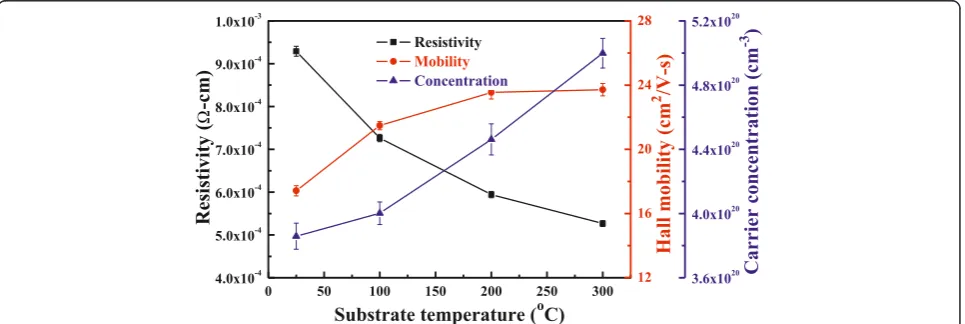
Both the carrier concentration (n) and the carrier mobil-ity (μ) contribute to the conductivity (ρ), becauseρ= 1/neμ. As Figure 5 shows for the FZO thin films deposited at different substrate temperatures, the carrier concentration and carrier mobility linearly increased with raising sub-strate temperature and reached a maximum concentration and carrier mobility of 5.00 × 1020cm−3and 23.72 cm2/V s at 300°C. A minimum resistivity of 5.27 × 10⁻⁴Ωcm for the FZO thin films at a substrate temperature of 300°C is mainly caused by the carrier concentration and mobility being at their maximum. Figure 6 shows the variations of the FZO thin films' resistivity as a function of duration time. As Figure 6 shows, the FZO thin films have the stable resistivity values, because as the thin films are mea-sured after duration of 25 days, the increase of resistivity is only 0.4%.
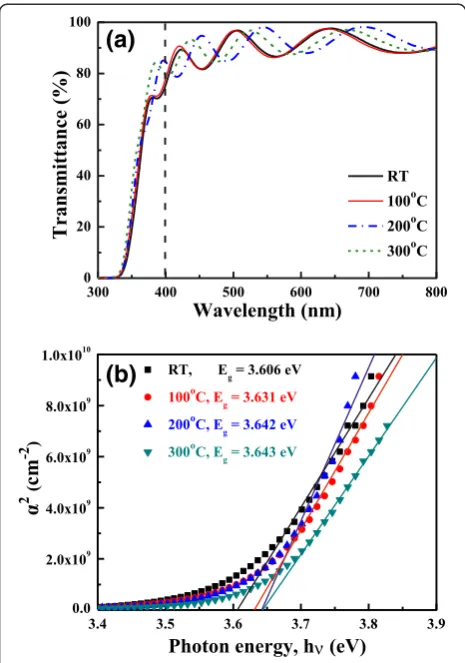
Figure 7a shows the FZO thin films prepared at different substrate temperatures. The transmittance spectra are plotted against wavelengths in the region of 300 to 800 nm. As Figure 7a shows, the optical transmittance ratio at 400 ~ 700 nm is more than 90% for all thin films regard-less of the variation of substrate temperature. The average transmittance ratio of the FZO thin films increased as the substrate temperature was raised. From the XRD patterns shown in Figure 2 and surface morphologies shown in Figure 3, the crystallization of the FZO thin films increases and the roughness of the FZO thin films is improved with raising substrate temperature. The two results prove that the improvements of the crystallinity and the densification are the reasons to cause the increase in the average trans-mittance ratio of the FZO thin films.
In the past, the determination of the optical band gap (Eg) was often necessary to develop the electronic band structure of a thin-film material. However, using
extrapolation methods, theEg values of thin films can be determined from the absorption edge for direct interband transition. The absorption coefficientαwas calculated using Lambert's law as follows:
α¼ ln 1ð =TÞ=d ð1Þ
whereTanddare the thin film's transmittance ratio and thickness. The absorption has a maximum at a high energy and decreases with optical energy in a manner similar to the absorption edge of semiconductors. Assuming that transition becomes constant at the absorption edge, the absorption coefficient α for simple parabolic scheme can be ascribed as a function of incident photon energy as [16]
αhν∝ hν−Eg n
ð2Þ
[image:5.595.58.541.552.714.2]wherenis a constant,n= 1/2 is the allowed direct transi-tion and n= 2 is the allowed indirect transition,hνis the photon energy, and Egis the optical band gap. Figure 7b
Figure 5Hall mobility, carrier concentration, and resistivity of FZO thin films as a function of substrate temperature.
shows the typical (αhν)2versushνplots of the FZO thin films as deposited at various substrate temperatures. The nvalue is around 1/2, and the linear dependence of (αhv)2 onhνindicates that the GZO thin films are direct tran-sition type semiconductor. Figure7b shows that as the substrate temperature increased from RT to 300°C, the Egvalue increased from 3.606 to 3.643 eV.
Figure 8 shows the relationship between the carrier concentration and Eg value, which presents that as the substrate temperature raises (or the carrier concentration increased), the absorption edge of the FZO thin films is blue-shifted (as calculated from 3.300 eV for ZnO thin films). This blue-shifting can be explained by the Burstein-Moss shift, a shift of the Fermi level into the conduction band, which enhances the optical band gap, as follows [17,18]:
ΔEBMg ¼ℏ
2k2
F 2
1 meþ
1 mh
¼ℏ2k2F
2mvc ð3Þ
where kFstands for the Fermi wave vector and is given
bykF= (3π2ne)1/3,meis the effective mass of electrons in
the conduction band, and mh is the effective mass of
holes in the valence band, which can be simplified as mvc, the reduced effective mass. ΔEBMg can be rewritten bykFfor the carrier concentrationne:
ΔEg ¼ h2 8me
3
π 2=3
ne2=3 ð4Þ
Equation 4 shows the important relationship between the degenerated semiconductor and the carrier concentration ne, wheremeis approximately equal to 0.28m0, andm0is the mass of the free electron [18]. In this study, thenevalue calculated from Equation 4 is around 0.692, which is close to the theoretical value of 0.667. When the wavelength is equal to 300 nm, the visible light absorbed by the thin films is due to a quantum phenomenon called band edge ab-sorption. Burstein indicated that an increase of the Fermi level in the conduction band of a degenerated semicon-ductor leads to the energy band widening effect [17]. For that, the Burstein-Moss shift of the absorption edge to the shorter wavelength region is due to the increase in carrier concentration.
Conclusions
[image:6.595.57.290.88.420.2]FZO thin films had been successfully prepared by the RF magnetron sputtering under different substrate tempera-tures. A minimum resistivity of 5.27 × 10⁻⁴Ωcm, with a maximum carrier concentration of 5.00 × 1020cm−3and a maximum Hall mobility of 23.72 cm2/V s, was obtained for the FZO thin films prepared at the substrate temperature of 300°C. The deposited FZO thin films had the stable resistivity values, because as the FZO thin films were measured after 25 days, only 0.4% increase in the thin films' resistivity was observed. The FZO thin films were uniform, and the average optical transmittance ratio in the entire visible wavelength region was higher than
Figure 8Relationship of the blue-shift and carrier concentration of the FZO thin films.
(a)
(b)
Figure 7Transmittance (a) and (αhv)2(wherea=αhv) versus
hν-Egplots (b) of FZO thin films as a function of substrate
[image:6.595.305.539.88.260.2]90%, independent on the substrate temperature. As the substrate temperature increased from RT to 300°C, theEg value increased from 3.606 to 3.643 eV, which indicated that the blue-shift effect really happened in the FZO thin films.
Competing interests
The authors declare that they have no competing interests.
Authors’contributions
F-HW and Y-HL proposed an idea to deposit F-doped ZnO transparent thin films, helped in the deposition of the F-doped ZnO transparent thin films, participated in the experimental process, and helped in the data analysis. C-FY also proposed an idea to deposit F-doped ZnO transparent thin films, participated in the experimental process, helped in the data analysis, and wrote the paper. All authors read and approved the final manuscript.
Acknowledgements
The authors acknowledge the financial support from NSC 101-2221-E-005-065, NSC 102-2622-E-390-002-CC3, and NSC 102-2221-E-390-027.
Author details
1
Department of Electrical Engineering, National Chung Hsing University, Taichung 40227, Taiwan.2Department of Chemical and Materials Engineering, National University of Kaohsiung, Kaohsiung 81148, Taiwan.
Received: 22 October 2013 Accepted: 14 February 2014 Published: 26 February 2014
References
1. Major S, Kumar S, Bhatnagar M, Chopra KL:Effect of hydrogen plasma treatment on transparent conducting oxides.Appl Phys Lett1986,
49(7):394–396.
2. Ramamoorthy K, Kumar K, Chandramohan R, Sankaranarayanan K:Review on material properties of IZO thin films useful as epi-n-TCOs in opto-electronic (SIS solar cells, polymeric LEDs) devices.Mater Sci Eng B
2006,126(1):115.
3. Minami T:Present status of transparent conducting oxide thin-film development for indium-tin-oxide (ITO) substitutes.Thin Solid Films2008,
516(17):5822–5828.
4. Fay S, Kroll U, Bucher C, Vallat-Sauvain E, Shah A:Low pressure chemical vapour deposition of ZnO layers for thin-film solar cells: temperature induced morphological changes.Sol Energy Mater Sol Cells2005,
86(3):385–397.
5. Huang CC, Wang FH, Yang CF:Effects of deposition temperature and hydrogen flow rate on the properties of the Al-doped ZnO thin films and amorphous silicon thin-film solar cells.Appl Phys A2013,
112(4):877–883.
6. Wang FH, Huang CC, Yang CF, Tzeng HT:Optical and electrical properties of the different magnetron sputter power 300°C deposited Ga2O3-ZnO thin films and applications in p-i-nα-Si:H thin-film solar cells.Int J Photoenergy2013. dx.doi.org/10.1155/2013/270389.
7. Tsai YZ, Wang NF, Tsai CL:Fluorine-doped ZnO transparent conducting thin films prepared by radio frequency magnetron sputtering.Thin Solid Films2010,518(17):4955–4959.
8. Yoon HS, Lee KS, Lee TS, Cheong B, Choi DK, Kim DH, Kim WM:Properties of fluorine doped ZnO thin films deposited by magnetron sputtering.
Sol Energy Mater Sol Cells2008,92(11):1366–1372.
9. Treharne RE, Durose K:Fluorine doped ZnO thin films by RF magnetron sputtering.Thin Solid Films2011,519(21):7579–7582.
10. Noirfalise X, Godfroid T, Guisbiers G, Snyders R:Synthesis of fluorine doped zinc oxide by reactive magnetron sputter.Acta Mater2011,
59(20):7521–7529.
11. Anandhi R, Ravichandran K, Mohan R:Conductivity enhancement of ZnO:F thin films by the deposition of SnO2:F over layers for optoelectronic applications.Mater Sci Eng B2013,178(1):65–70.
12. Rozati SM, Moradi S, Golshahi S, Martins R, Fortunato E:Electrical, structural and optical properties of fluorine-doped zinc oxide thin films: effect of the solution aging time.Thin Solid Films2009,518(4):1279–1282.
13. Cao L, Zhu L, Jiang J, Zhao R, Ye Z, Zhao B:Highly transparent and conducting fluorine-doped ZnO thin films prepared by pulsed laser deposition.Sol Energy Mater Sol Cells2011,95(3):894–898.
14. Ku DY, Kim YH, Lee KS, Lee TS, Cheong B, Seong TY, Kim WM:Effect of fluorine doping on the properties of ZnO films deposited by radio frequency magnetron sputtering.J Electroceram2009,23(2):415–421. 15. Nakanishi Y, Naito S, Nakamura T, Hatanaka Y, Shimaoka G:The influence of
residual O2gas in vacuum on the structural and luminescent properties of ZnF2:Mn thin films.Appl Surf Sci1996,92(2):400–403.
16. Ables A:Optical Properties of Solids.Amsterdam: North Holland; 1992. 17. Burstein E:Anomalous optical absorption limit in InSb.Phys Rev1954,
93(3):632–633.
18. Sernelius BE, Berggren KF, Jim ZC, Hamberg I, Granqvist CG:Band-gap tailoring of ZnO by means of heavy Al doping.Phys Rev B1988,
37(17):10244–10248.
doi:10.1186/1556-276X-9-97
Cite this article as:Wanget al.:Deposition of F-doped ZnO transparent thin films using ZnF2-doped ZnO target under different sputtering substrate temperatures.Nanoscale Research Letters20149:97.
Submit your manuscript to a
journal and benefi t from:
7 Convenient online submission 7 Rigorous peer review
7 Immediate publication on acceptance 7 Open access: articles freely available online 7 High visibility within the fi eld
7 Retaining the copyright to your article