http://dx.doi.org/10.4236/msa.2014.514107
How to cite this paper: Sokalski, K.Z., Jankowski, B. and Ślusarek, B. (2014) Binary Relations between Magnitudes of Dif-ferent Dimensions Used in Material Science Optimization Problems Pseudo-State Equation of Soft Magnetic Composites.
Materials Sciences and Applications, 5, 1040-1047. http://dx.doi.org/10.4236/msa.2014.514107
Binary Relations between Magnitudes of
Different Dimensions Used in Material
Science Optimization Problems
Pseudo-State Equation of Soft Magnetic
Composites
Krzysztof Z. Sokalski
1*, Bartosz Jankowski
2, Barbara Ślusarek
21Institute of Computer Sciences, Częstochowa University of Technology, Częstochowa, Poland 2Tele and Radio Research Institute, Warszawa, Poland
Email: *[email protected]
Received 13 September 2014; revised 12 October 2014; accepted 10 November 2014
Copyright © 2014 by authors and Scientific Research Publishing Inc.
This work is licensed under the Creative Commons Attribution International License (CC BY).
http://creativecommons.org/licenses/by/4.0/
Abstract
New algorithm for optimizing technological parameters of soft magnetic composites has been de-rived on the base of topological structure of the power loss characteristics. In optimization mag-nitudes obeying scaling, it happens that one has to consider binary relations between the magni-tudes having different dimensions. From mathematical point of view, in general case such a pro-cedure is not permissible. However, in a case of the system obeying the scaling law it is so. It has been shown that in such systems, the binary relations of magnitudes of different dimensions is correct and has mathematical meaning which is important for practical use of scaling in optimiza-tion processes. The derived structure of the set of all power loss characteristics in soft magnetic composite enables us to derive a formal pseudo-state equation of Soft Magnetic Composites. This equation constitutes a relation of the hardening temperature, the compaction pressure and a pa-rameter characterizing the power loss characteristic. Finally, the pseudo-state equation improves the algorithm for designing the best values of technological parameters.
Keywords
Soft Magnetic Composites, Scaling, Binary Relations, Pseudo-State Equation
1. Introduction
Recently novel concept of technological parameters’ optimization has been applied in Soft Magnetic Compo-sites (SMC) by Ślusarek et al., [1]. This concept is based on assumption that SMC is a self-similar system where function of loss of power obeys the scaling law [2]-[4]. The efficiency of scaling in solving problems concerning power losses in soft magnetic composites has already been confirmed in [1].
The scaling is very useful tool due to the three reasons:
• it reduces number of independent variables f and Bm to the effective one f
( )
Bmα
,
• and determines general form of loss of power characteristic in a form of homogenous function in general sense (h.f.g.s.),
• as well as enables us to use binary relations between magnitudes of different dimensions.
Reduction of independent variables is based on definition of the h.f.g.s., namely,
F f B
(
,
m)
is the h.f.g.s. if:{
, ,}
:(
a , b)
c(
,)
.m m
a b c
λ
+ =>Fλ
fλ
Bλ
F f B∃ ∈ × × ∀ ∈ = (1)
According to the assumption concerning λ we are free to substitute any positive real number, for instance
( )
1bm
B
λ
−= then we get:
(
,)
,1
m
m m
F f B f
F
Bβ Bα
=
(2)
where f and Bm are frequency and pik of magnetic inductance, respectively. F
( )
⋅,1 is an arbitrary function,a b
α= , c
b
β= are scaling exponents.
Choice for the
F
( )
⋅
,1
depends on the power loss characteristics of investigated materials. In [1] we have modified the Bertotti decomposition rule [5] [6] which led to the following form for Ptot( )
Bm F( )
,1β
⋅ = ⋅ :
(
)
(
(
(
)
)
)
tot
1 2 3 4
Γ Γ Γ Γ
m m m m
m
P
f B f B f B f B
B
α α α α
β = ⋅ + ⋅ + ⋅ + ⋅ (3)
[image:2.595.205.419.523.684.2]where Γn, α and
β
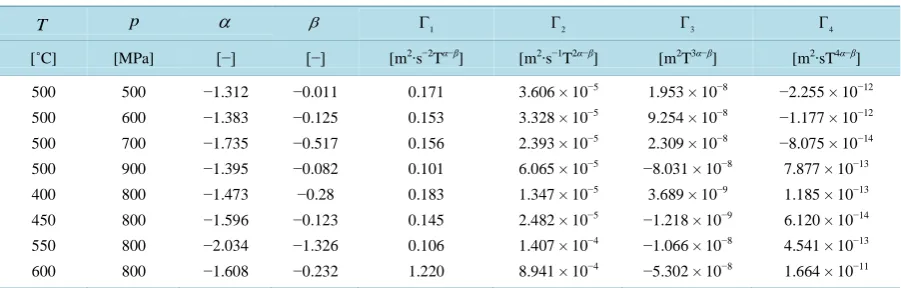
have been estimated for different values of the technological parameters [1] (pressure and temperature). For purpose of this paper we take into account only one family of power loss characteristics which are presented inFigure 1 andFigure 2. The corresponding estimated values of the model parameters are pre-sented in Table 1. For all other details concerning SMC material and measurement data we refer to [1]. Now we are ready to formulate the goals of this paper. Main goal is to minimize the power loss in SMC by using model density of power loss (3) and corresponding values of the model parameters. From the first row ofTable 1, we can see that dimensions of the Γn coefficients depend on the values of the α andβ
exponents. Therefore, theFigure 2. Selection of the power loss characteristics Ptot/(Bm)α vs. f/(Bm)α calculated according to (3) and Table 1 for Soma-loy 500 [1].
Table 1. Somaloy 500. Values of scaling exponents and coefficients of (3) vs. compaction pressure and hardening temperature, a selection from [1].
T p α β Γ1 Γ2 Γ3 Γ4
[˚C] [MPa] [−] [−] [m2∙s−2Tα−β] [m2∙s−1T2α−β] [m2T3α−β] [m2∙sT4α−β]
500 500 500 500 400 450 550 600 500 600 700 900 800 800 800 800 −1.312 −1.383 −1.735 −1.395 −1.473 −1.596 −2.034 −1.608 −0.011 −0.125 −0.517 −0.082 −0.28 −0.123 −1.326 −0.232 0.171 0.153 0.156 0.101 0.183 0.145 0.106 1.220
3.606 × 10⁻⁵ 3.328 × 10⁻⁵ 2.393 × 10⁻⁵ 6.065 × 10⁻⁵ 1.347 × 10⁻⁵ 2.482 × 10⁻⁵ 1.407 × 10⁻⁴ 8.941 × 10⁻⁴
1.953 × 10⁻⁸ 9.254 × 10⁻⁸ 2.309 × 10⁻⁸ −8.031 × 10⁻⁸
3.689 × 10⁻⁹ −1.218 × 10⁻⁹
−1.066 × 10⁻⁸
−5.302 × 10⁻⁸
−2.255 × 10⁻¹²
−1.177 × 10⁻¹²
−8.075 × 10⁻¹⁴
7.877 × 10⁻¹³ 1.185 × 10⁻¹³ 6.120 × 10⁻¹⁴ 4.541 × 10⁻¹³ 1.664 × 10⁻¹¹
power loss characteristics presented in Figure 1 andFigure 2 are different dimensions. So, we have to answer the following question: are we able to relate them in the optimization process which has been described in [1]?
In this paper we will prove that if the considered characteristics obey the scaling, then the binary relation be-tween them is invariant with respect to this transformation and comparison of two magnitudes of different di-mensions has mathematical meaning. Reach measurement data of power losses in Somaloy 500 have been transformed into parameters of (3) vs. hardening temperature and compaction pressure Table 1 in [1]. Information contained in this table enable us to infer about topological structure of set of the power loss characteristics and finally to construct pseudo-state equation for SMC, and derive new algorithm for the best values of technological parameters.
2. Scaling of Binary Relations
Let the power loss characteristic has the form determined by the scaling (2). It is important to remain that α and
β
are defined by initial exponents a, b and c (see after Formula (2)):;
a c
b b
α= β = (4)
Let us concentrate our attention at the point on the f
( )
Bm α axis of Figure 1 andFigure 2:3
1 2 4
1 2 3 4
1 2 3 4
m m m m m
f
f f f
f
[image:3.595.88.539.316.460.2]Let us take into account the two characteristics and let us assume that
tot1 tot2
1 2
1 2
m m
P P
Bβ > Bβ (6)
Therefore, the considered binary relation is the strong inequality and corresponds to natural order presented in
Figure 1 andFigure 2. The most important question of this research is whether (6) is invariant with respect to scaling:
tot1 tot2
1 2
1 2
m m
P P
Bβ Bβ
′ ′
>
′ ′ (7)
Let λ>0 be an arbitrary positive real number. Then, the scaling of (7) goes according to the following al-gorithm:
• Let us perform the scaling with respect to λ of all independent magnitudes and the dependent one:
tot tot
; ;
i i i
a b c
i i mi mi
f′=λ f B′ =λ B P′ =λ P (8) where i=1, 2,, 4 labels the considered characteristics.
• Substituting appropriate relations of (8) to (7) we derive:
1 1 1 2 2 2
tot1 tot2
1 2
1 2
c b c b
m m
P P
B B
β β
β λ − > β λ − (9)
• Collecting all powers of λ on the left-hand side of (9) and taking into account (4) we derive the resulting power to be zero and
1 1 1 2 2 2 1
c bβ c bβ
λ − − + = (10) Therefore (6) is invariant with respect to scaling. This binary relation has mathematical meaning and consti-tutes the total order in the set of characteristics.
3. Binary Equivalence Relation
The result derived in Section 2 can be supplemented with the following binary equivalence relation. Let
, tot , ,
, ,
,
i i
i j i j i j
m i j m i j
f P
X
Bα Bβ
=
(11)
be the j-th point of the i-th characteristic. Two points j and k are related if they belong to the same i- th characteristic:
, ,
i j i k
X RX (12)
Theorem: R is equivalence relation. (The proof is trivial and can be done by checking out that the
consi-dered relation is: reflexive, symmetric and transitive.) Therefore, R constitutes division of the positive-posi-
tive quarter of plane spanned by (11). The characteristics do not intersect each other except in the origin point which is excluded from the space. The result of this section implies that the power loss characteristics (2) and (3) are invariant with respect to scaling. Structure of derived here the set of all characteristics of which some exam-ples are presented in Figure 1 andFigure 2 enables us to derive a formal pseudo-state equation of SMC. This equation constitutes a relation of the hardening temperature, the compaction pressure and a parameter characte-rizing the power loss characteristic corresponding to the values of these technological parameters. Finally, the pseudo-state equation will improve the algorithm for designing the best values of technological parameters.
4. Pseudo-State Equation of SMC
Let be set of all possible power loss characteristics in considered SMC. Each characteristic is smooth curve in f
( )
Bm ,Ptot( )
Bmα β
plane which corresponds to a point in
[
T p,]
plane. In order to derive the pseudo-By this way we obtain a function of two variables:
(
T p,)
→V (13) This function must satisfy the following condition. Let us concentrate our attention at the two following points:1 2
1 2
1 2
;
m m
m m
f f f f
B B
Bα = α Bα = α (14)
Let us consider the two characteristics Ptot1
( )
Bm1 β1 and Ptot2(
Bm2)
2β
of the two samples composed under 1
T , p1 and T2, p2 values of temperature and pressure, respectively.
While, the other technological parameters powder compositions and volume fraction are constant. Let us as-sume that for (14) the following relation holds:
tot1 tot2
1 2
1 2
m m
P P
Bβ > Bβ (15)
It results from the derived structure of that (15) holds for each value of (14).Therefore we have to assume the following condition of sought V
( )
T p
,
: If the relation (15) holds for 1T , p1, T2, p2 then the fol-lowing relation has to be satisfied for V( )
T p
,
:(
1,
1)
(
2,
2)
.
V T p
>
V T p
(16)Moreover, V
( )
T p
,
has to indicate place of corresponding characteristic in the ordered . The simplest choice satisfying these requirements is the following average:(
)
maxmin
tot
max min
1
, m d
m m
f P
B f
V T p
B B
α ϕ
β α
ϕ
ϕ ϕ
=
−
∫
(17)where the integration domain is common for the all characteristics. We have selected the common domain of
Figure 1 andFigure 2: ϕmin=0, ϕmax =4000 [s−1∙T−α]. Using (3) we transform (17) to the working formula for the measure V :
(
)
max(
(
(
)
)
)
min 1 2 3 4
max min
1
, Γ Γ Γ Γ d
V T p ϕ x x x x x
ϕ
ϕ ϕ
= + + +
−
∫
(18)where x= f
( )
Bm α , Γi are coefficients dependent on T and p, see Table 1. The values of V(
T p,)
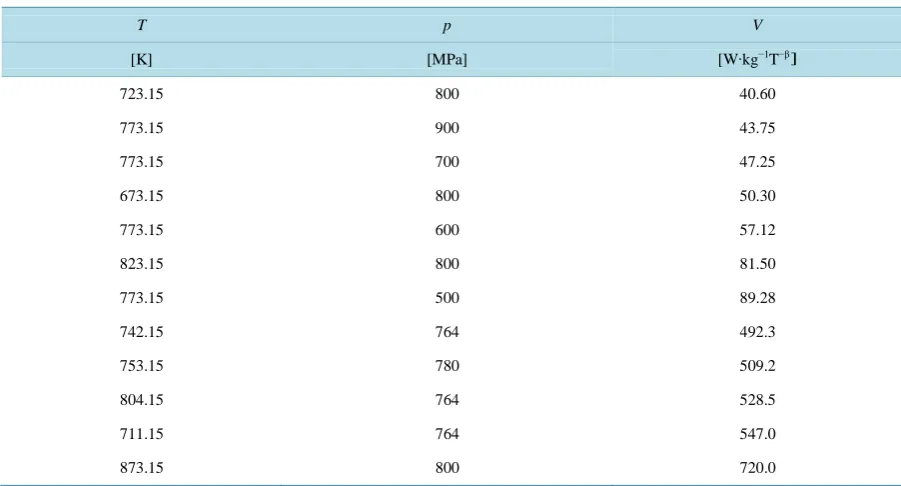
are tabulated inTable 2. Table 2 enables us to draw pseudo-isotherm. It is presented in Figure 3. However, in order to derive the complete pseudo-state equation we must create a mathematical model. On basis of Figure 3 [image:5.595.208.419.542.705.2]we start from the classical gas state-equation as an initial approximation:
Table 2. V measure vs. hardening temperature and compaction pressure.
T p V
[K] [MPa] [W∙kg−1T−β
723.15 800 40.60
773.15 900 43.75
773.15 700 47.25
673.15 800 50.30
773.15 600 57.12
823.15 800 81.50
773.15 500 89.28
742.15 764 492.3
753.15 780 509.2
804.15 764 528.5
711.15 764 547.0
873.15 800 720.0
1
B
p V
k T
⋅ =
⋅ (19)
where kB is pseudo-Boltzmann constant.
In order to extent (19) to a realistic equation we apply again the scaling hypothesis (2) [2]-[4]:
, Φ c
c c c
c
T T
T p p
V
T p p p
p
γ
δ
=
(20)
where
Φ ⋅
( )
is an arbitrary function to be determined. γ, δ and Tc, p c are scaling exponents and scaling parameters respectively, to be determined. For our conveniences we introduce the following variables:; ; c
c c
c
T T
T p
X
T p p
p
δ δ
τ
τ π
π
= = = =
(21)
In order to extent (19) to a full state-equation we apply the Padé approximant by analogy to virial expansion derived by Ree and Hoover [7]:
(
)
(
(
(
)
)
)
(
)
(
)
(
)
0 1 2 3 4
1 2 3 4
,
1
G X G X G X G XG
V
X D X D X D XD
γ
τ π =π + + + +
+ + + + (22)
where G0,,G4, D1,,D4 are parameters of the Padé approximant. All parameters have to be determined from the data presented in Table 2.
5. Estimation of the Pseudo-State Equation’s Parameters
points: [773,15; 500,0] and [742,15; 764,0]. This suggests existence of a crossover between two phases: low- losses phase and high losses phase. We take this effect into account and we divide the data of Table 2into two subsets corresponding to these two phases, respectively. Since the cross over consists in changing of characteris-tic exponents for the given universality class it is necessary to perform estimations of the model parameters for each phase separately. Minimizations of χ2 for both phases have been performed by using MICROSOFT EXCEL 2010, where
(
)
(
)
(
)
(
)
(
)
(
)
2
0 1 2 3 4
2 1
1 2 3 4
( , ) 1
i i i i
N
i i i
i
i i i i
G X G X G X G X G
V
X D X D X D X D
γ
χ = = τ π −π + + + +
+ + + +
∑
(23)where N=7 and N=5 for the low-losses and high-losses phases, respectively. Table 3 and Table 4 present estimated values of the model parameters for the low-losses and for high-losses phases, respectively.
6. Optimization of Technological Parameters
Function V
(
T p,)
serves a power loss measure versus the hardening temperature and compaction pressure. In order to explain how to optimize the technological parameters with the pseudo-state Equation (22) we plot the phase diagram of considered SMC Figure 4. Note that all losses’ characteristics collapsed to a one curve for the eachphase. Taking into account the Low-losses phase we determine the lowest losses at τ π⋅ −δ =19.75. This gives the following continuous subspace of the optimal points:19.75
c
c
T T
p p
δ =
(24)
Formula (24) represents the minimal iso-power loss curve. All points satisfying (24) are solutions of the opti-mization problem for technical parameters of SMC.
7. Conclusion
[image:7.595.88.536.540.610.2]By introducing the binary relations we have revealed twofold. The power loss characteristics do not cross each other which makes the topology’s set of this curves very useful and effective that we can perform all calcula-tions in the one-dimension space spanned by the scaled frequency or here in the case of pseudo-statee quation in the scaled temperature. For general knowledge concerning such a topology we refer to the papers by Egenhofer [8] and by Nedas et al.[9]. However, to our knowledge this paper is the first one about the binary relations be-
Table 3. Somaloy 500, low-losses phase. Values of pseudo-state equation’s parameters and the Padé approximant’s coeffi-cients of (22).
Tc pc G0 G1 G2
0.1715 1.2812 21.622 37.729 370,315,315 −47,752,251 1,734,952
G3 G4 D1 D2 D3 D4 -
−1.3764 −678.26 170.80 6243.8 386.96 −28.699 -
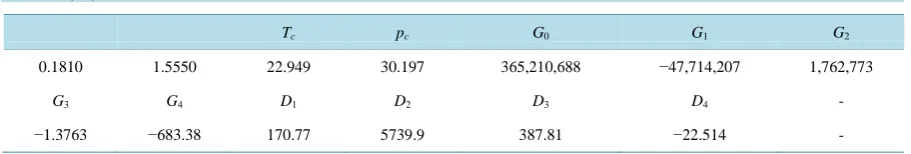
Table 4. Somaloy 500, high-losses phase. Values of pseudo-state equation’s parameters and the Padé approximant’s coeffi-cients of (22).
Tc pc G0 G1 G2
0.1810 1.5550 22.949 30.197 365,210,688 −47,714,207 1,762,773
G3 G4 D1 D2 D3 D4 -
[image:7.595.86.542.639.716.2]Figure 4. Phase diagram for Somaloy 500.
tween magnitudes of different dimensions in the sense of different physical magnitudes. Also, this paper is the first one which presents an application of scaling in designing the technological parameters’ values by using the pseudo-state equation of SMC. The obtained result is the continuous set of points satisfying (24). All solutions of these equations are equivalent for the optimization of the power losses. Therefore, the remaining degree of freedom can be used for optimizing magnetic properties of the considered SMC. Ultimately, one must say that the degree of success achieved when applying the scaling depends on the property of the data. The data must obey the scaling.
Acknowledgements
The work has been supported by National Center of Science within the framework of research project Grant N N507 249940.
References
[1] Ślusarek, B., Jankowski, B., Sokalski, K. and Szczygłowski, J. (2013) Characteristics of Power Loss in Soft Magnetic Composites a Key for Designing the Best Values of Technological Parameters. Journal of Alloys and Compounds, 581, 699-704. http://dx.doi.org/10.1016/j.jallcom.2013.07.084
[2] Sokalski, K., Szczygłowski, J., Najgebauer, M. and Wilczyński, W. (2007) Losses Scaling in Soft Magnetic Materials. COMPEL: The International Journal for Computation and Mathematics in Electrical and Electronic Engineering, 26, 640-649. http://dx.doi.org/10.1108/03321640710751118
[3] Sokalski, K. and Szczygłowski, J. (2009) Formula for Energy Loss in Soft Magnetic Materials and Scaling. Acta Physica Polonica A, 115, 920-924.
[4] Sokalski, K., Szczygłowski, J. and Wilczyński, W. (2013) Scaling Conception of Power Loss’ Separationin Soft Mag-netic Materials. International Journal of Condensed Matter, Advanced Materials, and Superconductivity Research (NOVA), 12, Nr. 4.
[5] Bertotti, G. (1984) A General Statistical Approach to the Problem of Eddy Current Losses. Journal of Magnetism and Magnetic Materials, 41, 253. http://dx.doi.org/10.1016/0304-8853(84)90192-6
[6] Bertotti, G. (1988) General Properties of Power Losses in Soft Ferromagnetic Materials. IEEE Transactions on Mag-netics, 24, 621. http://dx.doi.org/10.1109/20.43994
[7] Ree, F.H. and Hoover, W.G. (1964) Fifth and Sixth Virial Coefficients for Hard Spheres and Hard Disks. The Journal of Chemical Physics, 40, 939. http://dx.doi.org/10.1063/1.1725286
[8] Egenhofer, M. (1989) A Formal Definition of Binary Topological Relationships. In: Litwin, W. and Schek, H.J., Eds., Proceedings of the 3rd International Conference on Foundations of Data Organization and Algorithms (FODO), Paris, France, Lecture Notes in Computer Science, 367,(Springer-Verlag, New York, 1989) 457-472.
![Figure 1. Selection of the power loss characteristics Ptot/(Bm)αvs. f/(Bm)α calculated according to (3) and Table 1 for Soma-loy 500 [1], T = 500˚C](https://thumb-us.123doks.com/thumbv2/123dok_us/8154483.803646/2.595.205.419.523.684/figure-selection-power-characteristics-ptot-calculated-according-table.webp)
![Figure 3. Pseudo-Isotherm T = 500˚C of the Low-losses phase, according to data of Table 2 for Somaloy 500 [1]](https://thumb-us.123doks.com/thumbv2/123dok_us/8154483.803646/5.595.208.419.542.705/figure-pseudo-isotherm-losses-phase-according-table-somaloy.webp)