© 2018, IRJET | Impact Factor value: 6.171 | ISO 9001:2008 Certified Journal | Page 3742
BARCODE GENERATION FOR GROCERY PACKAGING USING
SENSOR TECHNOLOGY
Rutika
1, Nigel M
2, Prerana R
3, Shruti R
4, Dr. Prashant. P. Patavardhan
5, Prof. S. N. Hallur
61,2,3,4 UG Scholars, Dept. of ECE, KLS Gogte Institute of Technology, Belagavi 5 Professor, Dept. of ECE, KLS Gogte Institute of Technology, Belagavi 6 Asst. Prof, Dept. of ECE, KLS Gogte Institute of Technology, Belagavi
---***---Abstract:
Certainly the long queues and the time spent at billing counters is an enormous waste of time. At the grocery section there is a long queue where in the customers need to wait to get the barcodes for the purchased items. At the other end the seller needs to scan the barcode manually or enter the details of the product purchased. There are separate barcodes for each commodity which the seller needs to keep it in mind which becomes almost impossible if the store is a huge one. Thus the Basic objective of this project is to sense the type of grocery and grains, their weight and generate the barcodes according to their prices for different commodities. These barcodes contain the encoded information which gives a unique identity to any product, and provide a security labels. Thus by using sensor technology we can identify the product and generate a barcode containing product name, cost and quantity.Keywords: Sensor,Color, Shape, Arduino, Calibration.
1.
INTRODUCTION1.1.
Objectives:
The Basic objective of this project is to sense the type of grocery and grains, their weight and generate the barcodes according to their prices for different commodities. These barcodes contain the encoded information which gives a unique identity to any product, and provide a security labels. Thus by using sensor technology we can identify the product and generate a barcode containing product name, cost and quantity.
1.2.
Problem in Existing System:
Certainly the long queues and the time spent at billing counters is an enormous waste of time. At the grocery section there is a long queue where in the customers need to wait to get the barcodes for the purchased items. At the other end the seller needs to scan the barcode manually or enter the details of the product purchased. There are separate barcodes for each commodity which the seller needs to keep it in mind which becomes almost impossible if the store is a huge one.
1.3.
Solution to these problems:
An automated and intuitive billing solution makes things easier in such a situation. Having an automated system reduces the human efforts of waiting in a long queue to get the barcode for the purchased items. A sensor technology to identify the product and provide the details such as cost, quantity and product name avoids the customer to not to wait in the queue for long times as barcode containing the complete details is generated within fraction of seconds facilitating fast movement of queues and reduced billing time.
2.
LITERATURE SURVEY© 2018, IRJET | Impact Factor value: 6.171 | ISO 9001:2008 Certified Journal | Page 3743
Year Name Author Features
2017 Automatic bill generation of products using digital signatures
and QR codes.
S. Kalarani Encoding and Decoding techniques are used for encode and decode information from QR code. Real time capturing system for consumer using
quick response code in the android smartphone. 2017 Quality testing and grading of food
grains using digital image processing.
Ms.Sushma Mr. Krishna Kumar. Mr Rajendra kumar.
Image Acquisition.
Image Pre Processing, morphological operation, feed forward propagation, algorithm applied for grading granules.
2017 Identification and quality testing of rice grains using image processing
and neural network.
Mr V.S Kolkure, Ms B.N Shaikh.
The quality of rice is determined with the help of geometry features.
Image processing is applied to extract various features of grains and classify the grains based on morphological features.
2016 Smart shopping using QR code. P.Satish Kumar, A.Selva Ganesh,
Mr. Ramesh Kumar
Encoding and Decoding algorithm for recognition of QR code images using smartphones and various services.
2016 Grain counting method based on
image processing. Ping Zhao, Yog Kui Li
Weighing of grains to determine the quantity of the grains using techniques of image processing. Each processed image of each grain is counted as
one and thus the count goes on. 2011 A Sensor Node Prototype for
Real-Time Rice Whiteness Measurement.
Phoori Chantima, Pattarawit Polpinit, Chatchai Khunboa
Determining the whiteness of rice using color sensor.
Disadvantage is that, if the color sensor is damaged, the whole implementation is down. Multiple iterations are necessary to determine
whiteness of rice. 2009 Determination of the Varieties and
Characteristics of Wheat Seeds Grown Using Image Processing.
Ece Olcay Güneş, Sercan Aygün, Mürvet Kırcı, Amir Kalateh, Yüksel Çakır
Method has been proposed for classification of wheat varieties grown.
The determination of the characteristics of the wheat seeds are also done to determine the quality of the seeds. This is done to check whether the seeds are suitable for sowing or not. 2009 Barcodes in Document Imaging Larry Krummel The documents needed to keep a record are
initially scanned and are encrypted.
The encrypted document is then scanned and is assigned with a barcode that is generated for each of them.
Advantage is that, the authentication and recognition of the scanned document becomes easy but demerit is that scanning each document and generating barcode for each of them is cumbersome.
2011 Strength of Quick Response Barcodes and Design of Secure Data Sharing System
Sona Kaushik This model aims to enable secure data share over the network by scanning QR/Barcodes.
This model is a layered architecture and protects the data by transforming the structure of content. So barcodes are used to put tricks over the information rather than directly using it for its noble functionality
2015 Biometric Based Unique ID Generation and One to One Verification for Security Documents
Sajan Ambadiyil, K.S.Soorej, V.P. MahadevanPillai
A method for creating a unique ID based on the core point of the fingerprint of an individual. The minutia features of the fingerprint are
extracted with the core point as the reference. The numerical value thus generated is used to
© 2018, IRJET | Impact Factor value: 6.171 | ISO 9001:2008 Certified Journal | Page 3744
3.
BLOCK DIAGRAMFig 1. Block Diagram
Initially the grocery items are kept on the load cell. The load cell detects the weight based in the calibration made and sends the data to the Aurdino controller and also displays the same on the LCD. Based on the color perception of the grocery item kept on the load sensor, the item is detected and is displayed on the LCD display and simultaneously sent to the controller for further processing. The Aurdino processor is programmed with an embedded language which processes all the information received from the load cell and the color sensor. The barcode is generated within the arduino board and is printed via a thermal printer. This barcode generated is attached to the commodity so that it can be easily scanned to retrieve the details.
4.
WORKING4.1.Voltage Regulation Circuit
Voltage Step Down:
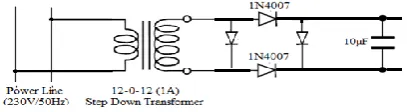
One method is a 12-0-12 1A Transformer can be used for stepping down the voltage directly from 230V/50Hz to about 12V/50Hz. The current rating of the transformer used here is about 1A which is sufficient for the electronic devices connected. The stepped down output is in the AC form which is converted to DC using a Bridge wave rectifier as discussed below. Conversion of AC to DC is known as Rectification. The connections for the transformer is as shown in the figure 2.
Fig 2. Voltage Step Down using a 12-0-12 Transformer
Bridge Wave Rectifier:
A Bridge wave rectifier can be used wherein one half cycle is converted by 2 diodes and for the rest half cycle, other 2 diodes conduct to convert the input from AC to DC. The design is as shown below for a Bridge wave rectifier.
[image:3.595.340.544.345.401.2]The stepped down output is then being given to the diodes which are then being connected in the form of the Bridge Wave Rectifier. The diodes used are 1N4007 which can withstand up-to 1000V as a peak voltage. Then a Bridge Wave Rectifier (BWR) needs to be designed as the input works only on DC Voltage. The rectifier is a device that converts the AC to DC. Thus a diode needs to be used. The Bridge wave rectifier is as shown in the fig 2 below.
Fig 3. Bridge Wave Rectifier.
A filter capacitor is added to remove the ripples present in the stepped down output. Also the same capacitor is used for maintaining the voltage. The DC Voltage is always RMS and so the DC voltage in the circuit is
VRMS = VIN. * 1.41
Thus 10µF/450V capacitor is used. The design of the capacitor is shown below.
Capacitor Design:
Input from the AC line power source = 230V/50Hz Stepping down from 230V to 12V causes only voltage to change but the frequency remains the same. So the frequency remains 50Hz.
Time Period of a wave is the reciprocal of frequency i.e. T = 1/f
Given f = 50Hz T = 1/50Hz
Now By Formula we have,
C = (I x T) / ΔV Where, C = Capacitor Value
I = Current Rating of Transformer T = Time Period
© 2018, IRJET | Impact Factor value: 6.171 | ISO 9001:2008 Certified Journal | Page 3745
ΔV = Difference in Voltage or ToleranceC = (1 Ampere x 0.02) / ((12 – 10) x 1000)
Using a 7805 Regulator
The main reason is to use 7805 regulator is that it steps down the voltage and gives a stable output as needed for the electronic components to be used further.
[image:4.595.352.523.89.200.2]A 7805 regulator is a 3 terminal device which is capable of stabilizing the voltage not to exceed more than 5V. The connections of a 3 terminal include input, ground and then output. The voltage exceeding 5V is dropped and grounded and only a stabilized 5V is given as the output. The circuit for the 7805 connections may be as shown in the figure 4 below.
Fig 4. Voltage Regulation using a 7805 Regulator
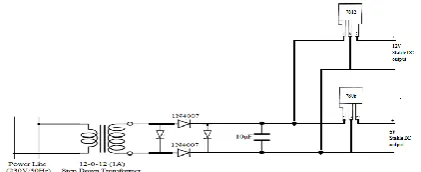
Using a 7812 Regulator
7812 regulator is very much necessary for triggering a Relay circuit which always works on 12V input. A 7812 regulator is a 3 terminal device which is capable of stabilizing the voltage not to exceed more than 12V. The connections of a 3 terminal include input, ground and then output. The voltage exceeding 5V is dropped and grounded and only a stabilized 5V is given as the output. The circuit for the 7812 along with 7805 connections may be as shown in the figure 5 below.
Fig 5. Voltage Regulation using a 7812 Regulator
[image:4.595.55.262.313.371.2]The Hardware implementation of the Voltage Regulation Circuit is as shown in the figure 6.
Fig 6. Voltage Regulation Circuit
[image:4.595.53.264.574.660.2]4.2.Connection to Color Detection Sensor
Fig 7. Connections to TCS3200 Color sensor
The TCS3200 is a programmable color light-to-frequency converter that combine configurable silicon photodiodes and a current-to-frequency converter on a single monolithic CMOS integrated circuit. The output is a square wave (50% duty cycle) with frequency directly proportional to light intensity. In the TCS3200, the light-to-frequency converter reads an 8 x 8 array of photodiodes. Sixteen photodiodes have blue filters, 16 photodiodes have green filters, 16 photodiodes have red filters, and 16 photodiodes are clear with no filters. The 5V stable output from the 7805 regulator is given to VCC of the TCS3200. The selection lines S0, S1 are selection lines used for the purpose of output scaling and S2, S3 are the selection lines used to select the photodiode type.
4.3. Overall Connections and Circuit Diagram:
Circuit Diagram
Fig 8. Complete Circuit Diagram
(1sec = 1000ms)
[image:4.595.323.542.591.734.2]© 2018, IRJET | Impact Factor value: 6.171 | ISO 9001:2008 Certified Journal | Page 3746
Fig 8 above depicts the complete diagram of theproject. Initially a stabilized voltage of 5V is obtained from the voltage regulator and is given to the color detection sensor. The color detection sensor is configured with the detection of all the 3 colors including Red, Blue and Green in proportional amount. This proportional mixture of colors to detect the grocery type is done by selecting the photodiode type via the input selection lines S2 and S3. The detected color has to be converted into proportional frequency using the selection lines S0 and S1. The frequency scaling can be selected in 4 modes as Power down, 2%, 20% and 100%. The output of the color sensor in the frequency form is then taken from the OUT pin and is given to the Analog inputs of the Arduino board.
The Arduino board is programmed with its compatible language. The frequency obtained from the color sensor output is given to one of the analog inputs of the board. The board is programmed for the Analog to Digital conversion wherein the analog frequency received is converted into digital form for the further processing purpose. Based on the frequency samples received in the digital domain, the readings are compared with the readings set for each color. Based on the mapping and matching, a particular grocery is identified and displayed on the LCD display. The 16*2 LCD display is interfaced to the data output pins of the Arduino board via which the data is sent parallelly to the LCD. Simultaneously, the load cell is interfaced along with the signal amplifier circuit and is inturn connected to one more analog input of the Arduino board. The detected weight is converted to frequency and is correspondingly amplified due to the weak frequency and power of the signal. The analog signal received by the Arduino board is again converted into digital signal and is sent for further processing.
Calibration
The calibration for the frequency reading obtained from the light to frequency converter is done in the Arduino board. Along with that the commodity weight that is sensed by the load cell is amplified by an amplifying interface and is then given to the Arduino board. This Arduino board is calibrated at a ratio of 1:50 such that if 1 gram is the weight detected by the load cell, it is actually 50 grams that is being calculated by the Arduino.
Price Fixation
The price of the particular commodity is fixed an amount using the language and is embedded into the board. This price is fixed based on the weights of the different commodities.
Total Price of the Commodity
The weights detected of the different commodities by the load cell are amplified using the amplifier interface and are fed into the controller where the readings are calibrated accordingly. The color sensor detects the different commodities based on the color, converts into frequencies and are given to the microcontroller. The equation for the total price of the commodity is as follows:
Total price = Commodity * Calibrated Weight
Generation of the Barcode
Based on the total price of the commodity, the barcode is generated which includes the actual encoded information of the commodity and its weight along with it price. This generated barcode is printed on a paper so as to be attached.
Printing of the Barcode
The generated barcode is printed using a thermal printer. Since the thermal printer needs to be heated to print the barcode, it is kept for heating purpose. The printed barcode is then attached to the commodity.
5.
ResultsThe proposed system identifies the grains, which is based on appearance features such as the shape and color, with sensing technology. An efficient method is proposed for classification of food grains which require limited features and thus overcoming the disadvantages like tediousness and time.
© 2018, IRJET | Impact Factor value: 6.171 | ISO 9001:2008 Certified Journal | Page 3747
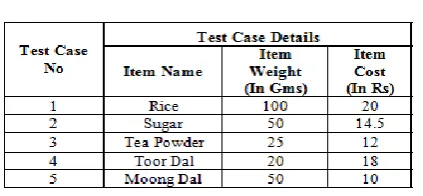
Table 1: Actual Test Case ConditionsTable 2. Results obtained for test cases
In the above table the detected weight of the grocery items and their prices are approximately equal to the actual weight and the cost. The table below shows error occurred in the detection.
Table 3. Error in detection of weight.
Table 4. Error in Cost Estimation
Figure 9(a) below shows graph of the error in detection of weight and Figure 9(b) shows the graph of the percentage of error in detection of the weight.
Fig 9(a) % Error in detection of weight
Fig 9(b) % Error in detection of weight
In point-of-sale management, barcode systems can provide detailed up-to-date information on the business, accelerating decisions and with more confidence. Fast-selling items can be identified quickly and automatically reordered.
6.
Merits and Demerits 6.1. MeritsThe implemented application has the following merits:
Saves labor by avoiding manual inputting system.
Error reduction.
Automatic barcode generation.
Effective management of resources.
Faster response time.
Meets the user requirements.
Flexible.
Reduced workload.
Unique identity of product.
6.2. Demerits
The implemented application has the following merits:
System failure may cause more delays.
Scratched or crumpled barcodes may cause problems.
Leads to unemployment.
7.
Conclusion and Future Scope 7.1. Conclusion [image:6.595.38.245.238.324.2]© 2018, IRJET | Impact Factor value: 6.171 | ISO 9001:2008 Certified Journal | Page 3748
7.2. Future ScopeThe implemented system can not only be used here, while there are other scopes of where a similar kind of systems be implemented. Some of the few applications include:
Aerodromes – Where customer’s luggage can be weighed and can be identified, such that in case of theft or misplacing can be found easily by scanning the barcode.
Quality Testing of Grocery: Quality testing of the grains can be made by inclusion of image processing.
References:
[1] “Automatic bill generation of products using digital signatures and QR codes”. S. KALARANI ,2017. [2] “Quality testing and grading of food grains using
digital image processing”. Ms.Sushma, Mr. Krishna kumar, Mr Rajendra kumar. 2016.
[3] “Identification and quality testing of rice grains using image processing and neural network”. Mr V.S Kolkure ,Ms B.N Shaikh.2017.
[4] “Smart shopping using QR code”, P.Satish Kumar A. Selva Ganesh, M. Ramesh kumar, 2017.
[5] “Grain counting method based on image processing” Ping Zhao Yog kui li, 2009.
[6] L. Guang-rong, ”Rice color inspection based on image processing technique,” International Conference on Advances in Energy Engineering, pp. 134137,2010. [7] P. Praisuwanna, S. Sriprasan, ”Digital measurement
of percentage of rice grains whiteness,” KKU engineering Journal, vol. 31, no.2, pp.107121, Apr. 2004.
[8] R. Jain, The art of computer systems performance analysis: techniques for experimental design, measurement, simulation, and modeling, Wiley- Interscience, New York, NY, April 1991.
[9] S. Kawamura, M. Natsuga, K. Takekura, ”Development of an automatic rice-quality inspection system,” Computers and Electronics in Agriculture, vol. 40, pp. 115-126, 2003.