http://dx.doi.org/10.4236/jpee.2015.35002
Harmonic Contributions of Utility and
Customer Based on Load Model Using Field
Measurements
Ömer Gül, Tayfun Gündoğdu
Department of Electrical Engineering, Istanbul Technical University, Istanbul, Turkey Email: [email protected], [email protected]
Received 19 March 2015; accepted 29 April 2015; published 5 May 2015
Copyright © 2015 by authors and Scientific Research Publishing Inc.
This work is licensed under the Creative Commons Attribution International License (CC BY).
http://creativecommons.org/licenses/by/4.0/
Abstract
In recent years, sinusoidal waveform of the current and voltage disturbs in the electrical distribu-tion system because of the due to the increasing number of non-linear loads. Many standards of IEC and IEEE standards have been published in order to limit the voltage and current waveform distortion. The operators of the electricity distribution network widely use the power quality monitoring systems at the point of common connection (PCC). It has been identified that there are substantial number of harmonic currents excess of the standards transferred to the grid according to the data obtained from power quality monitoring systems. In case of exceeding the limits speci-fied in the standards, there is a need to determine the network and customer responsibilities for the implementation of required sanctions. In this study, using recorded data at the PCC of a me-dium voltage electrical distribution system, voltage and current harmonic distortion responsibili-ties of the network and customer are determined by the improved harmonic current vector me-thod. Up-to-date load model based on field measurement which provides more accurate results has been used instead of the constant load impedance in the proposed method.
Keywords
Harmonic Contributions, Harmonic Distortion Load Model, Norton Equivalent
1. Introduction
the network causes the network’s voltage to become harmonic as a result of the harmonic voltage drop at the network impedance. In this case, even if the linear load is connected to the network, harmonic currents will con-tinue to flow reference measurement point [1]. To avoid an increase in waveform distortion of the electricity distribution network, some harmonic currents restrictions have been imposed on the production stage of the electrical devices according to standards.
In case of to be exceeded of the limit values which are determined by the standards, it is required to take pre-cautions in order to reduce the waveform distortion. Some responsibilities in the distortion of the waveform should be determined to realize who is responsible for this distortion. The source side of the PCC is under the network responsibility while the load side of the PCC is under the customer responsibility. Therefore, the field measurements are of great importance for determining the responsibilities of the customer or/and the network. In the case of the determination of responsibilities, it will be able to punish to customer and/or the network accord-ing to their responsibility rate at the PCC.
The harmonic analysis studies of three-phase power distribution networks, modeling of loads [2]-[8], and the identification of customer contributions [9] are still up-to-date. Efforts to seek solutions for harmonics injected by the nonlinear load and under the condition of the load is not fully specified have begun a few decades ago [10]. A virtual instrument dedicated for the analysis of power signals, in order to determine the existence and characteristics of harmonic distortion is proposed. The processing algorithm are based on estimate harmonic emission level and obtain the real-time estimates of regression coefficients, and then calculate the level of the harmonic impedance and emission estimates in real time [11].
In a study using the value of the reference impedance, changes in the harmonic sources are included by con-verting the impedance changes into equivalent current sources [9]. The method of harmonic current vector, which shows the network and customer as their Norton equivalent, seems to be theoretically correct [10]. Har-monics caused by the customer and network are calculated by using this method. The most important shortcom-ing of this method is that it requires knowledge of customer and consumer impedances. The load impedance va-ries quite a lot according to the network impedance. Therefore, it is not clear how to use reference impedance approach for the loads [10]. One other study clarifies the harmonic current vector method to determine the ref-erence impedance. By selection of load resistance as refref-erence impedance calculations are not affected under the resonance situation [12]. Reactive power flow direction at PCC has been based on by another study [14]. Many methods have been applied in order to keep the harmonic distributions within certain limits between the client and distribution network. Since the measurements taken from different points in a network at the same time is quite difficult and expensive [14]-[18], to be able to perform the measurements at the PCC more practical ap-proaches should be developed [19]. Despite using various measurement methods in the determination of the to-tal harmonic distribution at the PCC, none of them is practical. Power flow direction method, which is a well-known method [20], has been considered as not a feasible method in the determination of the harmonic source [21]. Several different electrical quantities have been discussed as a criterion for harmonic cost distortion, however, only estimated harmonic cost distortion could be calculated [22].
Harmonic Current Method, which is modeled by Norton equivalent circuit of the customer and the network for a specific harmonic degree, is considered theoretically correct, although it shows some practical shortcom-ings [12]. This method does not take into account any resonance condition; it just requires knowledge of im-pedance of the customer and the network at any harmonic degree. Reference imim-pedance methods were found in order to determine the customer and the network impedances, but the studies are still continuing [12].
While the load impedance is constantly changing, to use the reference impedance method which assumes the load impedance as constant does not provide sufficiently accurate results. Because, switching positions of the filter and compensation capacitors can cause very large changes in the load impedance. Instead of the reference impedance method, use of harmonic current method with the approach to updating the load impedances online by using the field measurements will provide more accurate results. Furthermore, switching positions of the fil-ters and capacitors have been already taken in to account in the proposed algorithm by means of the long-term measurements at the PCC.
This study proposes a new method, which is based on measurement of current and voltage at the PCC, in or-der to determine the responsibilities of the network and costumer. Moreover, it is provided that the current vec-tor method has been improvement by using constantly changing impedance. In the proposed method, up-to-date load model based on field measurement has been used instead of the constant load impedance.
MATLAB by processing of the measurements. After the processing of the data collected from the PCC for a long-time period, the responsibility of the customer and the network at the PCC and current and voltage THD values have been obtained.
2. Harmonic Vector Method with Reference Impedance
Impedance of the customer and the network are of great importance in determining the compliance of the har-monic standards. The contract between the customer and the network is determined by value of the reference impedance [15]. Usually, the reference impedance value is not exactly equal to the actual value of the imped-ance. These reference impedance values are taken as basis in determining whether the customer violates or not the harmonic limits.
Harmonic Vector Method is the representation of the circuit of the customer and network sides with Theve-nin/Norton equivalent circuits. Harmonic current or voltage at the PCC are separated into two components (cus-tomer and network) in order to identify the individual harmonic distribution. The equivalent circuit is composed as h order harmonic current or voltage source for both customer and network circuits.
Although, characteristics of the customer impedance and especially frequency are known rarely, the imped-ance of the network side is usually particular. Active harmonic impedimped-ance of the customer side is very difficult to determine due to the constantly changing characteristics of the customer side. Therefore, equivalent imped-ances are determined as reference impedance. The main idea is to describe either the customer or the network side impedances as a reference to an additional source of harmonic. In general, resistive component of the cus-tomer side is determined as cuscus-tomer reference impedance. This situation depends on the distribution of the cur-rent or voltage harmonics [23].
3. Harmonic Voltage Contributions
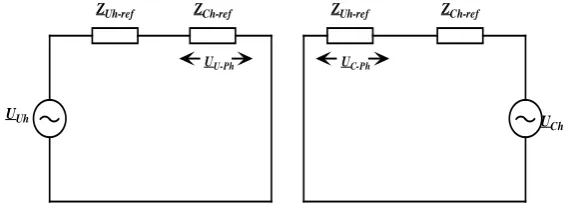
To determine the contribution of the harmonic voltage, the Thevenin equivalent circuit shown in Figure 1is used. This equivalent circuit consists of network
( )
UUh and customer( )
UCh voltage source, and network(
ZUh−ref)
and customer(
ZCh−ref)
reference impedance which include h order harmonic.As can be seen in Figure 2where RCls is the customer reference impedance, an additional reactance voltage drop is converted to a harmonic source. Customer reference impedance is modeled by a resistor and reactance which are connected in series as seen in Figure 2.
1 1
ref 2
1 1
cos
P P
Ch Cls
P P
U P Z R
I I
φ
∗ −
⋅
= = = (1)
Ch Ph Ph Cls
U =U −I ⋅R (2)
ref
Uh Ph Ph Uh
U =U +I ⋅Z − (3)
The customer reference impedance is calculated as Equation (1) using the active power P measured at con-nection point and current at the fundamental frequency IP1. Where, φP1 is the phase angle between the current
UUh UCh
UPh
ZUh-ref ZCh-ref
PCC
IPh
and voltage at the fundamental frequency. Customer harmonic voltage
( )
UCh and network harmonic voltage( )
UUh are obtained from the Equations (2) and (3) according toFigure3.Generally, customers are connected to the network via transformer. So, reference impedance of the network is determined as the sum of the impedance of the last transformer before connected to the customer and the short-circuit impedance of the network. This impedance composes the basic part of the network impedance and value of this impedance can be found easily. However, networks should provide an impedance close to the cur-rent impedance and should avoid from the unnecessary impedances which cause the harmonic distortion.
Additives to voltage value at the customer and network connection point are given Equations (4) and (5) ap-plying the superposition principle as shown inFigure3.
ref
Cls
U Ph Uh
Uh Cls
R
U U
Z R
−
−
= ⋅
+ (4)
ref
ref
Uh
C Ph Ch
Uh Cls
Z
U U
Z R
− −
−
= ⋅
+ (5)
Harmonic voltage phasor measured at the connection point
( )
UPh , is the vectoral summation of the harmonic voltage contributions of the customer and network. Taking account the projection of contribution of the network voltage(
UU Ph−)
and customer voltage(
UC Ph−)
to the measured voltage of the connection point(
UPh)
, sca-lar network voltage harmonic contribution(
UUhs)
and customer scalar harmonic contribution(
UChs)
are cal-culated as Equations (6) and (7).(
)
cos
Uhs U Ph U Ph Ph
U =U − ⋅
δ
− −δ
(6)(
)
cos
Chs C Ph C Ph Ph
U =U − ⋅
δ
− −δ
(7)where, δU Ph− is angle between contribution of the network harmonic voltage and connection point voltage, and C Ph
[image:4.595.160.472.459.565.2]δ − is the angle between contribution of the customer harmonic voltage and connection point voltage. Total harmonic voltage of the connection point is equal to sum of the scalar harmonic components of the network and the customer. This scalar quantities can be positive or negative values, and thus current can increase or decrease at the PCC.
Figure 2. Conversion of reactance voltage drop to an additional source.
UUh U
Ch
ZUh-ref ZCh-ref ZUh-ref ZCh-ref
UU-Ph UC-Ph
Figure 3. Implementation of superposition principle for the detection of customer and network voltage harmonics.
PCC
UPh
RCls XChs
UPh
IPh IPh
PCC
UCh
UCh*
UCh
[image:4.595.170.458.593.695.2]4. Harmonic Current Contributions
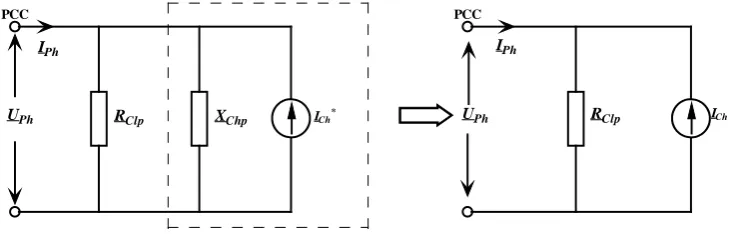
Resonance between the load and the network status is a common occurrence. Limits defined in the standards are usually exceeded due to the increasing harmonic distortion in case of resonance. Responsibilities should be de-termined in order to put leverage on the customer and network sides when the limits are exceeded. Norton equivalent circuit in which network and customer reference impedances are used shown in Figure 4. Where
Uh
I and ZUh−ref indicate the network harmonic current and reference impedance at the h. harmonic order, re-spectively, and ICh and ZCh−ref indicate the customer harmonic current and reference impedance at the h. har-monic order, respectively.
Reference impedance calculation is quite difficult due to the continuously changing state of the load. Refer-ence impedances may be determined due to the measured values at the referRefer-ence connection point (PCC) ac-cording to the general impressions among the researchers. Reference impedance of the network is the sum of the short-circuit impedances and the impedance of the first transformer before the customer connection point. Resis-tive part of the load impedance of the customer
( )
RClp may be found by the measurements at the connection point. Customer impedance can be expressed by a resistance and an impedance parallely connected while deal-ing with the calculations of the harmonic current contributions.Customer impedance can be calculated as in Equation (8) by using the active power
( )
P and basic compo-nent of the voltage( )
UP1 in absence of customer side of active load production.2
1 1
ref
1 cos 1
P P
Ch Clp
P P
U U
Z R
P I φ
− = = = ⋅ (8)
In the Equation (8), is the angle between measured current and voltage at the fundamental frequency, and
1
P
U and IP1 are the voltage and current magnitudes are the fundamental frequency. Customer and network harmonic currents are obtained by Equations (9) and (10) according toFigure 5.
Ph
Ch Ph
Clp U
I I
R
= − (9)
ref
Ph
Uh Ph
Uh U
I I
Z −
[image:5.595.198.459.388.559.2]= + (10)
Figure 4. Norton equivalent circuit for the analysis of harmonic current in a specific-grade.
PCC
UPh RClp XChp ICh* UPh RClp
IPh IPh
ICh PCC
Figure 5. Transformation of the reactance current to an additional harmonic current source.
IUh UPh ICh
IPh PCC
ZUh-ref Z
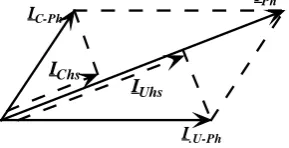
[image:5.595.130.498.588.705.2]Harmonic current contributions of the network and customer to the IPh connection point are determined by principle of Superposition. Customer and network harmonic current contributions are determined by using Equ-ations (11) and (12) according toFigure6.
ref
ref
Uh
U Ph Uh
Uh Clp
Z
I I
Z R
− −
−
= ⋅
+ (11)
ref
Ph
Uh Ph
Uh U
I I
Z −
= + (12)
Total Harmonic current
( )
IPh at the connection point can be separated into two scalar components as seen inFigure7.Scalar harmonic contributions of the Customer and Network are calculated as in Equations (13) and (14) by using harmonic currents of customer
(
IC Ph−)
and network(
IU Ph−)
using the projection of these currents to total harmonic current( )
IPh .(
)
cos
Uhs U Ph U Ph Ph
I = I − ⋅
φ
− −φ
(13)(
)
cos
Chs C Ph C Ph Ph
I = I − ⋅
φ
− −φ
(14)where, φU Ph− is the phase angle between the IU Ph− and IPh, and φC Ph− is the phase angle between the IC Ph− and IPh. As seen inFigure 7, IPh is equal to sum of the scalar harmonic current of the network
( )
IUhs and customer( )
IChs . If there any negative signed component in the summation, it compensates a specific-grade positive signed component and reduces the amplitude of related harmonic.5. Load Model Using Field Measurements
[image:6.595.151.482.502.584.2]A distribution system comprises a number of loads conveniently supplied by circuits from the nearest distribu-tion point. The distribudistribu-tion circuits’ configuradistribu-tion depends on the particular load requirements. A considerable number of loads (linear or nonlinear) are located so close together and supplied from the main distribution point, that they can be considered as whole. The aggregate form of various individual loads called general loads. Resi-dential and commercial buildings can be called as general loads since they have a number of linear and nonli-near load combinations rated at low power values. Owing to the fact that some of the loads in buildings switch on and switch off continuously, the buildings as a general load have varying characteristics and mostly operate unbalanced. Moreover, due to harmonic currents drawn by nonlinear loads, the waveform of voltage in the
[image:6.595.241.386.620.694.2]Figure 6.Determination of harmonic current contributions by principle of Superposition.
Figure 7. Harmonic current contributions of the customer and network to the harmonic current of the connection point.
IUh ZUh-ref RClp R ICh
Clp ZUh-ref
I.U-Ph IC-Ph
IC-Ph
IUhs IChs
IPh
buildings becomes distorted. It is therefore that the buildings are very sophisticated loads in terms of modeling. Consequently, using the measured voltage and current data to model these types of loads can be an alternative solution.
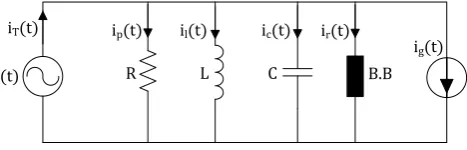
The generalized time domain load model is based on actual recorded data and is an extension of the ideas proposed in [24]. The total load current
(
iT( )
t)
is split into components that are orthogonal to the voltage. That part of the total current that corresponds to uncommon harmonics with the voltage is called the generated component( )
ig [18]. The current( )
ip is the component in phase with the source voltage and is modeled as the current through a resistor. The quadrature component of the current( )
iq given in (15) is split up into an inductive reactive component( )
il , a capacitive reactive component( )
ic , and a residual component( )
ir . The component( )
ig exists only when there are uncommon harmonics between the load voltage and the current. The residual component i tr( )
exists when complete extraction of orthogonal components cannot be done. This component is orthogonal to the voltage and is shown in Figure8 as the current flowing through a “Black Box”. For load modeling applications however, this “Black Box” may be replaced by a current source of appropriate magnitude and phase angle at each common harmonic frequency or as an equivalent impedance at each har-monic frequency.( )
( )
( )
( )
( ) ( ) ( )
q T g p c l r
i t =i t −i t −i t =i t +i t +i t (15)
Given the measured voltage v t
( )
and current iT( )
t as( )
(
)
( )
(
)
1
1
2 cos ,
2 cos .
N
n n
n M
T n n
n
v t V n t
i t I n t
ω α ω β = = = + = +
∑
∑
(16)where N and M are the number of harmonics in the voltage and current respectively. Vn and In represent the RMS values of the nth harmonic voltage and current respectively. αn and βn represent the phase angles of the nth harmonic voltage and current respectively. The load parameters R, L, and C are calculated based on the voltage V t
( )
and current i t( )
as follows:( )
( )
( ) ( )
( )
(
)
( ) ( )
( )
( )
( )
2 2 0 0 20 0 0
d
1 1
d d
d , ,
1 1 1 d
d d d
d
T T
T T
T
v t
w t t i t t
v t T T t
R L C
v t
v t i t t i t w t t t
T T T t
⋅ = = = ⋅ ⋅
∫
∫
∫
∫
∫
(17)where T denotes the period, w t
( )
is defined as the alternating part of( )
0
d T
v t t
∫
. In the calculation of the required costumer parameters, mentioned load model has been used. And the calculated parameters are given in Section 5.6. Proposed Harmonic Contribution Method
[image:7.595.198.432.633.708.2]In order to determine the responsibilities of the network and costumer, real impedance value of the customer which is calculated by measuring current and voltage at the PCC has been used in proposed model instead of the constant load impedance. To be able to use the proposed method, equivalent model of the grid system should be
Figure 8. General equivalent network and current components.
v(t)
iT(t) ip(t) il(t) ic(t) ir(t)
ig(t) B.B
prepared after the measurements at the PCC. After the establishment of Norton and Thevenin equivalent, con-tributions at the PCC can be found precisely.
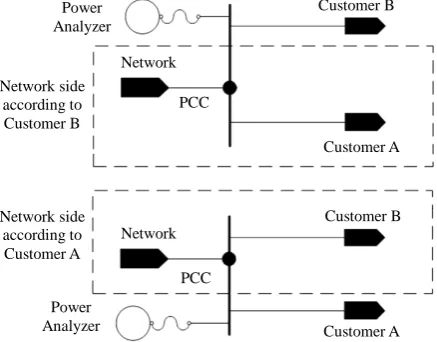
In this study, superposition method is applied to the equivalent circuit of this grid system by using MATLAB after modeling of a real grid system. Norton equivalent circuit is used for harmonic current contributions while Thevenin equivalent circuit is used for harmonic voltage contributions. It is very important to determine the network and customer sides in a real grid system. Actually, there are lots of customers connected in parallel to each other on a real grid system. In Figure 9 it shown that from where the field measurements should be per-formed in the case of there are multiple customer on the system.
MATLAB program has been prepared to calculate the fundamental, 5th, 7th, 11th, 13th and 17th harmonic levels of the current and voltage of customer and network sides, individually. Harmonics that are the 3th and multiples of three and that are not found on symmetrical and balanced systems are not taken into account. The circuit, whose field measurements are performed, has been modelled as given inFigure 10.
Decomposition of the network and customer current and the voltage are done at the PCC by using Figure11 and Figure12. In order to determine percentage of the contributions of the network and customer currents at the PCC, Equation (18) is used. Ir
( )
t and Ig( )
t are modeled as a single current source( )
IC , and RLC are modeled as a single impedance( )
ZC at the customer side of the grid model as shown inFigure11and Figure 12. Load impedance has been updated with repeated measurements.pcc pcc
pcc pcc
pcc pcc
, ,
, .
u c
u c
u c
u u c c
c u c u
V V
I I I I
Z Z
Z Z
I I I I
Z Z Z Z
= + = −
= =
+ +
(18)
where, Iupcc indicates the contribution of the PCC current to the network current and Icpcc indicates the con-tribution of the PCC current to the customer current. Iu and Ic indicate the modelled currents of the network
Customer B
Customer A
Customer A Customer B
PCC PCC Network
Network Power
Analyzer
Power Analyzer Network side
according to Customer B
[image:8.595.205.424.401.572.2]Network side according to Customer A
Figure 9.View of the PCC and determination of the grid according to cus-tomers.
v(t)
iT(t) ip(t) il(t) ic(t) ir(t)
ig(t) B.B
R L C
Grid Impedance
[image:8.595.173.455.607.710.2]Transformer Impedance
and customer, respectively. The accuracy of the calculated network and customer currents can be proven with the condition of being equal to each other of the result of Equation (19) and measured value of the PCC current [9]
[14].
(
)
pcc upcc cpcc
I =I + −I (19)
In order to realize the contribution of the network and customer voltages to the voltage of PCC in what rate Equation (20) is used.
pcc , pcc
u c u c
u u c c
u c u c
Z Z Z Z
V I V I
Z Z Z Z
∗ ∗
= =
+ + (20)
where, Vupcc indicates the contribution of the PCC current to the network voltage and Vcpcc indicates the con-tribution of the PCC current to the customer voltage. The accuracy of the calculated network and customer vol-tages can be proven with the condition of being equal to each other of the result of Equation (21) and measured value of the PCC voltage [9] [13].
pcc upcc cpcc
V =V +V (21)
7. Results of the Proposed Method with Field Measurements
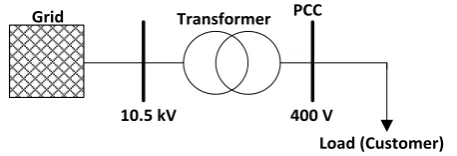
[image:9.595.178.451.381.462.2]One-line diagram of the test system where the measurements were recorded with permission of the Bosporus Electricity Distribution company (BEDAŞ) is shown in Figure 13. As seen in one-line diagram of the test sys-tem, there is only one customer connected to the network. Analyzed energy system given in Figure 13 has (2.5 + 12i) mΩ grid impedance and (42.5 + 108.75i) mΩ transformer impedance per phase.
Figure 11.Modelled Norton equivalent circuit for the determination of currents on the PCC.
Zu Zc Zu Zc
Vc Vu
[image:9.595.199.428.628.706.2]Vu_pcc Vc_pcc
Figure 12. Modelled Thevenin equivalent circuit for the determination of voltages on the PCC.
Grid PCC
Load (Customer) Transformer
10.5 kV 400 V
Figure 13. One-line diagram of the test system.
IUh ZUh-ref RClp R ICh
Clp
ZUh-ref
I.U-Ph IC-Ph
Iu Ic
Iu_pcc Ic_pcc
Zu Zc
pcc pcc
Load model were determined with the field measurements. Measurements had been taken and recorded during the 40 hours in order to determine the contributions of the network and customer current and voltage to the PCC. Sampling time of the measurement is 5 minutes. Instant measurement taken from the PCC were processed via MATLAB according to method described Section 3. According to this method the customer load impedance va-ries between (0.14 + 0.1i) Ω and (0.6 + 1.1i) Ω.
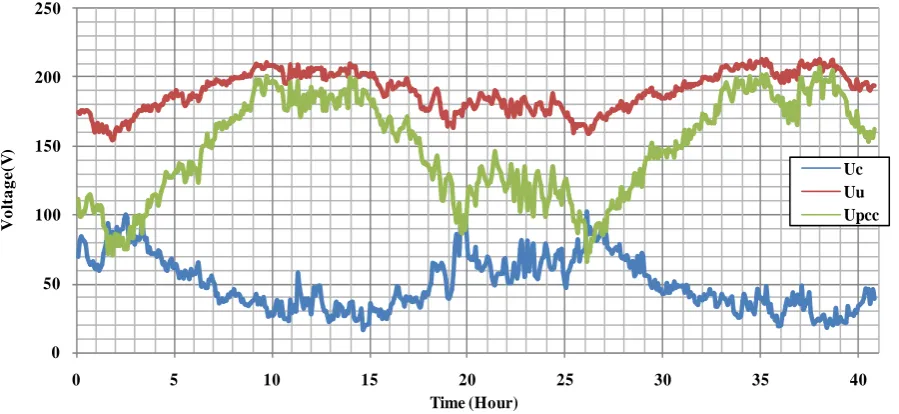
As a result of processing of the measurement data at the PCC shown inFigure13voltage and currents con-tributions of the network and customer to the PCC at the fundamental frequency are shown in Figure 14 and Figure 15. The indices “c”, “u” and “pcc” used the graphics indicate costumer, utility (network), and point of common coupling, respectively. As shown in the Figure14 and Figure 15, power drawn from the network va-ries according to the time.
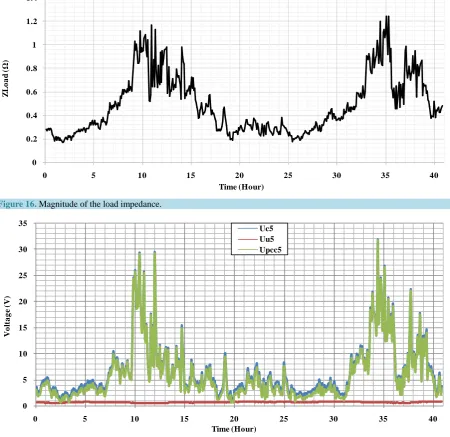
[image:10.595.91.541.497.704.2]After the measurements of the current and voltage, load impedance was calculated by using (8) and given in Figure16. As seen in the Figure16, magnitude of the load impedance varies between 0.172 Ω and 1.25 Ω with time. Even if the type of the load does not known specifically, their affect to the total load impedance have al-ready been taken into account by means of the constantly updated voltage and current data.
Figure 14.Customer and network current contributions to the PCC at the fundamental frequency.
Figure 15. Customer and network voltage contributions to the PCC at the fundamental frequency.
0 100 200 300 400 500 600 700 800 900 1000
0 5 10 15 20 25 30 35 40
C
u
rr
e
n
t (
A
)
Time(Hour)
Ic
Iu
Ipcc
0 50 100 150 200 250
0 5 10 15 20 25 30 35 40
V
ol
tage
(V
)
Time (Hour)
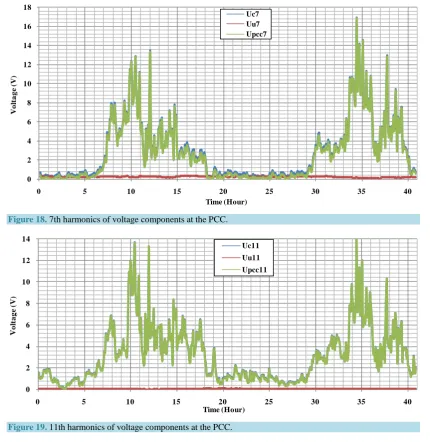
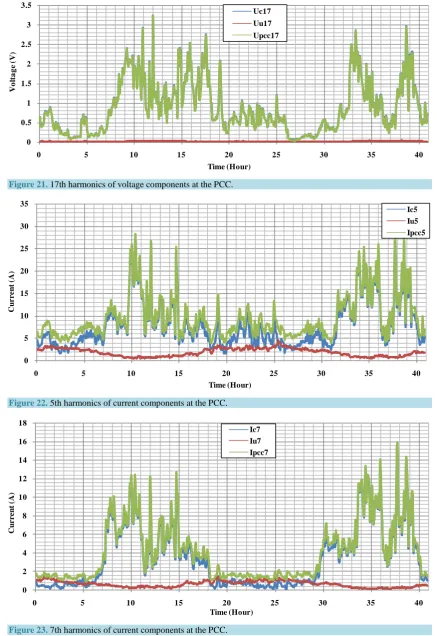
Harmonic voltage contribution is calculated by adapting the impedance value of the customer and network according to rank of the harmonic analysis. As a result of processing of the measured data, voltage harmonic contribution levels between the 5th and 17th of the customer and network to the PCC is given betweenFigures 17-21, respectively.
As can be seen from the referred graphs, reason for disturbance in voltage quality as well as current is results from the customer. That is, largest share in the disturbance in the waveform of the voltage at the PCC belongs to the customer. It is understood that the 5th and 7th voltage harmonic levels are higher than the other harmonic le-vels as expected from a medium power energy system.
[image:11.595.89.540.271.708.2]Harmonic current contribution is calculated by adapting the impedance value of the customer and network according to rank of the harmonic analysis. As a result of processing of the measured voltage data, voltage har-monic contribution levels between the 5th and 17th of the customer and network to the PCC is given between Figures 22-26 respectively. As can be seen from the referred graphs, largest share in the disturbance in the waveform of the current at the PCC belongs to the customer. As shown in Figure22 and Figure23, 5th and 7th current harmonic levels are higher than the other harmonic levels as a result of the voltage harmonics.
Figure 16. Magnitude of the load impedance.
Figure 17. 5th harmonics of the voltage components at the PCC.
0 0.2 0.4 0.6 0.8 1 1.2 1.4
0 5 10 15 20 25 30 35 40
ZLo
a
d
(Ω
)
Time (Hour)
0 5 10 15 20 25 30 35
0 5 10 15 20 25 30 35 40
Vo
lt
a
g
e (
V)
Figure 18. 7th harmonics of voltage components at the PCC.
[image:12.595.108.520.505.704.2]Figure 19.11th harmonics of voltage components at the PCC.
Figure 20.13th harmonics of voltage components at the PCC.
0 2 4 6 8 10 12 14 16 18
0 5 10 15 20 25 30 35 40
Vo
lt
a
g
e
(
V)
Time (Hour) Uc7 Uu7 Upcc7
0 2 4 6 8 10 12 14
0 5 10 15 20 25 30 35 40
Vo
lt
a
g
e
(
V)
Time (Hour) Uc11 Uu11 Upcc11
0 2 4 6 8 10 12
0 5 10 15 20 25 30 35 40
Vo
lt
a
g
e
(
V)
Figure 21.17th harmonics of voltage components at the PCC.
Figure 22.5th harmonics of current components at the PCC.
Figure 23. 7th harmonics of current components at the PCC.
0 0.5 1 1.5 2 2.5 3 3.5
0 5 10 15 20 25 30 35 40
V
ol
tage
(
V
)
Time (Hour) Uc17 Uu17 Upcc17
0 5 10 15 20 25 30 35
0 5 10 15 20 25 30 35 40
C
u
rr
e
n
t (
A
)
Time (Hour)
Ic5 Iu5 Ipcc5
0 2 4 6 8 10 12 14 16 18
0 5 10 15 20 25 30 35 40
C
u
rr
e
n
t (
A
)
[image:13.595.102.528.486.706.2]Figure 24. 11th harmonics of current components at the PCC.
[image:14.595.101.528.381.696.2]Figure 25. 13th harmonics of current components at the PCC.
Figure 26. 17th harmonics of current components at the PCC.
0 2 4 6 8 10 12 14
0 5 10 15 20 25 30 35 40
C
u
rr
e
n
t (
A
)
Time (Hour) Ic11 Iu11 Ipcc11
0 2 4 6 8 10 12
0 5 10 15 20 25 30 35 40
C
u
rr
e
n
t (
A
)
Time (Hour) Ic13 Iu13 Ipcc13
0 0.5 1 1.5 2 2.5 3 3.5 4 4.5
0 5 10 15 20 25 30 35 40
C
u
rr
e
n
t (
A
)
Separately calculated average (Avr.) and maximum (instantaneous value) harmonic level values of the current and voltage are given in Figure27 and Figure 28. Actually, standards of voltage and current distortion limits are determined according to peak value of the measured current or voltage data. In order to make comparison with the max harmonic levels, average harmonic levels of the current and voltage are also presented. As seen in these figures, a large part in the responsibility for distortion at the quality of the current and voltage belongs to customer. On the other hand, the network has at least some contribution on the distortion on the waveform of the current. These values should be taken into account while calculating the reactive power consumption of the cus-tomer. As seen in the figures the 5th and 7th harmonic levels of the network is higher than the others. And his is very common phenomenon in the power systems. On the other hand, not only 5th and 7th harmonic levels of the costumer are high but also other harmonic levels are very high according to network.
Calculated voltage and current THDs according the measurement given inTable 1. Distortion at the quality of the voltage is higher than the current because of the non-sinusoidal load characteristics of the customer. As seen in the harmonic levels and THDs, there are large differences between maximum and average values of the voltage and current. In order to check the suitability of the current and voltage THDs of the network and costu-mer, voltage and current distortion limits are provided in Table 2and Table 3, respectively.
Limits of allowable voltage and current distortion set by IEEE 519 [25]. IEEE 519 provides limits for har-monic current distortion in general distribution and sub-transmissJion systems based on the load compared to the system’s short-circuit capacity (the ratio ISC IL) as given in Table 3. As seen in Table 1, average voltage
[image:15.595.94.541.312.705.2]
Figure 27.Harmonic level and amplitudes of the voltage components at the PCC.
Figure 28.Harmonic level and amplitudes of current components at the PCC.
0 1 2 3 4 5 6 7
5 7 11 13 17
V ol tage [ V ] Harmonic Order Avr. C U PCC 0 5 10 15 20 25 30 35
5 7 11 13 17
Vo lt a g e [ V] Harmonic Order Max. C U PCC 0 1 2 3 4 5 6 7 8 9 10
5 7 11 13 17
C u rr e n t [ A ] Harmonic Order Avr. C U PCC 0 5 10 15 20 25 30
5 7 11 13 17
Table 1. Current and voltage THDs.
THD
Current Voltage
Avr. Max. Avr. Max.
C 0.165 0.296 0.172 0.399
U 0.005 0.006 0.004 0.005
PCC 0.023 0.038 0.055 0.195
Table 2. IEEE 519 voltage distortion limits [24].
Bus voltage at PCC Vh, % THDv, %
V < 69 kV 3.0 5.0
69 kV ≤ V < 161 kV 1.5 2.5
V ≥ 161 kV 1.0 1.5
Table 3.IEEE 519 current distortion limits [24].
SC L
I I
(120 V - 69 kV) %
H < 11 11 ≤ h < 17 17 ≤ h < 23 23 ≤ h < 35 35 ≤ h THD
<20 4.0 2.0 1.5 0.6 0.3 5
20 - 50 7.0 3.5 2.5 1.0 0.5 8
50 - 100 10 4.5 4.0 1.5 0.7 12
100 - 1000 12 5.5 5.0 2.0 1.0 15
>1000 15 7.0 6.0 2.5 1.4 20
THD of the customer is 17.2% while maximum voltage THD is 39.9%. Both of these values exceed the voltage distortion limits as seen in Table 2.
On the other hand, neither maximum nor average voltage THD of the network exceeds the limits. Therefore, penalty sanctions should be imposed to the customer for exceeding the voltage distortion limits.
SC L
I I of the test system is approximately83. According toTable 3, current distortion limit for the custom-er is 12% while for the network is 6%. Considcustom-ering these current distortion limits, both of the maximum and av-erage values of the customer exceed the limits. Therefore, another penalty sanctions should be imposed to the customer for exceeding the voltage distortion limits. Penalty rates are determined according to difference be-tween the distortion limit and distortion of the investigated system. Considering the maximum THD values, costumer has 34.9% more voltage and 4.5% more current THD in the test system. Considering the average THD values, costumer has 12.2% more voltage and 4.5% more current THD in the test system. Therefore, penalty rate of the customer will be proportional with these percentages.
8. Conclusions
by processing current and voltage data at the PCC with the proposed algorithm. Average and maximum value of the current and voltage THDs has been also calculated.
According to the analysis results of test system, it is determined that overall responsibilities in the current and voltage waveform distortion at the PCC only belong to the customer. Therefore, penalty sanctions should be imposed to the customer in the amount of it exceeds allowable limits. To be able to reduce to impact of the har-monics to the minimum and determine the harmonic contribution rates accurately and also determine the share of responsibility, some of the arrangements can be made as follows:
● The necessary arrangements about the harmonic contribution of the network and the customer should be performed and determined financial penalties should be applied when related limits given in the standards were exceeded.
● To take into account the average values instead of instantaneous values will be satisfy in terms of feasibility and justice while calculating the effect of the network’s and the customer’s harmonic distortion.
● Variable load condition should be taken into account in order to obtain more accurate results. Constantly changing load and also switching positions of the harmonic filters and compensator capacitors have been al-ready taken into account because of the calculated load impedance by using the voltage and current data up-dated constantly during the measurement period.
In the future, it is planned to use the same algorithm for determining the customer and network distortion contributions in an unbalanced three phase systems. Still, billing is not made for the harmonic contributions in practice. In this regard, a digital recorder including a harmonic contribution algorithm would be useful to deter-mine the harmonic contribution of the each customer in the allowable limits or not.
Acknowledgements
This study has been financially supported by TUBITAK with 110E134 project number. The authors would like to express their gratitude to BEDAŞ DistCo for facilitating and helping with the measurements at the substation.
References
[1] Dugan, R.C., et al. (2002) Electrical Power Systems Quality. 2nd Edition, McGraw-Hill, New York.
[2] Gul, O., Kaypmaz, A. and Tanrioven, M. (2004) A Novel Three-Phase Time Domain Load Modelling Technique Us-ing Instantaneous Symmetrical Components. European Transactions on Electrical Power, 14, 361-375.
http://dx.doi.org/10.1002/etep.28
[3] Gül, Ö. (2004) Identification of Three Phase Generic Load Model Parameters Using Field Measurements. IEEE MELECON2004, Dubrovnik.
[4] Katić, V.A., Mujović, S.V., Radulović, V.M. and Radović, J.S. (2011) The Impact of the Load Side Parameters on PC Cluster’s Harmonics Emission. Advances in Electrical and Computer Engineering, 11, 103-110.
http://dx.doi.org/10.4316/AECE.2011.01017
[5] Gül, Ö. and Milanovic, J. (2000) Sensitivity of Harmonic Load Model Parameters to Voltage and Current Waveforms.
The International Conference on Harmonics and Quality of Power, Orlando.
[6] Qian, K., Zhou, C., Allan, M. and Yuan, Y. (2011) Effect of Load Models on Assessment of Energy Losses in Distri-buted Generation Planning. IJEPES, 33, 1243-1250. http://dx.doi.org/10.1016/j.ijepes.2011.04.003
[7] Stojanovic, D.P., Korunovic, L.M. and Milanovic, J.V. (2008) Dynamic Load Modelling Based on Measurements in Medium Voltage Distribution Network. EPSR, 78, 228-238. http://dx.doi.org/10.1016/j.epsr.2007.02.003
[8] Liang, X., et al. (2012) Dynamic Load Models for Industrial Facilities. IEEE Transactions on Power Systems, 27, 69- 80. http://dx.doi.org/10.1109/TPWRS.2011.2161781
[9] Farhoodnea, M., Mohamed, A., Shareef, H. and Zayandehroodi, H. (2012) An Enhanced Method for Contribution As-sessment of Utility and Customer Harmonic Distortions in Radial and Weakly Meshed Distribution Systems. IJEPES, 43, 222-229. http://dx.doi.org/10.1016/j.ijepes.2012.05.013
[10] Thunberg, E. and Soder, L. (1999) A Norton Approach to Distribution Network Modeling for Harmonic Studies. IEEE Transactions on Power Delivery, 14, 272-277. http://dx.doi.org/10.1109/61.736738
[11] Fan, R.R., et al. (2013) A Method for Assessing Customer Harmonic Emission Level Based on the Iterative Algorithm for Least Square Estimation, Engineering, 5, 6-13. http://dx.doi.org/10.4236/eng.2013.59B002
[13] IEEE Std 519-1992, IEEE Recommended Pradice and Requirements for Harmonic Control in Electrical Power Sys-tems.
[14] Xu, W. and Liu, Y. (2000) A Method for Determining Customer and Utility Harmonic Contributions at the Point of Common Coupling. IEEE Transactions on Power Delivery, 15, 804-811.
[15] Bergeron, R. and Slimani, K. (1999) A Method for the Determination of the Customer Share of the Contribution to the Level of Harmonic Voltage on an Electric Network. Proceedings of IEEE Power Engineering Society Summer Meeting, 1, 354-360.
[16] Chen, C.Y., Liu, X.L., Koval, D., Xu, W. and Tayjasanant, T. (2004) Critical Impedance Method—A New Detecting Harmonic Sources Method in Distribution Systems. IEEE Transactions on Power Delivery, 19, 288-297.
http://dx.doi.org/10.1109/TPWRD.2003.820424
[17] Hamzah, N., Mohamed, A. and Hussain, A. (2005) Identification of Harmonic Source at the Point of Common Coupl-ing Based on Voltage Indices. Jurnal Teknologi, 43, 11-32.
[18] Li, C. and Xu, W. (2002) On Defining Harmonic Contributions at the Point of Common Coupling. IEEE Power Engi-neering Review, 45-46.
[19] Bergeron, R. and Slimani, K. (1999) Method for an Equitable Allocation of the Cost of Harmonics in an Electrical Network. Proceedings of IEEE Power Engineering Society Summer Meeting, 1, 347-353.
[20] Cristaldi, L. and Ferrero, A. (1995) Harmonic Power Flow Analysis for the Measurement of the Electric Power Quality.
IEEE Transactions on Instrumentation and Measurement, 44, 683-685. http://dx.doi.org/10.1109/19.387308
[21] Xu, W., Liu, X. and Liu, Y. (2003) An Investigation on the Validity of Power Direction Method for Harmonic Source Determination. IEEE Transactions on Power Delivery, 18, 214-219. http://dx.doi.org/10.1109/TPWRD.2002.803842 [22] Davis, E.J., Emanuel, A.E. and Pileggi, D.J. (1996) Evaluation of Single Point Measurements Method for Harmonic
Pollution Cost Allocation. IEEE Transactions on Power Delivery, 11, 1003-1008.
[23] Pfajfar, T., Blažič, B. and Papič, I. (2008) Harmonic Contributions Evaluation with the Harmonic Current Vector Me-thod. IEEE Transactions on Power Delivery, 23, 425-433. http://dx.doi.org/10.1109/TPWRD.2007.911165
[24] Varadan, S. and Makram, E.B. (1993) Generalized Load Modeling in the Presence of Hamonics and Distorion. The
25th Southeastern Symposium on System Theory (SSST’93), 124-128.
[25] ANSI/IEEE (1993) IEEE Recommended Practice and Requirements for Harmonic Control in Electrical Power Systems.