© 2018, IRJET | Impact Factor value: 6.171 | ISO 9001:2008 Certified Journal | Page 3460
Comprehensive study on the effect of Entropy Encoding Algorithms on
Medical Image Compression
Mr.M.D.Manigandan
1,
Dr.S.Deepa
21
PG Student, Department of ECE, Panimalar Engineering College, Chennai, Tamilnadu, India
2Professor, Department of ECE, Panimalar Engineering College, Chennai, Tamilnadu, India
---***---Abstract -
Advancements in the field of medical imaging and the rate at which medical images such as MRI, Ultrasound & CT scan, X-Ray, PET images are generated, stored and transmitted has created the need for extensive research in the field of medical image compression. Modern radiology techniques provide crucial medical information for radiologists to diagnose diseases and determine appropriate treatments. Hence dealing with medical image compression needs to compromise on good perceptual quality (i.e. diagnostically lossless) and high compression rate. In this paper a comprehensive analysis is done to study the effect of entropy encoding algorithms on compression parameters. From the results obtained it is evident that EZW and STW algorithms prove to minimize the MSE whereas CTM methods provide the best compression ratio.Key Words: Biorthogonal wavelets, Compression, CR, Daubechies Haar, Medical Image, MSE, SPIHT, SPIHT-3D, Wavelets
1.INTRODUCTION
Medical images such as MRI (Magnet Resonance Imaging), US (Ultra Sound), MRE (Magnetic Resonance Elastography), etc. are rich in radiological information. A huge number of these medical images are produced in hospitals and health care center. In case of tele-communication, transmitting those images from one place to another is a tedious task. There are many systems such as RIS (Radiology Information System), HIS (Hospital Information System), and PACS (Patient Archival and Communication Systems) that handle medical images. These systems are rich in diagnostic information and only high bit rate compression is possible to preserve these data for storage and transmission. Lossy compression is good in removing the redundant information that the human visual system cannot observe. But any loss of information also may lead to wrong diagnosis. Hence, lossless compression techniques are most commonly used for medical images processing [1],[2],[3]. Their main objective is to make the decompressed image visually and diagnostically lossless.
There are several image compression techniques such as fractal-based, transform based, machine learning –based, contextual-based, and other hybrid images compression methods. Transform-based compression transforms an image from spatial domain representation to other domain (such as frequency domain) using different transforms and codes the transformed coefficients to achieve compression.
They are computationally complex but compression achieved is higher compared to other methods. There are different transforms available such as Discrete Cosine Transform (DCT), Discrete Wavelet Transform (DWT), Ripplet transform, Radon Transform, Contourlet transform etc. Image compression using Wavelet Transforms is a powerful method that produces compressed images at higher compression ratios with higher PSNR values [4]. It is a popular transform used for some of the image compression standards in lossy compression methods. Unlike the discrete cosine transform, the wavelet transform is not Fourier-based and therefore wavelets do a better job of handling discontinuities in data. Wavelet supports multi-resolution analysis which produces good visual quality images with high Compression Ratio. Several standards such as JPEG2000, MPEG-2/4 recommend use of Discrete Wavelet Transforms (DWT) for image transformation which leads to compression when encoded.
Wavelets are a mathematical tool for hierarchically decomposing functions in multiple hierarchical sub bands with time scale resolutions. The Discrete Wavelet Transform (DWT), has gained wide popularity due to its excellent decorrelation property, many modern image and video compression systems embody DWT as the intermediate transform stage. After DWT was introduced, several codec algorithms such as EZW (Embedded Zerotrees Wavelet Transforms), WDR (Wavelet Difference Reduction), SPIHT (Set Partitioning in Hierarchical Trees), STW (Spatial Orientation Tree Wavelet, TWT (Tree Structured Wavelet) [5],[6],[7] were proposed to compress the transform coefficients as much as possible. Achieving much higher compression ratio is simply not possible without discarding
someperceptible information, but a compromise must be
© 2018, IRJET | Impact Factor value: 6.171 | ISO 9001:2008 Certified Journal | Page 3461 is the extended form of SPIHT coding algorithm, in which the
relationship among coefficients lying in different frequency bands is based on octal tree structure rather than quad-tree structure. The most enhanced image compression algorithm is the Adaptively Scanned Wavelet Difference Reduction (ASWDR) algorithm proposed by Walker [13], ASWDR technique adjusts the scanning order used by Wavelet Difference Reduction (WDR) algorithm [14],[15],[16] so as to predict locations of new significant values. The WDR method employs a fixed ordering of the positions of wavelet coefficients. Thus, ASWDR technique achieves high compression than WDR while retaining all of the important features of WDR such as low complexity, region of interest (ROI) capability and progressive SNR capability [17],[18],[19],[20]. The rate of compression achieved is largely determined by the encoding technique and the number of encoding loops used. Thus in this paper the most powerful wavelet based compression technique is identified by presenting a comparative study of the various approaches.
2. MATERIALS AND METHODS
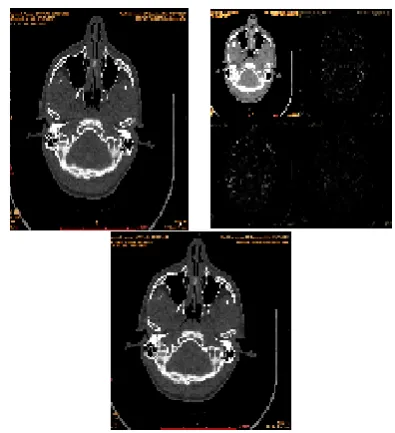
The compaction property of DWT i.e., having only a small number of large coefficients and large number of small coefficients is helpful to achieve higher compression ratio. Compression takes place at the transmitter end and decompression takes place in the receiver end. The DWT consists of a pair of filter banks called Analysis filter bank and Synthesis filter bank which will be used in the transmitter end and receiver end respectively. In the first step a suitable wavelet (e.g. Haar, Symlet, Coiflet) and number of levels (n) for the decomposition is chosen. The Analysis filter bank decomposes the input images into four subbands called the approximation, vertical detail, horizontal detail and diagonal detail subbands. In the second step, the detail coefficients are thresholded from scales J-1 to J-n. Thresholding can be hard or soft thresholding. In hard thresholding, the elements whose absolute values are lower than the threshold are set to zero. In soft thresholding, initially the elements whose values are lower than the threshold are set to zero and the non zero coefficients are scaled to zero. In the third step quantisation is performed. The quantised coefficients are entropy encoded for further compression using algorithms such as EZW or SPIHT or STW etc., At the receiver end in order to decompress the image, entropy decoding is done followed by dequantisation. The thresholding process is irreversible, hence Inverse DWT uses synthesis filter bank to obtain the decompressed image. An example of wavelet decomposition is shown in figure 1. Figure 1 (a) shows the original MRI image and 1 (b) shows the wavelet decomposed image and 1(c) shows Decompressed image.
[image:2.595.333.531.76.293.2]
(a) Original MRI Image (b) First Level Decomposition (c) Decompressed Image
Fig.1 Compression of MRI image using Wavelet Decomposition
2.1 Performance Measures
When the compression is lossy in nature, the decompressed image may not be the same as the original image. Achieving a high compression ratio leads to a loss of more details in the image. The challenge of compression methods is to find the best compromise between a high compression ratio and a good perceptual result. The metrics used to compare the various image compression techniques are the Compression Ratio (CR), Mean Square Error (MSE), Peak Signal to Noise Ratio (PSNR), Maximum Error, L2-Norm Ratio and Bits Per Pixel (BPP).
Compression Ratio:
Compression Ratio measures the efficiency of the compression algorithm by computing the percentage of compression achieved. The Compression Ratio CR, means that the compressed image is stored using only CR% of the initial storage size. It is defined as the number of elements in the compressed image divided by the number of elements in the original image, expressed as a percentage,
Mean Square Error
The MSE is the cumulative squared error between the compressed and the original image. Mean square error is a measure of image quality index. The large value of mean square means that image is of poor quality.
Peak Signal to Noise Ratio:
© 2018, IRJET | Impact Factor value: 6.171 | ISO 9001:2008 Certified Journal | Page 3462 PSNR is most commonly used as a measure of quality of
reconstruction of lossy compression codecs. The signal in this case is the original data, and the noise is the error introduced by compression. When comparing compression codecs it is used as an approximation to human perception of reconstruction quality, therefore in some cases one reconstruction may appear to be closer to the original than another, even though it has a lower PSNR (a higher PSNR would normally indicate that the reconstruction is of higher quality). One has to be extremely careful with the range of validity of this metric; it is only conclusively valid when it is used to compare results from the same codec (or codec type) and same content. The higher the PSNR, the better the quality of the reconstructed image. Typical values for lossy compression of an image are between 30 dB and 50 dB [2]. When the PSNR is greater than 40 dB, then the two images are indistinguishable. The PSNR can give an approximate index of image quality, but by itself it cannot make a comparison between the quality of two different images. It is possible, indeed, that an image with a lower PSNR might be perceived as an image of better quality compared to one with a higher signal to noise ratio.
Max Error:
Maximum error is the maximum absolute squared deviation in the signal or image approximation.
L2-Norm Ratio:
L2-norm ratio is the ratio of the squared L2-norm of the image approximation to the input image. The image is reshaped as a column vector before taking the L2-norm.
Bits Per Pixel:
Bits per pixel ratio (BPP) is the number of bits required to store one pixel of the image. The bits per pixel (BPP) is calculated as given by the equation,
2.2 Proposed Analysis
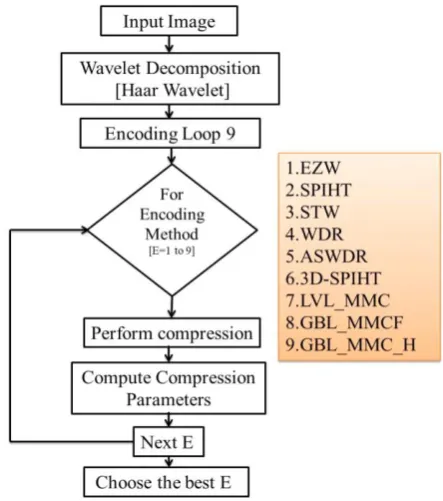
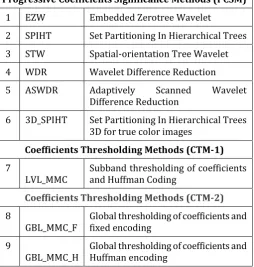
In this analysis the effect of changing the entropy encoding algorithms on the performance measures is analysed. From the previous analysis it is clear that the best result is produced for number of encoding loops equal to 9. Thus in this analysis the number of encoding loops is fixed as 9, the type of wavelet used is Haar and the encoding method is varied and its effect on compression parameters is analysed as shown in figure 2. Entropy Encoding Algorithms (Compression Algorithms) are divided in three categories: 1.Progressive Coefficients Significance Method (PCSM) 2.Coefficients Thresholding Method-1 (CTM-1) and 3. Coefficients Thresholding Method -2 (CTM-2). Under each category various algorithms are available and Table 1 shows various compression algorithms under each category. The compression algorithms are explained in detail in the following section.
EZW
[image:3.595.321.543.308.559.2]The Embedded Zerotree Wavelet algorithm (EZW) [4] is a valuable image compression algorithm. This method produces a fully embedded bit stream for image coding. Also, the compression performance of this algorithm is competitive with virtually all known techniques. Furthermore, this technique requires definitely no training, no pre-stored codebooks or tables and requires no preceding knowledge of the image source. The EZW algorithm is based on four principal concepts: a discrete wavelet transform or hierarchical sub-band decomposition, prediction of the absence of significant information across scales, entropy coded successive-approximation quantization and universal lossless data compression which is accomplished via adaptive arithmetic coding, successive approximation and a prioritization protocol which helps us to determine the order of importance due to various characteristics.
Fig. 2. Flow diagram of Proposed Analysis SPIHT
© 2018, IRJET | Impact Factor value: 6.171 | ISO 9001:2008 Certified Journal | Page 3463 Pearlman were able to greatly improve the EZW algorithm,
[image:4.595.39.294.250.518.2]significantly increasing its compressive power. The SPIHT coder is a highly refined version of the EZW algorithm and is a powerful image compression algorithm that produces an embedded bit stream from which the best reconstructed images in the mean square error sense can be extracted at various bit rates. Some of the best results-highest PSNR values for given compression ratios - for a wide variety of images have been obtained with SPIHT. Hence, it has become the benchmark state-of-the-art algorithm for image compression
Table 1. Types of Entropy Encoding Algorithms
Progressive Coefficients Significance Methods (PCSM)
1 EZW Embedded Zerotree Wavelet
2 SPIHT Set Partitioning In Hierarchical Trees 3 STW Spatial-orientation Tree Wavelet 4 WDR Wavelet Difference Reduction
5 ASWDR Adaptively Scanned Wavelet
Difference Reduction
6 3D_SPIHT Set Partitioning In Hierarchical Trees 3D for true color images
Coefficients Thresholding Methods (CTM-1) 7
LVL_MMC Subband thresholding of coefficients and Huffman Coding Coefficients Thresholding Methods (CTM-2) 8
GBL_MMC_F Global thresholding of coefficients and fixed encoding 9
GBL_MMC_H Global thresholding of coefficients and Huffman encoding
SPATIAL-ORIENTATION TREE WAVELET
The Spatial Orientation Tree Wavelet (STW) employs a diverse approach in coding the information of zerotree. A zerotree have insignificant wavelet transform values at each of its locations for a given threshold T. Zerotree is a tree of locations in the wavelet transform with a root say [j, k], and its descendants (children) located at [2j, 2k], [2j+1, 2k], [2j, 2k+1], and [2j+1, 2k+1], and each of their children, and so on. STW is more vigilant in its organization of coding outputs than the Embedded Zerotree Wavelet (EZW) [12] and SPIHT algorithm [16]. In EZW, the root location is marked by encoding only one symbol for the output R or I as described in [12]. Consequently in EZW, the zerotrees provide narrow descriptions of the locations of insignificant values. The different approach used in STW is the use of a state transition model. The locations of transform values undertake state transitions from one threshold to the next. The number of bits required for encoding is thus reduced in STW with this representation of state transitions. The state
transition model uses states IR, IV, SR and SV as represented in [14] to mark the locations instead of code for the outputs R and I used in [12]. The states involved are defined after knowing the significance function S(m) and the descendent indices D(m).
STW is essentially the SPIHT algorithm, the only difference is that SPIHT is slightly more careful in its organization of coding output. Second, we shall describe 3D_SPIHT scheme extended from the 2D SPIHT, having the following three similar characteristics:
• Partial ordering by magnitude of 3 D wavelets transformed video with a 3d set partitioning algorithm
• Ordered bit plane transmission of refinement bits, and the SPIHT algorithm. It will be easier to explain SPIHT using the concepts underlying STW.
• The only difference between STW and EZW is that STW uses a different approach to encode the zero tree information. STW uses a state transition model. From one threshold to the next, the locations of transform values undergo state transitions.
WDR and ASWDR
The ASWDR method is a generalization of the WDR method of Tian and Wells [1] and [2]. The WDR method has two principal advantages. First, it produces an embedded bit stream thereby facilitating progressive transmission over small bandwidth channels and/or enabling multi-resolution searching and processing algorithms. Second, it encodes the precise indices for significant transform values thereby allowing for Region of Interest (ROI) capability and for image processing operations on compressed image files. It is one of the most enhanced image compression algorithms proposed by Walker [10].The ASWDR algorithm aims to improve the subjective perceptual qualities of compressed images and improve the results of objective distortion measures. The ASWDR algorithm is a simple modification of the Wavelet Difference Reduction (WDR) algorithm [4]. The WDR algorithm employs a fixed ordering of the positions of wavelet coefficients but the ASWDR method employs a varying order which aims to adapt itself to specific image features. ASWDR adjusts the scanning order so as to predict locations of new significant values. The scanning order of ASWDR dynamically adapts to the locations of edge details in an image, and this enhances the resolution of these edges in ASWDR compressed images. Thus, ASWDR exhibits better perceptual qualities, especially at low bit rates, than WDR and SPIHT compressed images preserving all the features of WDR. The ASWDR on an image/frame is executed by a step by step procedure described below:
© 2018, IRJET | Impact Factor value: 6.171 | ISO 9001:2008 Certified Journal | Page 3464 Step 2: A scanning order for the transformed image is
chosen, fˆ [j,k] = a(m). The transform values are scanned via a linear ordering, m = 1,2,3…..X where X is the number of pixels. Row-based scanning is used in the horizontal subbands and column-based scanning is used in the vertical subbands with the zigzag scanning order through subbands from higher scale to lower scale.
Step 3: In this step an initial threshold T is chosen. The T is chosen in such a way that at least one transform value has magnitude less than or equal to T and all transform values have magnitudes less than 2T.
Step 4: (Significance pass). The positions for new significant values are recorded as depicted in. These new significant indices are then decoded using difference reduction [12].
Step 5: (Refinement pass). Record the refinement bits the next significant bits, for the old significant transform values. This generation of refinement bits is also known as standard bit plane encoding which is utilized by all embedded codecs [10].
Step 6: (New scanning order). For the level containing the all-lowpass subband, the indices of the remaining insignificant values are used as the scan order at that level. The scan order at level k is used to create the new scan order at level k - 1as follows: Run through the significant values (i.e. the parent values) at level k in the wavelet transform. Each parent value induces a set of four child values for all the levels except the last. The last level induces three child values as described in the spatial-orientation tree definition in [4]. At level k - 1, the insignificant values are enclosed in the first part of the scan order lying among these child values. Now again run through the insignificant values at level k in the wavelet transform. This provides the insignificant values enclosed in the second part of the scan order lying among the child values induced by these insignificant parent values. This new scanning order for level k - 1 is further used to create the new scanning order for level k – 2, until all levels are exhausted.
Step 7: Divide the present threshold by 2. Repeat Steps 4-6 until either all the levels are exhausted or a given distortion metric [7] is fulfilled.
SPIHT_3D:
The 3D-Set Partitioning in hierarchical trees (3D-SPIHT) technique which is proposed by Kim et al. [12], [13] is extended from the above known SPIHT coding algorithm. It is a simple and efficient wavelet zero tree image coding algorithm which has been proved its efficiency with high performance, precise rate control and its real-time capability in compression of image. The coder is fully embedded, so that a variety of monochrome or color video quality can thus be obtained with a single compressed bit stream. So we can stop the compression process at a desired rate [11]. The wavelet coefficients are considered as a collection of spatial
orientation trees where each tree is formed of coefficients from all sub bands belonging to the same spatial location in an image [18]. The wavelet coefficients are scanned column then line, from low subbands to high subbands. After that an iterative 3D-SPIHT algorithm selects an initial threshold based on the largest wavelet coefficient [10]. When the largest coefficient magnitude in the set is greater than or equal to the selected threshold, a tree wavelet coefficient set is significant. In the 3D-SPIHT algorithm we have two important passes: sorting pass and refinement pass [18]. A recursive partitioning is realized on the tree. So the position of significant coefficient in the descendants of the considered coefficient is identified [18], [11]. In SPIHT, the relationship among coefficients lying in different frequency bands is based on quad-tree structure, while the one is based on octree structure in 3D-SPIHT. Given an image sequence to be encoded, 7L+1 subband image cubes are produced after L-level 3D wavelet transformation. A 2-L-level 3D wavelet transformation is shown in Figure 4. Where, the coefficients lying in the lowest frequency subband (LLL2) are the roots of octrees, each of which has seven child-nodes that lie respectively in the subbands (LLH2, LHL2, LHH2, HLL2, HLH2, HHL2 and HHH2) in seven directions. And each child-node has also its 8 children-child-nodes that lie in more refined subbands in the according directions. Thus, except the coefficients in the lowest subband (LLL2) and in the highest subbands (LLH1, LHL1, LHH1, HLL1, HLH1, HHL1 and HHH1), each coefficient has 8 children-nodes. In 3D-SPIHT encoding, in order to get higher encoding speed, image sequence is often divided into smaller sized data cubes, such as 16 × 16 × 16 or 32 × 32 × 32. Then each data cube is wavelet transformed, quantized and encoded respectively.
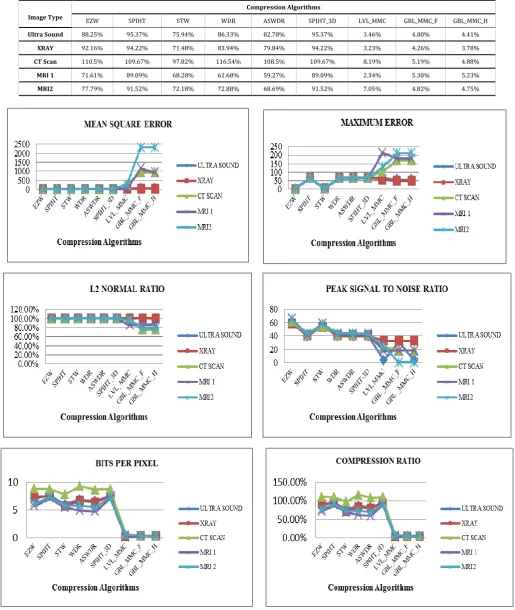
Table 2 shows the MSE obtained for various compression algorithms using Haar wavelets with 9 encoding loops. From the corresponding graph shown in figure 3(a) it is evident that EZW encoding has produced minimum MSE which is preferred and the next best algorithm is STW. Table 3 shows the Maximum Error obtained for various compression algorithms and from the corresponding graph shown in figure 3(b) it is evident that EZW and STW algorithms have produced the expected results. Table 4 shows the L2Normal Ratio obtained for various compression algorithms and from the corresponding graph shown in figure 3(c) it is clear that varying the compression algorithms does not affect the L2 Normal Ratio.
© 2018, IRJET | Impact Factor value: 6.171 | ISO 9001:2008 Certified Journal | Page 3465 Table 2: Mean Square Error using Haar wavelets with number of encoding loops =9
Image Type
Compression Algorithms
EZW SPIHT STW WDR ASWDR SPIHT_3D LVL_MMC GBL_MMC_F GBL_MMC_H
Ultra Sound 0.05601 6.909 0.2212 6.518 6.518 6.909 57.38 53.91 53.91
XRAY 0.0816 5.499 0.2729 5.089 5.089 5.499 33.76 34.14 34.14
CT Scan 0.044 4.22 0.2257 3.76 3.76 4.222 275.7 933 933
MRI 1 0.069 0.0148 4.544 0.08475 4.357 4.357 4.544 1159 934.9
MRI2 0.02082 2.808 0.1111 2.563 2.563 2.808 263.8 2316 2316
Table 3: Maximum Error using Haar wavelets with number of encoding loops =9
Image Type
Compression Algorithms
EZW SPIHT STW WDR ASWDR SPIHT_3D LVL_MMC GBL_MMC_F GBL_MMC_H
Ultra Sound 2 68 3 68 68 68 65 56 56
XRAY 2 68 3 68 68 68 58 49 49
CT Scan 1 71 3 71 71 71 105 169 169
MRI 1 2 65 3 64 64 65 213 179 179
[image:6.595.48.547.369.467.2]MRI2 2 65 3 65 65 65 131 211 211
Table 4: L2Normal Ratio using Haar wavelets with number of encoding loops =9
Image Type
Compression Algorithms
EZW SPIHT STW WDR ASWDR SPIHT_3D LVL_MMC GBL_MMC_F GBL_MMC_H
Ultra Sound 100.00% 99.80% 100.10% 100.00% 100.00% 99.80% 99.81% 99.83% 99.83%
XRAY 100.00% 99.90% 100.07% 100.04% 100.04% 99.90% 99.90% 100.00% 100.00%
CT Scan 100.00% 99.43% 100.17% 99.91% 99.91% 99.43% 96.28% 75.93% 75.93%
MRI 1 100.00% 99.65% 100.11% 99.92% 99.92% 99.65% 85.16% 85.45% 85.45%
MRI2 100.00% 99.81% 100.09% 100.03% 100.03% 99.81% 96.58% 79.36% 79.36%
Table 5: Peak Signal to Noise Ratio using Haar wavelets with number of encoding loops =9
Image Type
Compression Algorithms
EZW SPIHT STW WDR ASWDR SPIHT-3D LVL MMC GBL _MMC_F GBL _MMC_H
Ultra Sound 60.25 39.74 54.68 39.99 39.99 39.74 3.54 30.81 3.81
XRAY 59.01 40.73 53.77 41.06 41.06 40.73 32.85 32.8 32.8
CT Scan 61.64 41.88 54.6 42.38 42.38 41.88 23.73 18.43 18.43
MRI 1 66.43 41.56 58.85 41.71 41.74 41.56 17.49 18.42 18.42
MRI2 64.95 43.65 57.67 44.04 44.04 43.65 23.92 0.3855 0.37988
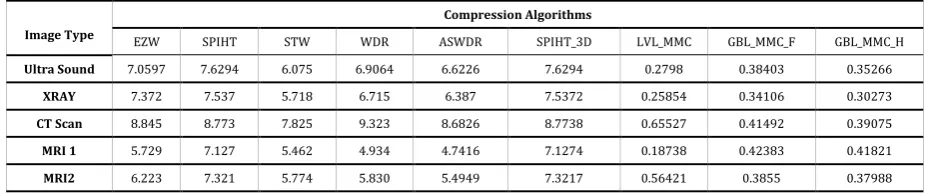
Table 6: Bits Per Pixel using Haar wavelets with number of encoding loops =9
Image Type
Compression Algorithms
EZW SPIHT STW WDR ASWDR SPIHT_3D LVL_MMC GBL_MMC_F GBL_MMC_H
Ultra Sound 7.0597 7.6294 6.075 6.9064 6.6226 7.6294 0.2798 0.38403 0.35266
XRAY 7.372 7.537 5.718 6.715 6.387 7.5372 0.25854 0.34106 0.30273
CT Scan 8.845 8.773 7.825 9.323 8.6826 8.7738 0.65527 0.41492 0.39075
MRI 1 5.729 7.127 5.462 4.934 4.7416 7.1274 0.18738 0.42383 0.41821
[image:6.595.51.544.500.599.2] [image:6.595.65.533.632.729.2]© 2018, IRJET | Impact Factor value: 6.171 | ISO 9001:2008 Certified Journal | Page 3466 Table 7: Compression Ratio using Haar wavelets with number of encoding loops =9
Image Type
Compression Algorithms
EZW SPIHT STW WDR ASWDR SPIHT_3D LVL_MMC GBL_MMC_F GBL_MMC_H
Ultra Sound 88.25% 95.37% 75.94% 86.33% 82.78% 95.37% 3.46% 4.80% 4.41%
XRAY 92.16% 94.22% 71.48% 83.94% 79.84% 94.22% 3.23% 4.26% 3.78%
CT Scan 110.5% 109.67% 97.82% 116.54% 108.5% 109.67% 8.19% 5.19% 4.88%
MRI 1 71.61% 89.09% 68.28% 61.68% 59.27% 89.09% 2.34% 5.30% 5.23%
MRI2 77.79% 91.52% 72.18% 72.88% 68.69% 91.52% 7.05% 4.82% 4.75%
© 2018, IRJET | Impact Factor value: 6.171 | ISO 9001:2008 Certified Journal | Page 3467
3. CONCLUSION
Medical image compression techniques are presented in this paper and a comprehensive analysis is carried out to identify the best compression approach. In this analysis the wavelet is chosen to be Haar, and the number of encoding loops is fixed as 9. By varying the compression algorithms the various compression parameters are computed. From the results it is evident that EZW and STW algorithms prove to minimize the MSE whereas CTM methods provide the best compression ratio. Thus for medical applications where MSE is to be minimized EZW and STW algorithms provide the best result. SPIHT and SPIHT 3D algorithms produce best result both in terms of MSE and Compression ratio. Thus it is clear that the compression algorithm and the number of encoding loops play significant roles than the type of wavelet. In medical image Regions of Interest such as the location of lesion or tumors carry significant data compared to other regions. Thus further investigations are on to carry out contextual based medical image compression.
REFERENCES
[1] Marchenko and G. Deng.(2013). "Bayesian predictor combination for lossless image compression," IEEE Trans. Image Proocess. 22(12), pp. 5263 -5270.
[2] S. Julit, E.B. Rajsingh and K. Ezral image. (2016). “A novel medical image compression using ripplet transform” J. Red Time Image Process. 11 (2), pp.401-412.
[3] H. Jiang, Z. Ma, Y. Hu, B. Yang and L. Zhang. (2012). “Medical image compression based on vector quantization with variable block sizes in wavelet domain,” Comput. Intell Neurosci . Hindawi Publishing Corporation,ID 541890, 5, pp.1-8.
[4] R.A.Devore, B.Jawerth, and B.J. Lucier, “Image compression through wavelet transform coding,” IEEE Transactaions on Information Theory, vol.38, no.2, pp. 719-746, March 1992.
[5] Rehna. V., Shubhangi. & Vasanthi . “improving the performance of wavelet based image compression using spiht algorithm” irnet transactions on electrical and electronics engineering (itee) issn 2319-2577, vol-1, iss-2, 2012.
[6] Asad Islam & Pearlman, “An embedded and efficient low-complexity, hierarchical image coder”, Visual Communication and Image processing’ 99proceedings of SPIE., Vol 3653, pp294-305 Jan.,1999.
[7] S.M. Hosseini and A.R. Naghsh-Nilchi.(2012). “Medical ultrasound image compression using
contextual vector quantization,” Comput. Biol. Med., 42, pp.743-750.
[8] J. M. Shapiro, “Embedded image coding using zerotress of wavelet coefficients,” IEEE Transactions.
[9] J.Wang and F.Zhang,”Study of the image compression Based on SPHIT Algorithm”, IEEE Int.Conf.Intell.Comput.Cogn.Inform., pp.130-133, Jun-2010.
[10] D.Zhao and S.Ma “Speech Compression with Best Wavelet Packet Transform and SPIHT Algorithm,” IEEE second Int.conf.comput.Model.Simul., Vol.1,pp.360-363, Jan.2010
[11] J. Kim and Pearlam, “An Embedded and Wavelet Video Coder using Three-Dimensional Set Partitioning in Hierarchical Trees (3D-SPIHT),” in proc. Of Data Compression Conference 1997, snowbird, USA, March 1997, pp. 251-260.
[12] B.J. Kim, Z. Xiong, and W.A. Pearlam , “Low bit-rate scalable video coding with 3-D set partitioning in hierarchical trees (3D-SPIHT), “ IEEE Transaction on Circuits and Systems for Video Technology, vol, 10, pp.1374-1387, Dec. 2000.
[13] James S. Walker, “Wavelet-based Image Compression,” in Transforms and Data Compression handbook, CPC Press LLC, Boca Raton,2001.
[14] T. Ramaprabha M Sc M Phil, Dr M. Mohamed Sathik, “A Comparative Study of Improved Region Selection Process in Image Compression using SPIHT and WDR” International Journal of Latest Trends in Computing (E-ISSN: 2045-5364) Volume 1, Issue 2, Dec.2010.
[15] J. Tian and R.O. Wells, Jr. Embedded image coding using wavelet difference- reduction. Wavelet Image and Video Compression, P. Topiwala, ed., pp.289-301. Kluwer Academic publ., Norwell, MA, 1998.
[16] E. Usevitch, “A Tutorial on Modern Lossy Wavelet Image Compression: Foundations of JPEG 2000,” in IEEE Signal processing Magazine, vol.18, no.5, pp. 22-35, Sep.2001.
[17] J. Stollnitz, T. D. DeRose, D.H. Salesin, “Wavelet For Computer Graphic: Theory and Applications”, Morgan Kaufman Publisher, USA, San Fransisco, 1996.
© 2018, IRJET | Impact Factor value: 6.171 | ISO 9001:2008 Certified Journal | Page 3468 [19] H. Yang, M. Long and H. M. Tai, “Region-of-interest
image coding based on EBCOT,” IEE Pro. Vist.1 Image Signal Process., Vol. 152, no.5, pp.590-596, 2013.
[20] J. C. Garcia-Alvarez, H. Fuhr and G. Castellanos-Domi-nguez.(2013). “Evaluation of region-of-interest coders using perceptual image quality assessments,” J. Visual Commun. Image Represent. 24 (8), pp.1316-1327.
BIOGRAPHIES
S
.Deepa is currently working as Professor in the Department of Electronics and Communication Engineering in Panimalar Engineering College, Chennai. She received her Bachelor of Engineering degree in Electronics and Communication Engineering from Madras University in the year 1998. She completed her Masters in Engineering in Applied Electronics in the year 2005 and received doctorate in image processing in the year 2014, both from Sathyabama University, Chennai. She has a total teaching experience of about 14 years and her research interest includes Image Processing, Computer Vision, Pattern Recognition, Low power VLSI design and architecture.