mice independently of the LKB1/AMPK pathway
via a decrease in hepatic energy state
Marc Foretz, … , Fabrizio Andreelli, Benoit Viollet
J Clin Invest.
2010;
120(7)
:2355-2369.
https://doi.org/10.1172/JCI40671
.
Metformin is widely used to treat hyperglycemia in individuals with type 2 diabetes.
Recently the LKB1/AMP-activated protein kinase (LKB1/AMPK) pathway was proposed to
mediate the action of metformin on hepatic gluconeogenesis. However, the molecular
mechanism by which this pathway operates had remained elusive. Surprisingly, here we
have found that in mice lacking AMPK in the liver, blood glucose levels were comparable to
those in wild-type mice, and the hypoglycemic effect of metformin was maintained.
Hepatocytes lacking AMPK displayed normal glucose production and gluconeogenic gene
expression compared with wild-type hepatocytes. In contrast, gluconeogenesis was
upregulated in LKB1-deficient hepatocytes. Metformin decreased expression of the gene
encoding the catalytic subunit of glucose-6-phosphatase (G6Pase), while cytosolic
phosphoenolpyruvate carboxykinase (
Pepck
) gene expression was unaffected in wild-type,
AMPK-deficient, and LKB1-deficient hepatocytes. Surprisingly, metformin-induced inhibition
of glucose production was amplified in both AMPK- and LKB1-deficient compared with
wild-type hepatocytes. This inhibition correlated in a dose-dependent manner with a reduction in
intracellular ATP content, which is crucial for glucose production. Moreover,
metformin-induced inhibition of glucose production was preserved under forced expression of
gluconeogenic genes through PPAR
g
coactivator 1
a
(PGC-1
a
) overexpression, indicating
that metformin suppresses gluconeogenesis via a transcription-independent process. In
conclusion, we demonstrate that metformin inhibits hepatic gluconeogenesis in an
LKB1-and AMPK-independent manner via a decrease in hepatic energy state.
Research Article
Find the latest version:
Research article
Metformin inhibits hepatic gluconeogenesis
in mice independently of the LKB1/AMPK
pathway via a decrease in hepatic
energy state
Marc Foretz,1,2 Sophie Hébrard,1,2 Jocelyne Leclerc,1,2 Elham Zarrinpashneh,3 Maud Soty,4,5,6 Gilles Mithieux,4,5,6 Kei Sakamoto,3 Fabrizio Andreelli,1,2,7 and Benoit Viollet1,2
1Institut Cochin, Université Paris Descartes, CNRS (UMR 8104), Paris, France. 2INSERM, U1016, Paris, France. 3MRC Protein Phosphorylation Unit,
College of Life Sciences, University of Dundee, Dundee, United Kingdom. 4INSERM, U855, Lyon, France. 5Université de Lyon, Lyon, France. 6Université Lyon I, Villeurbanne, France. 7CHU Bichat Claude Bernard, Service de Diabétologie-Endocrinologie-Nutrition, AP-HP, Paris, France.
Metformin is widely used to treat hyperglycemia in individuals with type 2 diabetes. Recently the
LKB1/AMP-activated protein kinase (LKB1/AMPK) pathway was proposed to mediate the action of metformin on hepatic
gluconeogenesis. However, the molecular mechanism by which this pathway operates had remained elusive.
Sur-prisingly, here we have found that in mice lacking AMPK in the liver, blood glucose levels were comparable to
those in wild-type mice, and the hypoglycemic effect of metformin was maintained. Hepatocytes lacking AMPK
displayed normal glucose production and gluconeogenic gene expression compared with wild-type hepatocytes.
In contrast, gluconeogenesis was upregulated in LKB1-deficient hepatocytes. Metformin decreased expression
of the gene encoding the catalytic subunit of glucose-6-phosphatase (G6Pase), while cytosolic
phosphoenol-pyruvate carboxykinase (
Pepck
) gene expression was unaffected in wild-type, AMPK-deficient, and
LKB1-defi-cient hepatocytes. Surprisingly, metformin-induced inhibition of glucose production was amplified in both
AMPK- and LKB1-deficient compared with wild-type hepatocytes. This inhibition correlated in a
dose-depen-dent manner with a reduction in intracellular ATP content, which is crucial for glucose production. Moreover,
metformin-induced inhibition of glucose production was preserved under forced expression of gluconeogenic
genes through PPAR
γ
coactivator 1
α
(PGC-1
α
) overexpression, indicating that metformin suppresses
gluconeo-genesis via a transcription-independent process. In conclusion, we demonstrate that metformin inhibits hepatic
gluconeogenesis in an LKB1- and AMPK-independent manner via a decrease in hepatic energy state.
Introduction
Type 2 diabetes is a progressive metabolic disorder with diverse pathological manifestations and is often associated with abnormal lipid and glucose metabolism. Metformin is currently the drug of first choice for the treatment of type 2 diabetes, being prescribed to at least 120 million people worldwide. As demonstrated in large prospective controlled clinical trials, metformin improves glycemic control and reduces cardiovascular mortality in overweight type 2 diabetic patients (1) and is also used to prevent type 2 diabetes (2). However, the molecular mechanisms of metformin action are not well understood. It was initially suggested that one of the key actions of metformin was to stimulate muscle glucose uptake (3). Recently, a growing body of evidence from clinical studies and animal mod-els suggests that the primary function of metformin is to decrease hepatic glucose production, mainly by inhibiting gluconeogenesis (4–6). This preferential action of metformin in hepatocytes is due to the predominant expression of organic cation transporter 1 (OCT1), which has been shown to facilitate cellular uptake of metformin. Consistent with this notion, deletion of the Oct1 gene in mouse dra- matically reduces metformin uptake in hepatocytes, and humans car-rying reduced function polymorphisms of the OCT1 gene display an impaired effect of metformin in lowering blood glucose levels (7).
Although the molecular target of metformin was elusive for sev- eral years, Zhou et al. demonstrated in 2001 that metformin treat-ment activates the energy sensor AMP-activated protein kinase (AMPK) in rat primary hepatocytes (8), and thereafter numerous groups also showed that metformin treatment stimulates AMPK in tissues in both humans and rodents (9, 10). AMPK is a phylo-genetically conserved serine/threonine protein kinase composed of a catalytic α-subunit and two regulatory subunits, β and γ. In mammals, each AMPK subunit appears in multiple isoforms (α1,
α2, β1, β2, γ1, γ2, and γ 3) that differ in tissue and subcellular local-ization, suggesting different roles (11). AMPK has been identified as a key regulator of cellular energy status and plays a crucial role in protecting cellular function under energy-restricted conditions in the liver (12). Thus, AMPK is activated in response to a variety of metabolic stresses that typically change the cellular AMP/ATP ratio caused by increasing ATP consumption or reducing ATP pro- duction, as seen following hypoxia, glucose deprivation, and inhi- bition of mitochondrial oxidative phosphorylation. AMPK acti-vation requires phosphorylation on Thr172 within the activation loop of the catalytic α-subunit by upstream kinases, identified as the tumor suppressor serine/threonine kinase 11 (STK11/LKB1) (13–15) and CaMKKβ (16, 17), which is further stimulated by the allosteric activator AMP (11). Activated AMPK switches cells from an anabolic to a catabolic state, shutting down the ATP-consum-ing synthetic pathways and restoring energy balance.
Conflict of interest: The authors have declared that no conflict of interest exists.
Citation for this article: J Clin Invest. 2010;120(7):2355–2369. doi:10.1172/JCI40671.
The glucose-lowering effect of metformin has been mainly attrib-uted to its ability to suppress hepatic gluconeogenesis through the signaling pathway downstream of LKB1 (10). The LKB1 pathway has been reported to regulate the phosphorylation and nuclear exclusion of CREB-regulated transcription coactivator 2 (CRTC2, also referred to as TORC2) (10). CRTC2 has been identified as a pivotal regulator of hepatic glucose output in response to fast-ing by directing transcriptional activation of the gluconeogenic program (18). Under feeding conditions, CRTC2 is sequestered in the cytoplasm; however, in response to fasting stimuli, CRTC2 is dephosphorylated and transported to the nucleus, where it enhances the transcriptional activation of the gluconeogenic genes. This transcriptional coactivator mediates CREB-dependent transcription of PPARγ coactivator–1α (Pgc-1α) and its subsequent gluconeogenic target genes, phosphoenolpyruvate carboxykinase (Pepck) and glucose-6-phosphatase (G6Pase). Phosphorylation on the Ser171 residue of CRTC2 by AMPK and AMPK-related kinases, including the salt-inducible kinases (SIKs), is critical for determin-ing the activity, cellular localization, and degradation of CRTC2 (18–20). However, identification of a second regulatory phosphor-ylation site (Ser275) on CRTC2, mediated by the AMPK-related protein kinase MAP/microtubule affinity-regulating kinase 2 (MARK2), suggests that multiple signaling pathways converge to control CRTC2 activity (21). In addition, recent findings indicate that the regulation of gluconeogenic gene expression by metfor- min is dependent on the phosphorylation of CREB-binding pro-tein (CBP), but not CRTC2, through atypical PKCι/λ (22), suggest-ing the complexity of the mechanism of metformin action.
Since metformin stimulates the activity of AMPK (8) via an LKB1-dependent mechanism, but not AMPK-related kinases in cells (23, 24), we hypothesized that the ability of metformin to sup-press hepatic glucose production is mainly mediated via AMPK. To test this, we employed hepatocytes lacking either AMPKα1α2 catalytic isoforms or LKB1. Here, we report that metformin inhib-its hepatic glucose production through a mechanism linked to perturbation of intracellular ATP levels rather than direct inhibi-tion of gluconeogenic gene expression. Furthermore, we provide genetic evidence that neither AMPK nor LKB1 is essential for met-formin inhibition of hepatic glucose production.
Results
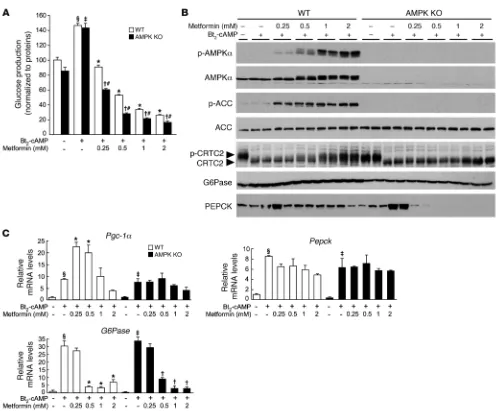
Metformin suppresses hepatic glucose production in the absence of AMPK catalytic subunits. Type 2 diabetic patients on metformin treatment (20 mg/kg) display plasma concentrations of metformin from 10 μM to 40 μM (25). However, it should be noted that the liver receives the majority of its blood via the portal vein, which may con-tain concentrations of metformin substantially higher than those present in the general circulation (26). In addition, due to the high expression of the cationic transporter OCT1 in the liver (7), met-formin accumulates to significantly higher levels in hepatocytes than in plasma (27). Metformin liver concentration of greater than 180 μM and 250 μM in normal and diabetic rodents, respectively, can be achieved after a dose of 50 mg/kg (26). To study the effect of metformin on gluconeogenesis in primary culture of hepatocytes, we chose metformin concentrations between 250 μM and 1 mM, which are probably more related to the range of intrahepatic metfor-min concentrations than those observed in plasma. We found that metformin inhibited cumulative glucose production stimulated by the cAMP analog dibutyryl-cAMP (Bt2
-cAMP) in mouse prima-ry hepatocytes (Figure 1A), consistent with previous findings (8).
Interestingly, the ability of metformin to suppress Bt2
-cAMP–stimu-lated glucose production was maintained in primary hepatocytes lacking both AMPKα1 and -α2 catalytic subunits (AMPKα1α2-null hepatocytes) regardless of the gluconeogenic substrates used (lac-tate/pyruvate or dihydroxyacetone) (Figure 1A and Supplemental Figure 1; supplemental material available online with this article; doi:10.1172/JCI40671DS1). Furthermore, the inhibitory effect of metformin on both basal and cAMP-stimulated glucose produc-tion was observed as early as 4 hours after treatment in control and AMPKα1α2-null hepatocytes (Supplemental Figure 2). Activation of the PKA signaling pathway by Bt2-cAMP was not impaired in the
absence of AMPK or by metformin treatment, as demonstrated by the similarity of phospho-PKA substrate profiles in AMPK-deficient compared with control hepatocytes (Supplemental Figure 3). Of note, a high dose of metformin (>1 mM) slightly affected PKA sig-naling due to an adverse effect on hepatocytes (see below). Although basal glucose production in AMPKα1α2-null hepatocytes tended to be lower compared with that in control hepatocytes (the difference was not statistically significant), Bt2
-cAMP–stimulated glucose pro-duction was increased to levels similar to those in the controls (Figure 1A and Supplemental Figures 1 and 2). However, it should be noted that the inhibitory action of metformin on hepatic glucose produc-tion was much more pronounced in AMPK-deficient hepatocytes, even at the lower doses (Figure 1A and Supplemental Figures 1 and 2). We then examined whether treatment of primary mouse hepatocytes with metformin increased AMPK phosphorylation at Thr172 and its downstream target acetyl-CoA carboxylase (ACC) at Ser79 in a dose- dependent manner (Figure 1B). We observed that metformin treat-ment resulted in a slower mobility of total AMPKα on SDS-PAGE gels, which was consistent with increased Thr172 phosphorylation (Figure 1B). Moreover, PKA activation by Bt2-AMPc did not modify
AMPK phosphorylation in hepatocytes (Figure 1B) unlike adipocytes (28). In AMPKα1α2-null hepatocytes, expression of AMPKα was not detectable, and ACC phosphorylation was completely abolished with or without metformin, which was not due to changes in total ACC protein levels (Figure 1B).
We examined the key signaling step involved in the inhibition of glucose production by metformin by monitoring the phosphory-lation of the transcriptional coactivator CRTC2, a key mediator controlling gluconeogenesis in the liver in response to fasting (18). Exposure of cultured primary hepatocytes to Bt2-cAMP triggered
CRTC2 dephosphorylation, as judged by a faster electrophoretic mobility of total CRTC2 protein on SDS-PAGE, in both wild-type and AMPK-deficient hepatocytes (Figure 1B). Addition of increas-ing concentrations of metformin resulted in a slower migration of CRTC2, indicating enhanced phosphorylation (Figure 1B). The phosphorylation of CRTC2 was lost in AMPKα1α2-null hepatocytes, demonstrating a role for AMPK in CRTC2 phosphory- lation in response to metformin. However, despite a lack of AMPK-induced CRTC2 phosphorylation in AMPKα1α2-null hepatocytes, metformin robustly inhibited glucose production (Figure 1A). These data indicate that metformin inhibits hepatic glucose pro-duction via AMPK- and CRTC2-independent mechanisms.
research article
(Figure 1A). Bt2-cAMP increased the expression of these genes to
similar levels in both AMPKα1α2-null and control hepatocytes (Figure 1C). Following metformin treatment, expression of gene encoding PGC-1α was increased more in control hepatocytes than in AMPKα1α2-null hepatocytes, indicating that Pgc-1α gene expres-sion is controlled by an AMPK-dependent mechanism (Figure 1C). Metformin had differential effects on the expression of the genes encoding the gluconeogenic enzymes G6Pase and PEPCK, although it suppressed glucose production. While metformin inhibited Bt2-cAMP–stimulated G6Pase
gene expression in a concentration-dependent manner, it had only a marginal effect on Pepck gene expression, even at the highest concentration of metformin (Figure 1C). Similar gene expression patterns for G6Pase and Pepck were observed in AMPKα1α2-null hepatocytes treated with metformin (Figure 1C). Changes in PEPCK and G6Pase protein levels were not consistent with the gene transcription data. In control hepatocytes, the amount of G6Pase was increased by Bt2-cAMP and remained
constant despite increasing metformin concentrations (Figure 1B) and severe G6Pase gene repression (Figure 1C). In AMPKα1α2-null
hepatocytes, G6Pase protein levels were lower than those in wild-Figure 1
[image:4.585.44.540.80.491.2]type hepatocytes and were unaffected by Bt2-cAMP or metformin
treatment (Figure 1B). In contrast to unaltered Pepck gene transcrip-tion, PEPCK protein levels were markedly decreased at all doses of metformin in WT hepatocytes, and a complete loss of PEPCK pro-tein was observed in AMPKα1α2-null hepatocytes (Figure 1B).
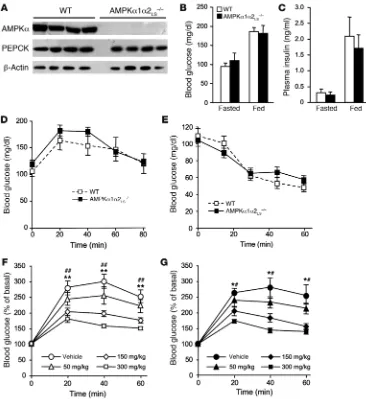
Metformin lowers blood glucose levels in liver AMPK-deficient mice. The principal mechanism by which metformin lowers blood glucose levels in vivo is the suppression of hepatic glucose production (6). Therefore, to investigate the role of AMPK in metformin action, we used mice in which both AMPK catalytic subunits had been deleted in the liver (AMPKα1α2LS–/– mice; ref. 29). Expression of
AMPKα1α2 proteins was undetectable in livers of AMPKα1α2LS–/–
mice (Figure 2A). Fed and fasting blood glucose levels were similar in AMPKα1α2LS–/–
and control mice, as were plasma insulin lev-els (Figure 2, B and C), suggesting normal regulation of glucose homeostasis in these mice. We then determined the role of AMPK in modulating gluconeogenesis in vivo by examining blood glu-cose levels in mice following intraperitoneal injection of pyruvate, a major gluconeogenic substrate. Blood glucose concentrations increased in both AMPKα1α2LS–/– and control mice, although the
differences were not significant (Figure 2D). These results indicate that AMPKα1α2LS–/– mice are as capable of converting pyruvate to
glucose as normal mice, as suggested by comparable levels of the key gluconeogenic enzyme PEPCK in both groups of mice (Figure 2A). Moreover, AMPKα1α2LS–/–
and control mice displayed nor-mal responses to insulin during insulin tolerance tests, indicating unaffected hepatic insulin sensitivity in AMPKα1α2LS–/–
mice (Fig- ure 2E). During oral glucose tolerance tests, blood glucose excur-sion was markedly increased in AMPKα1α2LS–/– and control mice
(Figure 2, F and G), with equivalent increases in plasma insulin levels 20 minutes after glucose load (0.96 ± 0.29 ng/ml insulin in AMPKα1α2LS–/– mice versus 0.97 ± 0.24 ng/ml insulin in WT mice;
n = 4–6). Next, to investigate metformin action in vivo, we examined control and liver AMPK–deficient mice after intragastric administra-tion of increasing doses of metformin (50, 150, and 300 mg/kg) and glucose. These relatively high doses of metformin are necessary in rodents to reach plasma metformin concentrations similar to those found in humans and to produce a therapeutic effect in diabetic animals (30). Oral administration of metformin caused a significant reduction in blood glucose excursion in a dose-dependent manner in control (Figure 2F) but also in AMPKα1α2LS–/– mice (Figure 2G).
[image:5.585.42.408.81.480.2]Plasma insulin levels 20 minutes after glucose load were similar in animals treated with 300 mg/kg metformin (0.63 ± 0.13 ng/ml insu-lin in AMPKα1α2LS–/– mice versus 0.72 ± 0.32 ng/ml insulin in WT
Figure 2
Effects of metformin on blood glucose levels in AMPKα1α2LS–/– mice. (A) Western blot analysis of AMPKα and PEPCK proteins in livers from 24-hour-fasted con-trol and AMPKα1α2LS–/– mice.
β-Actin was immunoblotted as a loading control. Each lane rep-resents the liver sample from an individual mouse. (B) Plasma blood glucose levels were mea-sured in fasted and fed control and AMPKα1α2LS–/– mice. n = 5–6. (C) Plasma insulin levels were mea-sured in fasted and fed control and AMPKα1α2LS–/– mice. Data are mean ± SEM (n = 5–6). (D) Pyruvate tolerance tests (2 g/kg) in control and AMPKα1α2LS–/– mice were used to assess hepatic glu-coneogenesis. n = 6–7. (E) Insu-lin tolerance tests (0.25 U/kg) in control and AMPKα1α2LS–/– mice.
n = 6–9. Metformin tolerance tests in control (F) and AMPKα1α2LS–/– (G) mice. Mice were given an oral gavage dose of 50, 150, or 300 mg/kg metformin or vehicle and after 30 minutes challenged with an oral administration of glucose (3 g/kg body weight).
research article
mice; n = 4–5). The improvement in glucose tolerance by metfor-min treatment was similar in AMPKα1α2LS–/– and control mice,
indicating equivalent sensitivity to metformin. These results are consistent with the data from primary hepatocyte culture and fur-ther support the notion that metformin action on hepatic glucose production is AMPK independent.
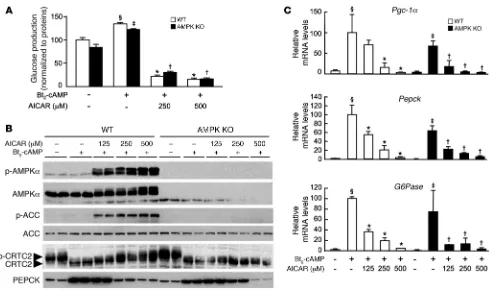
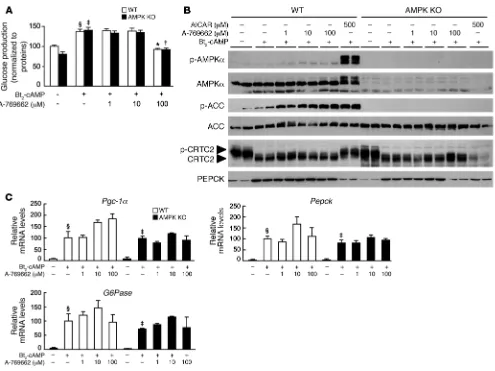
Control of hepatic gluconeogenesis by AICAR and A-769662 in AMPK-deficient hepatocytes. We further explored the molecular mechanisms by which AMPK activators regulate gluconeogenesis by stimulat-ing AMPKα1α2-null and control hepatocytes with Bt2-cAMP in
the presence or absence of increasing amounts of AICAR (5-amino-imidazole-4-carboxamide-1-β-d-ribofuranoside) — a cell-permeable compound that is phosphorylated to AICAR monophosphate (ZMP), a cellular mimetic of AMP (31) — and a small-molecule thienopyridone, A-769662, that directly activates AMPK via an AMP-independent mechanism (32–35). Treatment with AICAR strongly inhibited glucose production in both AMPKα1α2-null and control hepatocytes (Figure 3A). In contrast, A-769662 had no significant effect on glucose production in AMPKα1α2-null and control hepatocytes (Figure 4A). The reduction of glucose production observed at high A-769662 concentration in both
AMPKα1α 2-null and control hepatocytes probably reflects non-specific effects caused by this compound at concentrations higher than 100 μM (M. Foretz, unpublished observations, and ref. 36). Treatment with AICAR induced a dose-dependent increase in the phosphorylation of AMPK and its downstream targets ACC and CRTC2 in control hepatocytes, whereas phosphorylation of these enzymes was completely abolished in AMPKα1α2-null hepatocytes (Figure 3B). In contrast, treatment with A-769662 did not change CRTC2 phosphorylation status (Figure 4B). This may be due to selective action of the compound on specific AMPK heterotrimers, as recently reported (35). Consistent with the above results on glu-cose production (Figure 3A and Figure 4A), AICAR inhibited Bt2
-cAMP–stimulated expression of genes encoding PGC-1α, G6Pase, and PEPCK (Figure 3C) whereas A-769662 had no effect on gluco-neogenic gene expression (Figure 4C).
[image:6.585.49.549.79.376.2]Although A-769662 stimulated phosphorylation of ACC at levels equivalent to AICAR, phosphorylation of AMPK was fairly mod-est (Figure 4B). It was therefore not clear whether AMPK Thr172 phosphorylation was required for A-769662 action. To address this, we monitored ACC phosphorylation in hepatocytes lack-ing LKB1, the upstream kinase involved in the phosphorylation
Figure 3
of Thr172 within the activation loop of the α catalytic subunit kinase domain. In the absence of LKB1, A-769662 was unable to induce ACC phosphorylation (Supplemental Figure 4), indicating that LKB1-mediated AMPK phosphorylation was necessary for A-769662 action in hepatocytes. Recent studies demonstrated that A-769662 mimics the effects of AMP on the AMPK system, but via an AMP-independent mechanism, suggesting that A-769662 binds to an alternate allosteric site (32–34). We investigated this further by evaluating the additive effect of AICAR and A-769662 on AMPK phosphorylation in hepatocytes. In the presence of a saturating concentration of A-769662 (30 μM), AICAR-induced AMPK phosphorylation was further increased, demonstrating a synergic action of these two compounds on AMPK activation (Supplemental Figure 5), reflecting A-769662 protection against
Thr172 dephosphorylation (34). Similarly, AICAR-induced phos-phorylation of AMPK downstream targets ACC and CRTC2 was enhanced in the presence of A-769662 (Supplemental Figure 5).
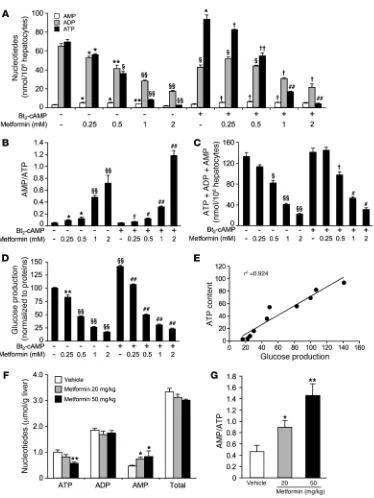
Metformin affects hepatic energy state . Gluconeogenesis is an energy-demanding process, consuming 4 ATP and 2 GTP molecules per molecule of glucose produced. It has been demonstrated that met-formin inhibits complex I of the mitochondrial respiratory chain in isolated hepatocytes (37, 38), increasing the cellular AMP/ATP ratio, which in turn activates AMPK (29). In order to evaluate the regulatory potential of metformin on hepatic energy charge, we assessed adenine nucleotide content in primary hepatocytes isolat-ed from C57BL/6J mice following treatment with increasing doses of metformin and in the presence or absence of Bt2
-cAMP. Stimula-tion of hepatocytes with Bt2-cAMP increased cellular ATP content
[image:7.585.47.542.78.449.2](Figure 5A), as previously described (39). ATP levels were decreased by metformin in a concentration-dependent fashion in both basal
Figure 4
research article
Figure 5
and cAMP-stimulated conditions (Figure 5A), consistent with our previous findings (29). Conversely, AMP levels were increased with metformin, leading to a significant increase in the AMP/ATP ratio in both basal and cAMP-stimulated conditions (Figure 2B). How-ever, it should be noted that there was a significant reduction in total adenine nucleotide content for the highest metformin con-centrations (Figure 5C), indicating an adverse effect of high doses
of metformin on primary hepatocytes. Interestingly, the decrease in intracellular ATP content with metformin treatment (Figure 5A) precisely paralleled the inhibition pattern of metformin on glucose production (Figure 5D). Therefore, a clear relationship (r2 = 0.924) exists between the inhibitory effect of metformin on
glucose production and hepatic ATP content (Figure 5E). To further investigate the effect of metformin on hepatic energy charge in vivo, liver adenine nucleotides were examined in C57BL/6J mice after intragastric administration of low doses of metformin (20 and 50 mg/kg). It has been previously reported that in mice treat-ed with 50 mg/kg metformin, plasma metformin concentrations peaked at 52 and 29 μM in the hepatic portal vein and the inferior vena cava, respectively (26), and are similar to those found therapeu-tically in humans (25). In response to metformin administration, hepatic ATP, ADP, and AMP levels were decreased, unchanged, and increased, respectively, resulting in a 2- to 3-fold increase in AMP/ATP ratio compared with control mice (Figure 5, F and G). In addition, total adenine nucleotide content in the liver was unchanged at either concentration of metformin (Figure 5F). Metformin administration lowered hepatic energy charge from 0.57 ± 0.01 in vehicle-treated mice to 0.51 ± 0.02 (P < 0.05) and 0.46 ± 0.02 (P < 0.005) in 20 mg/kg and 50 mg/kg metformin–treated mice, respectively.
Given that metformin treatment is associated with changes in hepatic energy charge, we hypothesized that metformin inhibits hepatic glucose production in both wild-type and AMPK-deficient hepatocytes through the inhibition of ATP production. Stimula-tion of hepatocytes with Bt2-cAMP increased cellular ATP content
[image:9.585.43.285.85.199.2]in AMPK-deficient hepatocytes to levels similar to those in the con-trols (Figure 6). Cellular ATP content decreased in a dose-dependent manner when control hepatocytes were incubated with metformin and also AICAR (Figure 6), but the AICAR effect was less pro-nounced than that with metformin, as previously described (29, 40). Consistent with previous reports, A-769662 treatment resulted in no significant alteration in cellular ATP levels (Figure 6 and ref. 32).
Figure 6
[image:9.585.231.543.476.740.2]Effects of AMPK activators on intracellular ATP content in WT and AMPK-KO hepatocytes. After attachment, WT and AMPK-deficient primary hepatocytes were cultured for 16 hours in M199 medium con-taining 100 nM dex. Hepatocytes were then incubated in glucose-free DMEM containing lactate/pyruvate (10:1 mM) and 100 nM dex alone or with 100 μM Bt2-cAMP and with or without various concentrations of metformin, AICAR, or A-769662 as indicated. After 8 hours, cells were harvested for ATP content measurement. Results are representative of 6 independent experiments. Data are mean ± SEM. §P < 0.001, ‡P < 0.001 compared with WT and AMPK-KO hepatocytes incu-bated without Bt2-cAMP; *P < 0.05, **P < 0.001 compared with WT hepatocytes incubated with Bt2-cAMP alone; †P < 0.01, ††P < 0.001 compared with AMPK-KO hepatocytes incubated with Bt2-cAMP alone; #P < 0.01 compared with WT hepatocytes incubated under the same conditions.
Figure 7
research article
However, at concentrations greater than 100 μM, ATP levels were slightly decreased in both control and AMPK-deficient hepatocytes, probably due to unknown side effects (M. Foretz, unpublished observations, and ref. 36). When AMPK-deficient hepatocytes were treated with metformin or AICAR, ATP levels dropped consider-ably more than in control hepatocytes (Figure 6), indicating the crucial role of AMPK in restoring the intracellular energy balance following reduction in ATP levels. Together, these results suggest that the effect of metformin on hepatocytes is linked to changes in intracellular ATP content.
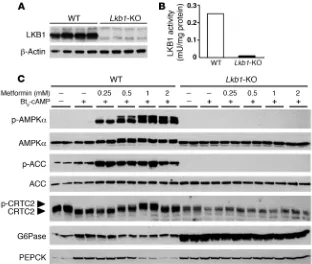
Metformin suppresses hepatic gluconeogenesis in the absence of LKB1. We investigated the role of LKB1 in the action of metformin on hepatic glucose production by using hepatocytes from liver-spe-cific Lkb1-KO mice. The Lkb1 gene was deleted in adult mouse liver by injection of an adenovirus expressing Cre recombinase in
Lkb1-floxed mice (41). Western blot analysis confirmed a complete loss of LKB1 expression in hepatocyte primary cultures from liver-specific Lkb1-KO mice (Figure 7A). Accordingly, no LKB1 activity was detected in LKB1-deficient hepatocytes (Figure 7B). To deter-mine whether lack of LKB1 affected AMPK activation, we treated
LKB1-deficient and control hepatocytes with increasing concen- trations of metformin. Metformin robustly increased AMPK phos-phorylation at Thr172, the site of LKB1 phosphorylation, as well as ACC phosphorylation at Ser79 in control hepatocytes (Figure 7C). In contrast, in LKB1-deficient hepatocytes, metformin failed to induce detectable AMPK and ACC phosphorylation, although AMPK and ACC proteins were expressed normally (Figure 7C).
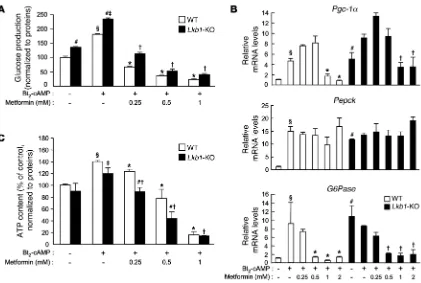
We next explored the capacity of LKB1-deficient and control hepatocytes to produce glucose in response to metformin treatment. The absence of LKB1 greatly increased basal glucose production to levels similar to those observed with Bt2
-cAMP stimulation in con-trol hepatocytes (Figure 8A). Bt2
-cAMP stimulation increased glu- cose production even further in LKB1-deficient hepatocytes to lev-els higher than those in Bt2-cAMP–stimulated control hepatocytes
(Figure 8A). Treatment with metformin inhibited Bt2
-cAMP–stim-ulated glucose production in a dose-dependent manner in both LKB1-deficient and control hepatocytes (Figure 8A).
[image:10.585.84.505.80.363.2]To study the influence of LKB1 deficiency on gluconeogenesis, we examined the expression of key gluconeogenic genes in response to metformin. Under basal conditions, expression of the genes
Figure 8
encoding PGC-1α, G6Pase, and PEPCK was markedly increased in LKB1-deficient compared with control hepatocytes (Figure 8B). Bt2-cAMP stimulation further increased expression of the gene
encoding PGC-1α, but not G6Pase and PEPCK, in LKB1-deficient hepatocytes (Figure 8B). Despite enhanced Pgc-1α gene expression after metformin treatment in LKB1-deficient hepatocytes, expres-sion of the G6Pase gene was inhibited, whereas Pepck mRNA levels remained unaffected (Figure 8B). At the protein level, amounts of G6Pase and PEPCK were considerably increased under basal con-ditions and were not altered by metformin treatment (Figure 7C). We next examined whether CRTC2 phosphorylation was affected in LKB1-deficient hepatocytes with or without metformin. In con-trast to the results obtained with AMPK-deficient hepatocytes, CRTC2 appeared to be predominantly dephosphorylated in basal conditions in LKB1-deficient hepatocytes, consistent with a faster electrophoretic mobility of CRTC2 from LKB1-deficient
hepatocytes than that from control hepatocytes (Figure 7C). Met-formin failed to induce CRTC2 phosphorylation in the absence of LKB1 (Figure 7C). The CRTC2 protein content was lower in LKB1-deficient hepatocytes than in the control hepatocytes. These data show that deletion of LKB1 enhanced gluconeogenesis in basal conditions, whereas LKB1 was dispensable for the inhibitory effect of metformin on gluconeogenesis.
Control of hepatic gluconeogenesis by AICAR in the absence of LKB1 . Isolat-ed hepatocytes from liver-specific Lkb1-KO mice were stimulated with Bt2-cAMP and incubated with increasing concentrations of AICAR to
[image:11.585.105.487.83.419.2]examine the role of LKB1 in AICAR-induced inhibition of hepatic glu- coneogenesis. Stimulation of glucose production was markedly atten-uated by AICAR in a dose-dependent manner in both LKB1-deficient and control hepatocytes (Supplemental Figure 6A). We then exam-ined whether LKB1 was involved in the AICAR activation of AMPK by measuring levels of phosphorylated AMPK and ACC. As shown in Supplemental Figure 6B, AICAR-induced phosphorylation of both AMPK and ACC was abolished in the absence of LKB1. Similarly,
Figure 9
research article
CRTC2 phosphorylation was absent in LKB1-deficient hepatocytes treated with AICAR (Supplemental Figure 6B). In LKB1-deficient hepatocytes, Pgc-1α, G6Pase, and Pepck gene expression was decreased by AICAR in a pattern similar to that observed in control hepatocytes (Supplemental Figure 6C). These results indicate that AICAR action on hepatic gluconeogenesis is LKB1 independent.
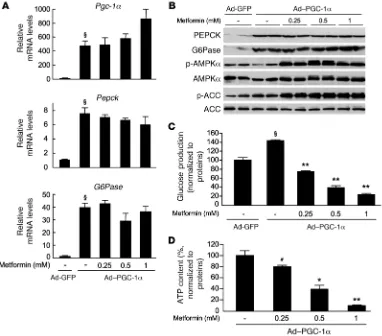
Metformin suppresses hepatic glucose production without affecting gluco-neogenic gene expression. It has been suggested that metformin acts upstream of PGC-1α to inhibit hepatic glucose production by acti-vating AMPK via LKB1 (10, 22). We reasoned that the overexpression of PGC-1α could bypass the inhibitory effect of metformin on hepat-ic glucose production. To test this hypothesis, we infected wild-type hepatocytes with an adenovirus encoding PGC-1α and measured the effects of metformin on gluconeogenesis. As expected, PGC-1α over-expression led to upregulation of Pepck and G6Pase gene expression (Figure 9A). In addition, overexpression of PGC-1α resulted in an increase in PEPCK and G6Pase protein levels (Figure 9B) and glucose production (Figure 9C). Incubation with increasing concentrations of metformin increased AMPK and ACC phosphorylation in a dose-dependent manner but was unable to repress gluconeogenic gene expression (Figure 9A). Importantly, under these conditions, met- formin still inhibited glucose production, indicating that metfor-min suppresses gluconeogenesis independently of PGC-1α through a transcription-independent process. Again, inhibition of glucose production by metformin was associated with a significant decrease in ATP content in a dose-dependent manner (Figure 9D).
Discussion
Increased hepatic glucose production is a major cause of hyper-glycemia in type 2 diabetes. Metformin has been used for decades to improve glycemic control in diabetic patients and is thought to decrease blood glucose levels by reducing hepatic glucose output (4, 5). While metformin is currently the drug of choice for the treat-ment of type 2 diabetes, the precise mechanisms of its molecular action are not well understood. The most widely accepted mecha-nism of metformin action is the inhibition of transcription of key gluconeogenic genes in the liver (10, 22). It has been proposed that metformin stimulates CRTC2 phosphorylation in response to met-abolic signals such as energy stress through the LKB1-AMPK/SIK1 pathways, which promotes binding to 14-3-3 proteins, thereby sequestering CRTC2 from the nucleus to the cytoplasm (10, 18). If this is the case, genetic deletion of AMPK or LKB1 would be expected to lead to altered CRTC2 regulation. Under basal condi-tion, the levels of CRTC2 phosphorylation as well as the levels of PEPCK and G6Pase were similar in AMPKα1α2-null and control hepatocytes. In contrast, in LKB1-deficient hepatocytes, CRTC2 was markedly dephosphorylated, and this was associated with a dramatic increase in the expression of gluconeogenic genes with-out cAMP stimulation. Lack of CRTC2 phosphorylation by the LKB1-regulated protein kinases SIK1 (20) and MARK2 (21) at dis- tinct regulatory sites could explain the phosphorylation-depen-dent mobility shift of CRTC2 and the activation of gluconeogenic genes. Thus, our data show LKB1-dependent, but AMPK-indepen-dent, phosphorylation and regulation of basal CRTC2 activity in primary hepatocytes. Normal fasted glycemia and glucose toler-ance in AMPKα1α2LS–/– mice support these data (Figure 2, B, F,
and G). This is quite different from results from mice with LKB1- deficient livers, which exhibit hyperglycemia and glucose intoler-ance (10), indicating the critical role of LKB1-dependent pathway, but not AMPK in the liver in the control of gluconeogenesis.
We demonstrated that the metformin-induced phosphorylation of CRTC2 was abolished in hepatocytes lacking AMPK and LKB1 (Figure 1B and Figure 7C), indicating that upon stimulation, LKB1 and AMPK pathways could both regulate CRTC2 activity. Unex- pectedly, in the absence of CRTC2 phosphorylation, hepatic glu-cose production was still repressed by metformin in both AMPK- and LKB1-deficient hepatocytes. In addition, the repression of
G6Pase gene expression in response to metformin treatment was preserved in hepatocytes deleted for AMPK or LKB1 (Figure 1C and Figure 8B). These results suggest that phosphorylation of CRTC2 by AMPK is not required in order to cause the inhibition of G6Pase gene expression by metformin. Thus, alternative path-ways are likely to be involved in the control of gluconeogenesis by metformin. In support of this hypothesis, recent data indicated that metformin inhibits gluconeogenesis independent of CRTC2 phosphorylation at Ser171. The importance of CBP phosphory-lation in the therapeutic effects of metformin was highlighted (22). The action of metformin was shown to be mediated through activation of aPKCι/λ, which phosphorylates CBP at Ser436, and disrupts the transcriptionally active CREB-CBP-CRTC2 complex, leading to the repression of gluconeogenic gene expression (22). It has been suggested that the CREB-CBP-CRTC2 complex functions as a regulator of gluconeogenesis, and it is therefore reasonable to assume that multiple signaling pathways regulate the cellular activity of this complex.
Our results indicate that metformin may inhibit glucose pro- duction independent of transcriptional repression of gluconeo-genic genes. Indeed, significant reduction in glucose production occurred at concentrations of metformin of 0.25 mM in control, AMPK-, and LKB1-deficient hepatocytes, while the expression of
Pepck and G6Pase genes was not affected (Figure 1, A and C, and Figure 8, A and B). In particular, metformin had no significant effect on Pepck gene expression in control, AMPK-, and LKB1-deficient hepatocytes (Figure 1C and Figure 8B). Similarly, a lack of regulation of Pepck gene expression was recently reported fol-lowing 1 and 5 days of metformin treatment in diabetic ob/ob mice despite a significant reduction in blood glucose levels (32). However, metformin decreased G6Pase gene expression consider-ably in control, AMPK-, and LKB1-deficient hepatocytes, but this decrease was not associated with a significant change in G6Pase protein levels (Figure 1B and Figure 7C). This suggests that repression of G6Pase gene expression alone could not explain the inhibitory effect of metformin on glucose production. Moreover, we demonstrated a substantial reduction in glucose production with metformin treatment, despite forced expression of key glu-coneogenic genes through PGC-1α overexpression (Figure 9C). These data conflict with the recently reported mechanism of metformin action, which involves the disassembly of the CREB-CBP-CRTC2 transcription complex at Pgc-1α and Pepck promot-ers (22). Thus, we consider that metformin action is related to a negative action on gluconeogenic flux rather than direct inhibi- tion of gluconeogenic gene expression. The suppression of hepat-ic glucose production by metformin in insulin-resistant high-fat diet–fed rats is dependent on an inhibition of the substrate flux through G6Pase, and not on a decrease in the amount of enzyme (42), which supports our conclusion.
of NO, ceramide, and oxygen radicals, or Ca2+ homeostasis (37).
Although the exact pathway involved in the metformin inhibition of complex I is not well understood, it is thought that inhibition of gluconeogenesis by metformin, in intact animals and in isolated hepatocytes, results from a disruption of energy metabolism (37, 38). Supporting this hypothesis, previous work demonstrated a marked reduction of ATP/ADP ratio in both cytosolic and mito-chondrial compartments in rat hepatocytes exposed to metformin (37, 38, 43). Moreover, ATP levels were significantly decreased after treatment of primary hepatocytes with 0.25 mM metformin (Fig-ures 5 and 6), and were substantially equivalent to those present in the liver of metformin-treated mice (26). Of note, at higher con-centrations, metformin has adverse effect on hepatocytes, since it significantly decreases total adenine nucleotide pools (Figure 5C). This adverse effect is reminiscent of an occasional side effect of metformin: the production of lactic acidosis by increased glyco-lytic activity in diabetic patients, which occurs if inhibition of the respiratory chain by the drug treatment becomes excessive. Indeed, severe lactic acidosis was the reason for withdrawal of the more potent phenformin as a clinical antidiabetic. Metformin-induced changes in the hepatic energy charge also occur in vivo, as demon-strated by the substantial increase in AMP/ATP ratio in the livers of mice after administration of 20 mg/kg metformin, a dose typically used clinically (Figure 5G). In addition, another study reported a decrease in ATP/ADP ratio in the liver of rats treated with metfor- min (38). This strongly suggests that metformin indirectly stimu-lates AMPK through a decrease in ATP levels. The fall in ATP was more pronounced in AMPKα1α2-null than in control hepatocytes, resulting in the marked inhibition of glucose production (Figure 1A, Figure 6, and Supplemental Figure 2). This could be related to the decrease in mitochondrial content observed in AMPK-defi-cient hepatocytes (29), suggesting an apparent alteration of the mitochondrial biogenesis program in the absence of AMPK. This notion was further supported by the observation of AMPK-depen-dent regulation of Pgc-1α gene expression by metformin (Figure 1, A and C). This may be linked to the critical role of AMPK in cel-lular adaptation during energy deficiency of various origins, but is probably the result of impaired mitochondrial biogenesis due to a lack of increase in PGC-1α expression and activity (44, 45). Therefore, we suggest that the fall in ATP concentration is suf- ficient to explain the inhibition of glucose production by metfor-min, without alteration in the expression of key enzymes involved in gluconeogenesis. In addition, as ATP and AMP vary recipro-cally in the cell due to the reaction catalyzed by adenylate kinase (2ADP ↔ ATP + AMP), which is maintained close to the equilib-rium, AMP tends to rise whenever ATP falls (Figure 5, A and F). AMP is a potent allosteric inhibitor of fructose 1,6-bisphospha- tase, a key enzyme in gluconeogenesis (32). Therefore, metformin-induced inhibition of glucose output could be attributable to both ATP depletion and a concomitant rise in AMP intracellular levels.
The rate of hepatic glucose production is closely linked to hepatic energy metabolism, and disruption of the principal source of ener-gy in the hepatocytes (mitochondrial oxidative phosphorylation) would have a profound effect on the flux through gluconeogenesis (Figure 5E and refs. 46, 47). This is reminiscent of the observed defects in hepatic gluconeogenesis in both Pgc-1α- and Ppara-KO mice (48, 49). For instance, impaired hepatic energy production in the absence of PGC-1α inhibited the energetically costly process of gluconeogenesis and did not correlate with altered expression of key enzymes involved in gluconeogenesis.
We clearly showed that AICAR-induced inhibition of hepatic glucose production and gluconeogenic gene expression was inde-pendent of AMPK activity (Figure 3A). Similar results have been reported in studies on hepatocytes derived from the regulatory subunit AMPKβ1-deleted animals (35). Different mechanisms have been proposed to explain the AMPK-independent effect of AICAR on hepatic glucose production. AICAR does not activate AMPK directly and has to be converted to the AMP analog ZMP. Intracellular accumulation of ZMP has been reported to directly modulate fructose 1,6-bisphosphatase and gluconeogenic flux (50). Furthermore, there is evidence that AICAR inhibits mito-chondrial oxidative phosphorylation and thus causes a decrease in ATP content in primary hepatocytes (29, 40, 51). Unlike AICAR, A-769662 is a direct and potent activator of AMPK (32, 33) that does not cause significant alterations in AMP/ATP ratio in cells or inhibit fructose 1,6-bisphosphatase in cell-free assays (32, 36). It was therefore surprising that A-769662 did not inhibit glucose production and gluconeogenic gene expression in hepatocytes (Figure 4, B and C). Our results conflict with a previous report showing a blood glucose–lowering effect of A-769662 in obese
ob/ob mice (32). However, since A-769662 treatment was shown to dramatically reduce hepatic steatosis in these mice (32), a reduc- tion in hepatic lipid content may have enhanced insulin sensi-tivity and thus insulin action in the liver, improving the control of hepatic glucose production. This hypothesis may also offer a potential explanation for why in liver-specific Lkb1-KO mice fed a high-fat diet, treatment with metformin failed to induce lower-ing of blood glucose levels (10). Indeed, in this study, it is difficult to establish whether metformin acts directly on the regulation of gluconeogenesis or indirectly by improving liver steatosis imposed by high-fat diet (thereby reducing lipotoxicity and insulin resis-tance known to enhance hepatic glucose production). Accordingly, evidence that metformin improved fatty liver disease, reversing hepatic steatosis in ob/ob mice (32, 52) but also in rodents fed a high-fat diet (53), has been reported. Metformin-induced reduc-tion in hepatic lipid content is consistent with an increase in fatty acid oxidation presumably acting through hepatic AMPK activa- tion (32, 54). Thus, impaired metformin-induced AMPK phos-phorylation in the absence of LKB1 (10) blunts the improvements in hepatic lipid content and insulin sensitivity in LKB1-deficient mice, impeding the expected normalization of blood glucose lev-els. Importantly, these observations call into question the action of AMPK in direct control of hepatic gluconeogenesis. In response to prolonged fasting, the liver is the main source of energy substrates for extrahepatic organs to maintain the whole-body energy bal-ance. It produces ketone bodies and glucose by hepatic β-oxidation and gluconeogenesis, respectively. It has been demonstrated that during the fed-starved transition, AMPK is activated in the liver and contributes to the switch between lipogenesis and β-oxidation as a result of its energy sensor function (55). In contrast, AMPK- mediated inhibition of hepatic glucose production during fast-ing may appear paradoxical when blood glucose levels should be maintained in a narrow range. Indeed, it is intuitively appealing to hypothesize that maintenance of glycemia must take precedence over hepatic energy balance during prolonged fasting. Thus, fur-ther study is required to clarify the direct role of AMPK in the liver in regulating hepatic glucose production.
research article
AMPK in the control of basal hepatic glucose production. We also provide evidence that metformin inhibits gluconeogenesis through LKB1- and AMPK-independent pathways. The metformin-induced inhibition of glucose production occurs through regulation of the gluconeogenesis flux rather than direct inhibition of gluconeogenic gene expression. Moreover, we show that the control of hepatic glu- cose production by metformin is linked to the inhibition of gluco-neogenesis in response to a decrease of the hepatic energy state. Our data and recent findings (56, 57) suggest that the development of small molecules targeting mitochondrial function in the liver, thus causing a moderate variation in hepatic energy charge, is an attrac-tive therapeutic strategy for the treatment of type 2 diabetes.
Methods
Animals. Mice were maintained under a 12-hour light/12-hour dark cycle with free access to water and standard mouse diet (in terms of energy: 65% carbohydrate, 11% fat, 24% protein). C57BL/6J mice were obtained from Charles River Laboratories France. Mice lacking both AMPKα1 and AMPKα2 catalytic subunits were generated by crossing AMPKα1–/– and
liver-specific AMPKα2–/– mice as previously described (29). For hepatic
Lkb1 gene deletion, Lkb1 -floxed mice (41) were anesthetized with isoflu-rane and were injected with adenovirus Cre-GFP or adenovirus GFP into the penis vein (5 × 10⁸ PFU/mouse). Littermates from the same breeding
pair were used in these experiments. Hepatocytes were isolated and cul-tured 2 weeks after adenovirus injection. All procedures were performed in accordance with the principles and guidelines established in the Euro-pean Convention for the Protection of Vertebrate Animals Used for Experimental and Other Scientific Purposes (Council of Europe, ETS no. 123, 1991). Ani-mal studies described herein were reviewed and approved (agreement no. 75-886) by the Directeur Départemental des Services Vétérinaires of the Préfecture de Police de Paris.
Glucose, insulin, metformin, and pyruvate tolerance tests . Oral glucose toler-ance tests were performed on age-matched male mice fasted for 16 hours as previously described (58). Blood glucose levels were determined at 0, 20, 40, and 60 minutes after oral administration of glucose (3 g/kg body weight) using a glucometer (Glucotrend II; Roche Diagnostics). For metformin tolerance tests, mice fasted for 16 hours were given an oral gavage dose of 50, 150, or 300 mg/kg metformin and then after 30 minutes challenged with an oral administration of glucose (3 g/kg body weight). For insulin tolerance tests, animals fasted for 5 hours were injected intraperitoneally with insulin (0.25 U/kg body weight; Actrapid, Novo Nordisk), and blood glucose levels were measured at 0, 15, 30, 45, and 60 minutes after injec-tion. For pyruvate tolerance tests, animals fasted for 16 hours were injected intraperitoneally with pyruvate (2 g/kg body weight) dissolved in saline, and blood glucose levels were measured as above.
Plasma glucose and insulin levels. Blood glucose and insulin levels of mice fed ad libitum or fasted were analyzed. We collected blood from mice in the fed state, at 9:00 p.m. by tail bleeding (58). For fasting experiments, food was removed at 5:00 p.m., and the mice were kept in a clean new cage for 5 hours before blood collection (58). Serum insulin concentrations were assessed using a rat or mouse insulin ultrasensitive enzyme-linked immuno-sorbent assay kit with mouse insulin as standard (Crystal Chem).
Adenoviruses. Adenovirus expressing mouse PGC-1α was generated as described by He et al. (59). Briefly, the PGC-1α cDNA was amplified by PCR from mouse liver cDNA then subcloned into the shuttle vector pAdTrack-CMV. The resultant plasmid was linearized by the restriction endonuclease PmeI and used to transform the Escherichia coli strain BJ5183-AD1 (Strata-gene) containing the supercoiled adenoviral vector pAd-Easy1. Recombinants were selected by kanamycin resistance and screened by restriction endonucle-ase digestion. The recombinant adenoviral construct was digested with PacI
and used to transfect the packaging cell line Ad-293 (Stratagene) with Lipo-fectamine 2000 (Invitrogen) to produce virus. Ad-Cre-GFP was a gift from S. Colnot (INSERM U1016, Paris, France) (60). Adenovirus expressing GFP was used as a control. Adenoviruses were propagated in Ad-293 cells and purified by cesium chloride density centrifugation as previously described (61).
Primary mouse hepatocytes. Primary hepatocytes were isolated from fed adult mice by a modified version of the collagenase method (62). The cells were plated in M199 medium supplemented with 100 U/ml penicillin, 100 μg/ml streptomycin, 0.1% bovine serum albumin, 2% Ultroser G (Biosepra), 500 nM dexamethasone (dex; Sigma-Aldrich), 100 nM triiodothyronine (Sigma-Aldrich), 10 nM insulin (Actrapid, Novo Nordisk), at a density of 2.5 × 10⁵
cells/well on 6-well plates or 2.5 × 10⁶ cells/100-mm-diameter cell culture plate.
After attachment (3–4 hours), hepatocytes were maintained in M199 medium with antibiotics and 100 nM dex for 16 hours, followed by drug treatment as described below. For experiments with adenovirus, hepatocytes were infected with 25 PFU/cell of Ad-GFP or Ad–PGC-1α after the attachment period in M199 medium containing antibiotics and 100 nM dex for 16 hours.
Hepatocyte glucose production. Primary mouse hepatocytes on 6-well plates (2.5 × 10⁵
cells/well) were maintained in M199 medium containing antibi- otics and 100 nM dex for 16 hours prior to the measurement of glucose pro-duction. Hepatocytes were washed once with PBS, and glucose production was determined after a 4-, 8-, or 12-hour incubation period in glucose-free DMEM containing lactate/pyruvate (10:1 mM) or 10 mM dihydroxyacetone and 100 nM dex alone or with 100 μM Bt2-cAMP (Sigma-Aldrich) and with
various doses of metformin (Sigma-Aldrich), AICAR (Toronto Research Chemicals), or A-769622 as indicated in the figure legends. A-769662 com- pound was synthesized as described previously (33). At the end of the incu-bation period, 1 or 1.5 ml of medium was collected and mixed with 0.2 ml HClO4 (40% v/v). After neutralization, the amount of glucose released into
the medium was determined by evaluating the production of NADPH from NADP in the presence of hexokinase and glucose-6-phosphate dehydroge-nase (Roche) and normalized to the total protein content per well.
Measurement of adenine nucleotide levels. Adenine nucleotide concentrations were determined in cell extracts prepared from cultured hepatocytes or from liver samples by an enzymatic method (63). Primary hepatocytes were treated as described in the figure legends, the culture medium was removed, and cells on 100-mm-diameter cell culture plates (2.5 × 10⁶ cells/plate) were
scraped into 200 μl of 6% (v/v) ice-cold HClO4 in less than 5 seconds. For
liver, 10-week-old C57BL/6J male mice were treated by oral intubation with 20 or 50 mg/kg metformin in water (200 μl) or just water directly into the stomach for 5 consecutive days. On the fifth day, 24-hour-fasted mice were sacrificed by cervical dislocation 1 hour after metformin administration, and liver was extracted and frozen in liquid nitrogen in less than 25 seconds. Two hundred milligrams of liver was homogenized into 1 ml of 6% (v/v) ice-cold HClO4. Cell extracts were centrifuged at 10,000 g for 10 minutes
at 4°C. The acid supernatant was neutralized and used for spectropho-tometric determination of adenine nucleotides. Standard curves for ATP, ADP, and AMP were constructed with 25, 50, 75, 100, 125, and 150 μM of each nucleotide. Adenine nucleotide levels were expressed in nmol/106
hepatocytes, μmol/g liver weight, or percentage of control normalized to protein content. Energy charge was calculated by the following equation: [ATP + ADP/2]/[ATP + ADP + AMP], where AMP, ADP, and ATP are the respective tissue concentrations (64).