© 2016, IRJET | Impact Factor value: 4.45 | ISO 9001:2008 Certified Journal | Page 435
Optimization of process parameter for maximizing Material removal
rate in turning of EN8 (45C8) material on CNC Lathe machine using
Taguchi method
Sachin goyal
1, Pavan Agrawal
2, Anurag Singh jadon
3, Mukesh hemnani
4, Promise Mittal
51,3,4
Research Scholar, Dept. Of Mechanical Engineering, Vikrant Institute of Technology & Management, Gwalior
2, 5
Assistant Professor, Dept. Of Mechanical Engineering, Vikrant Institute of Technology & Management, Gwalior
---***---Abstract -
In today’s era of mass manufacturing, MRR(material removal rate) is of primary concern using CNC (computer numerical controlled) machines. In this paper Taguchi method has been employed with L9 Orthogonal Array for three parameters RPM, Feed and Depth of cut. For each of these parameters three different levels have been identified and used to perform the turning operation for the maximization of material removal rate on 2D CNC lathe. The material selected for machining was EN 8 Bright bar with carbide cutting tool. The MRR is observed as the objective to develop the combination of optimum cutting parameters. This research proposes an optimization approach using orthogonal array(L9) for the maximizing MRR and the result from this study confirms the same. This study also produced a predictive equation for Determining MRR with a given set of parameters in CNC turning operation. Thus, with the proposed optimal parameters it is possible to increase the efficiency of machining process and decrease production cost in an automated manufacturing environment
.
Key Words
:
Material removal rate(MRR),CNC Lathe,
Turning operation, Design of experiments (DOE),Orthogonal array(L9) Taguchi method, S/N ratio.
1.INTRODUCTON
Today, CNC machining has grown to be an indispensible part of machining industry. The accuracy, precision achieved through CNC could not be achieved by the conventional manufacturing machines. But still there is a room for errors in a CNC machine and it basically depends on the skill and experience of the worker to get the dimensions
© 2016, IRJET | Impact Factor value: 4.45 | ISO 9001:2008 Certified Journal | Page 436
types of seeds used and many other factors. It is also used bythe weather department in forecasting of the various environmental conditions. And, in the field of Science and Engineering, it is used for obtaining optimal results based on the various engineering inputs. Thus, the Taguchi approach has a wide variety of applications in the different fields because of its easiness and optimized results [11] However, even being having a lot of advantages , it suffers from a major disadvantage that the results obtained are only relative to the levels selected and do not exactly indicate the effect of entire range of each parameter on the performance characteristic value. They also do not test the output for all the combinations of input variables as the combination selected here is limited. Moreover, major disadvantage of the Taguchi method is that it is not a dynamic process i.e. it is not concerned with those variables which discretely or continuously change their values from time to time. Thus, it deals with mostly the static variables i.e. variables whose values are not time dependent. Moreover, it deals with designing of the quality rather than improving the quality. Because of this, they are applied in the industries at the early stages only [12] However, despite of all these disadvantages, it is used widely in the different areas very effectively. To reduce the error while using an increased number of inputs, the orthogonal matrix of Taguchi can be used, which is selected as per the requirements of the person. In this work L9 Orthogonal Array was used to obtain optimized economical results. The Taguchi method for the Design of Experiments also emphasizes over the use of Loss function, which is the deviation from the desired value of the quality characteristics. Based on these Loss functions, the S/N ratio for each experimental set is evaluated and accordingly the optimal results are derived. Minitab software is then used for the results and finally, the confirmations results are obtained between the experimental values and the determined values.
2. TAGUCHI METHOD
Basically, traditional experimental design procedures are too complex and not easy to use. A large number of experimental
[image:2.595.313.541.387.745.2]works have to be carried out when the number of the process parameters increases with their levels. To solve this problem, the Taguchi method uses a special design of orthogonal arrays to study the entire parameter space with only a small number of experiments. The greatest advantage of this method is to save the effort in performing Experiments: to save the experimental time, to reduce the cost, and to find out significant factors fast. Taguchi robust design method is a most powerful tool for the design of a high-quality system. He considered three steps in a process’s and product’s development: system design, parameter design, and tolerance design. In system design, the engineer uses scientific and engineering principles to determine the fundamental configuration. In the parameter design step, the specific values for system parameters are determined. Tolerance design is used to determine the best tolerances for the parameters[14]
FIG. Flow chart of Taguchi method [14]
Determining of Quality Characteristics which required for optimization
Identify the noise factor and test condition
Identify the control factors and their different levels
Develop the design matrix
Conduction of experiments
Analyze the data and determining the optimum levels of the control factors
© 2016, IRJET | Impact Factor value: 4.45 | ISO 9001:2008 Certified Journal | Page 437
Taguchi method is a powerful design of experiments (DOE)tool for optimization of engineering processes, in which the concept of S/N ratio is used for the improvement of quality.
3. EXPERIMENTAL DETAILS
The experiments are performed on CNC lathe MCL 12 selected. The tool and material selected were carbide tool and mild steel EN8 Bright bar respectively. Three process parameters, as, Cutting speed (A), Feed rate (B) and Depth of cut (C) were considered in the study. Equally spaced three levels within the operating range of the input parameters were selected for each of the process parameters. Based on Taguchi method, an L9 orthogonal array (OA) which has 9 different experiments at three levels was developed. Table3.1 shows the design factors along with their levels.
Table3.1 Parameters and Their Levels for Experiment
S.No Parameter L1 L2 L3
1 Cutting speed(A)
600 900 1200
2 Feed Rate(B) 0.15 0.20 0.25
3 Depth of Cut(C)
0.1 0.2 0.3
Table3.2 Orthogonal Array[L9]
Experiment no Level 1 Level 2 Level 3
1 1 1 1
2 1 2 2
3 1 3 3
4 2 1 2
5 2 2 3
6 2 3 1
7 3 1 3
8 3 2 1
9 3 3 2
Larger is better S/N =-10 log [1/n (Σ1/yi2)]
Table 3.3 Experimental values
Exp
no.
A(RPM
) B(m
m/re
v)
C(mm
)
MRR
(mm3/min)
S/N Ratio
1
600
0.15
0.1
562.659 55.00490
5
2
600
0.20
0.2
1492.88 63.48049
8
3
600
0.25
0.3
2785.02 68.89656
6
4
900
0.15
0.2
1679.49 64.50354
8
5
900
0.20
0.3
3342.02 70.48018
0
6
900
0.25
0.1
1406.64 62.96365
9
7
1200
0.15
0.3
3342.02 70.48021
0
8
1200
0.20
0.1
1500.42 63.52425
6
9
1200
0.25
0.2
3732.21 71.43932
1
Table3.4 Mean response table for material
removal rate(MRR)
S.No Parameter L1 L2 L3
1 Cutting speed(A)
1613.51 2142.71 2858.21
2 Feed
Rate(B)
3722.77 2111.773 2641.29
3 Depth of Cut(C)
© 2016, IRJET | Impact Factor value: 4.45 | ISO 9001:2008 Certified Journal | Page 438
Table 3.5 S/N ratio table for material removal
rate(MRR)
S.No Parameter L1 L2 L3
1 Cutting speed(A)
62.46 65.98 68.48
2 Feed Rate(B) 63.32 65.82 67.76 3 Depth of
Cut(C)
60.49 66.47 69.95
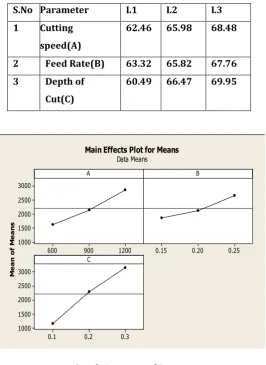
1200 900 600 3000 2500 2000 1500 1000 0.25 0.20 0.15 0.3 0.2 0.1 3000 2500 2000 1500 1000 A M e a n o f M e a n s B C
Main Effects Plot for Means Data Means
Graph 1: means of Responce
1200 900 600 70.0 67.5 65.0 62.5 60.0 0.25 0.20 0.15 0.3 0.2 0.1 70.0 67.5 65.0 62.5 60.0 A M e a n o f S N r a ti o s B C
Main Effects Plot for SN ratios
Data Means
Signal-to-noise: Larger is better
Graph 2: Means of S/N ratio
4. Development Mathematical Modeling
Regression analysis is performed to find out the relationship between factors and Material removal rate. In conducting regression analysis, it is assumed that factors and the response are linearly related to each other. A multiple regression technique was used to formulate the Cutting speed, feed rate and depth of cut to the Material removal rate. The response function representing the material removal rate can be expressed as: Material removal rate = f (Cutting speed, feed rate and depth of cut). This equation can also be written as:
The regression equation is
MRR = - 3222 + 2.07 A + 7799 B + 9999 C
Predictor Coef SE Coef T-factor P-factor Constant -3221.8 791.7 -4.07 0.010 A 2.0745 0.4845 4.28 0.008
B 7799 2907 2.68 0.044
C 9999 1454 6.88 0.001
S = 356.043 R-Sq = 93.6% R-Sq(adj) = 89.7%
5. Response Graphs for Means
5.1 Level [3] for cutting speed A3 = 2858.21mm3/min
indicated as the optimum situation in terms of Material removal rate(MRR) values.
5.2 Level [1] for feed rate B1 = 3722.77mm3/min indicated
as the optimum situation in terms of material removal rate(MRR) values.
5.3 Level [3] for depth of cut C1 = 3156.35 mm3/min
indicated as the optimum situation in terms of material removal rate (MRR)values.
© 2016, IRJET | Impact Factor value: 4.45 | ISO 9001:2008 Certified Journal | Page 439
References
[1]Sayak Mukherjee, Anurag Kamala, Kaushik Kumar Optimization of Material Removal Rate During Turning of SAE 1020 Material in CNC Lathe using Taguchi Technique GCMM 2014 Procedia Engineering 97 ( 2014 ) 29 – 35 [2]Yang, W. H., & Tarng, Y. S. (1998).Design optimization of cutting parameters for turning operations based on the Taguchi method. Journal of Materials Processing Technology, 84(1), 122-129
[3] Meng, Q., Calculation of optimum cutting condition for turning operation using a machining theory, Int. J. Mach. Tool Manuf. 40, 1709–1733 2000
[4]H. Ganesan , G. Mohankumar, Optimization of Machining Techniques in CNC Turning Centre using Genetic Algorithm, Arab J Sci Eng
(2013) 38:1529–1538
[5] Kolahan, Abachizadeh, Optimizing turning parameters for cylindrical parts using simulated annealing method, In: Proceedings of World
Academy of Science, Engineering and Technology, vol. 36, December 2008, ISSN: 2070-3740
[6] Bharathi Raja, S.; Baskar, N., Optimization techniques for machining operations: a retrospective research based on various mathematical
models. Int. J. Adv. Manuf. Technol. 48, 1075–1090 ,2010 [7] Datta, R.; Majumder, Optimization of Turning Process parameters Using Multi-Objective Evolutionary Algorithm. 10.1109/CEC.2010.5586296, IEEE 2010
[8] Lan Tian-Syung, Fuzzy Deduction Material Removal Rate Optimization for Computer Numerical Control Turning, DOI : 10.3844/ajassp.2010.1026.1031, American Journal of Applied Sciences, Volume 7, Issue 7, Pages 1026-1031, 2010 [9] Tzeng, C. J., Lin, Y. H., Yang, Y. K., & Jeng, M. C., Optimization of turning operations with multiple performance characteristics using the
[10]Taguchi method and Grey relational analysis. Journal of Material Processing Technology, 209, 2753-2759, 2009.Montgomery, D. C., Design and analysis of experiments , John Wiley, New York, 2001
[11]S. Fraley, M. Oom, B. Terrien, and J. Z. Date, “Design of Experiments via Taguchi Methods: Orthogonal Arrays, The
Michigan Chemical Process Dynamic and Controls Open Text Book, USA, 2006
[12]Unitek Miyachi Group, “Welding Material Control”, Technical Application Brief, 2(1999), pp. 1–5
[13] Omvir Singh Bhaduria1, Sanjay Goyal, Premanand S. Chauhan, APPLICATION OF TAGUCHI METHOD FOR OPTIMIZATION OF PROCESS PARAMETERS FOR MINIMUM SURFACE ROUGHNESS IN TURNING OF 45C8 ISSN (PRINT): 2393-8374
![FIG. Flow chart of Taguchi method [14]](https://thumb-us.123doks.com/thumbv2/123dok_us/8178013.809907/2.595.313.541.387.745/fig-flow-chart-of-taguchi-method.webp)