QUANTITATIVE ESTIMATION OF EDOXABAN BY ZERO AND FIRST
ORDER AREA UNDER CURVE SPECTROPHOTOMETRIC METHOD
IN BULK AND
IN-HOUSE
TABLETS
Tarkeshwari K. Dhiware1*, Paresh A. Patil2 and Mahesh G. Salaraya3
1
C. K. Pithawalla Institute of Pharmaceutical Science and Research, Surat, (Gujarat) 395007,
India.
2
Ahinsa Institute of Pharmacy, Dondaicha, Shindkheda, Dhule.(Ms) 425408, India.
3
C. K. Pithawalla Institute of Pharmaceutical Science and Research, Surat, (Gujarat) 395007
India.
ABSTRACT
Aim: The aim of this work is to establish two simple, economical, and
rapid spectrophotometric methods for the quantification of Edoxaban
in bulk material and in tablets. Further, this study is designed to
validate the developed methods as perICH guidelines. Materials and
Methods: In Methods I and II, a stock standard solution was prepared
by dissolving 10 mg of Edoxaban in 100 mL of 10% v/v Methanol to
obtain a concentration of 100 μg/mL. After suitable dilution, 10 μg/mL
of Edoxaban was prepared and scanned in the UV-visible range 400–
200 nm; Edoxaban showed a maximum wavelength at 290 nm. In
Method I, area under curve (AUC) of the zero-order spectrum was
recorded between 283.00 and 300.00 nm. While, in Method II, zero-order spectra were
derivatized into first-order, and the AUC was recorded between 299.00 and 314.00 nm. For a
linearity study, series of dilutions were prepared from stock solutions. Results: In Method I,
and II, Edoxaban followed linearity in the concentration range of 4-24 μg/mL with
(r2>0.999). Conclusion: The developed methods are simple, precise, rugged, robust, and
economical. Both these methods can be used for routine analysis of Edoxaban from its tablet
formulation.
KEYWORDS: Edoxaban, UV Spectrophotometer, Derivative, AUC, Validation.
Volume 8, Issue 10, 1016-1025. Research Article ISSN 2277– 7105
Article Received on 25 June 2019,
Revised on 15 July 2019, Accepted on 04 August 2019,
DOI: 10.20959/wjpr201910-15643
*Corresponding Author
Tarkeshwari K. Dhiware
C. K. Pithawalla Institute of
Pharmaceutical Science and
Research, Surat, (Gujarat)
395007, India.
INTRODUCTION
Edoxaban (Molecular formula- C24H30CIN7O4S M.W.- 548.06 g/mol.) Chemically
isN’-(5-chloropyridin-2-yl)-N-[(1S,2R,4S)-4-(dimethylcarbamoyl)-2-{5-methyl-4H,5H,6H,7H[1,3]
thiazolo[5,4-c]pyridine-2-amido}cyclohexyl]ethaniamide. Used as an coagulants,
anti-thrombin and factor Xa inhibitors.[3]
The literature review shows the various methods for the determination of Edoxaban by High
Performance Liquid Chromatography(HPLC).[2] LC-MS method for estimation of Edoxaban
in human plasma.[4]
The objective of this work is to establish zero and first derivative UV Spectroscopy and its
AUC technique. The current works emphasize simple, precise, sensitive, and effective UV
Spectroscopy method for estimation of Edoxban in bulk and in-house tablets. The method
was validated as per ICH guidelines.
Figures
Figure 1: Chemical structure of Edoxaban.
MATERIALS AND METHODS
Materials
The drug was used without further purification. As the tablet formulation was not available in
Indian market; tablet containing 15,30,60mg Edoxaban were prepared in-house using direct
compression technique. Prepared tablets were used as pharmaceutical formulation for further
analysis.
Instrument
A double beam UV-VIS spectrophotometer (UV-2450, Shimadzu, Japan) connected to
computer loaded with spectra manager software UV Probe with 10 mm quartz cells was used.
200-400 nm; scan speed: medium; sampling interval: 1.0 nm; derivative mode: 1D (first order derivative, dA/dλ); band width (Δλ):10.0 nm; spectral slit width: 1 nm. All weights were
taken on electronic balance (Model Shimadzu AUX 120).
Preparation of stock standard solution and selection of wavelengths
A stock standard solution was prepared by dissolving10 mg of Edoxaban in a 100 mL of 10%
v/v water to obtain a concentration of 100 μg/mL. From it, anappropriate concentration of 10 μg/mL was preparedand scanned in the UV-visible range 400–200 nm; Edoxaban showed a
maximum absorbance at290 nm. In Method I, area under curve (AUC) ofthe zero-order
spectrum was recorded between the283.00 and 300.00 nm. While, in Method II,
zero-orderspectra were derivatized into first-order and the AUC was recorded between 299.00 and
314.00 nm.
Validation of the method
Study of linearity curves
From the stock standard solution, an appropriateamount of aliquots portion in the range of
0.4–2.4 mLwere transferred into a series of 10 mL volumetric flasks and diluted up to mark
using the same solvet to obtain a concentration in the range of 4-24 μg/mL. The solutions
were scanned on a spectrophotometer inthe range of 400–200 nm. The calibration curves
were plotted concentrations versus AUC between 283.00nm and 300.00 nm (Method I).
While in Method II, anappropriate amount of aliquots portion in the range of 0.4-2.4 mL were
transferred into a series of 10 mLvolumetric flasks and diluted up to the mark using the same
solvent to obtain a concentration in the range of 4-24 μg/mL. The calibration curve was
plotted as concentration versus AUC between 299-314nm (Method II).
Recovery studies
To the pre-analyzed sample solutions, a knownamount of stock standard solution was added
at different levels, i.e. 80%, 100%, and 120%. Thesolutions were re-analyzed by the proposed
methods.
Precision
The precision of the methods was studied as intra-dayand inter-day variations. In Method I,
precision was determined by analyzing the 8, 16, and 24 μg/mL of Edoxaban solutions as
intra-day and inter-day variations. In Method II, precision was determined by analyzing the
Sensitivity
The sensitivity of measurements of Edoxaban by the use of the proposed methods was
estimated in terms of the limit of quantification (LOQ) and the limit ofdetection (LOD). The
LOQ and LOD were calculatedusing equation LOD=3.3 × N/B and LOQ=10 × N/B, where ‘N’ is the standard deviation of the AUC of thedrugs (n=3), taken as a measure of noise, and ‘B’ is the slope of the corresponding calibration curve.
Repeatability
Repeatability was determined by analyzing 20μg/mL and 20 μg/mL concentration of
Edoxaban solution for six times for Methods I and II, respectively.
Ruggedness
The ruggedness of the proposed methods was determined for 16μg/mL concentrations of
Edoxaban by analysis of aliquots from a homogenous slot by two analysts using the same
operational and environmental conditions for Methods I and II, respectively.
Application of proposed method for pharmaceutical formulation
Twenty tablets were accurately weighed, average weight determined and ground into fine
powdered. A quantity of powder equivalent to one tablet was transferred into a 100 mL
volumetric flask containing10 mL of Methanol, the volume was adjusted to the mark using
the same solvent. An appropriate volume 1.2 mL was transferred into a 10 mL volumetric
flask and the volume was adjusted to the mark to obtain the desired concentration of 12 μg/mL. The AUC was recorded at selected wavelengths for Method I. While in Method II,
AUC of the first-order derivative spectrum was recorded in between selected wavelength
ranges. The concentration of the drug was determined from the respective linear regression
equations.
Determination of Edoxaban bulk
A quantity of powder equivalent to one tablet was transferred into a 100 mL volumetric flask
containing10 mL of Methanol, the volume was adjusted to the mark using thesame solvent.
An appropriate volume 1.2 mL was transferred into a 10 mL volumetric flask and the volume
was adjusted to the mark to obtain the desired concentration of 12 μg/mL. The AUC was
recorded at selected wavelengths for Method I. While in Method II, AUC of the first-order
derivative spectrum was recorded in between selected wavelength ranges. The concentration
RESULTS AND DISCUSSION
Selection of wavelengths
Figures 2 and 3 show the selection of wavelengthsin Methods I and II, respectively. The
selection of wavelengths in both the methods is based on the reproducibility of the results.
Linearity studies
The linear regression data for the calibration curves showed a good linear relationship over
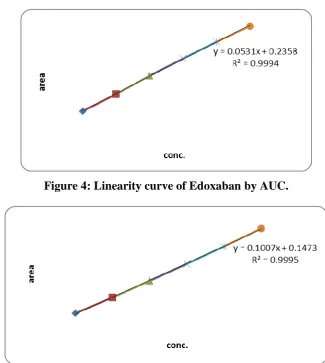
the concentration range 4-24 μg/mL for Method I and 4-24 μg/mL for Method II (Figure 4
and 5). The results are expressed in Table 1.
Accuracy
The pre-analyzed sample used in Methods I and II. In Method I, themean % recovery was
found to be in zero order 99.43%. While in Method II, it was found to be in first order
99.07%. The results are expressed in Table 2.
Precision
The precision of the developed method was expressedin terms of % relative standard
deviation (% RSD). These results show reproducibility of the assay. The % RSD values
found to be less than 2 indicate that the methods were precise for the determination of drugs
in formulation. The results are expressed in Table 3.
Sensitivity
The LOD and LOQ for Edoxaban were found to be 0.1330 and 0.4030 μg, respectively, for
Method I. For Method II, they were found to be 0.2586 and 0.7835 μg, respectively. The
results are expressed in Table 1.
Repeatability
Repeatability was determined by analyzing 20 μg/mL(Method I) and (Method II)
concentrations of Edoxaban solution for six times and the % amount determined with %
RSD<2 for both the methods. The results are expressed in Table 5.
Ruggedness
The peak area was measured for the same concentration solutions, six times for both
methods. The results were in the acceptable range for both the drugs. The results showed that
Determination of Edoxaban in bulk
The concentrations of the drug were calculated from linear regression equations. The % RSD
was founds to be in method I-0.4023 and in method II-0.1713 (Table 6).
Application of proposed method for pharmaceutical formulation
The spectrum was recorded at 290 nm. The concentrations of the drug were calculated from
linear regression equation. The % RSD was found to be in Method I- 0.9011% and Method
[image:6.595.120.455.242.451.2]II- 0.9300% (Table 7).
Figure 2: UV-spectrum Edoxaban in methanol.
[image:6.595.124.460.494.733.2]Figure 4: Linearity curve of Edoxaban by AUC.
Figure 5: Linearity curve of Edoxaban by First order Derivatives.
Table 1: Optical characteristics and linearity data of Edoxaban.
Parameters Method I Method II
Linearity range (μg/mL) 4-24 4-24 Selected range (nm) for AUC 283-300 299-314 Slope 0.053 0.100 Intercept 0.235 0.147 Correlation coefficient 0.999 0.999 Limit of detection (μg) 0.1330 0.2586 Limit of quantitation (μg) 0.4030 0.7835
Table 2: Accuracy.
S
Initial amount (µg/mL)
Amount added (µg/mL)
Method I (n=3)
Method II (n=3)
% Recoverya % RSD % Recoverya % RSD
Table 3: Precision.
Conc. (µg/mL) Intra-daya Inter-daya
Method I Method II % RSD % RSD
Method I Method II Method I Method II
8 8 0.5956 0.1635 1.5083 0.2076 16 16 0.3031 0.2546 0.6145 0.2465 24 24 1.3916 0.1453 0.9342 0.1798
a
Average of three estimates
Table 4: Ruggedness.
Method Amount taken
(µg/mL) (n=3)
Amount found (%)a
Analyst I Analyst II
Method 1 16 99.0902 99.2331 Method 2 16 99.5540 99.5934
a
Average of Six estimations
Table 5: Repeatability.
Method Amount taken
(µg/mL) (n=6)
Amount founda
(%) % RSD
Method 1 20 99.1471 0.5938 Method 2 20 100.1953 0.9783
a
Average of six estimations.
Table 6: Analysis of Bulk.
Method Concentration
(µg/mL) (n=6)
Amount found (µg/mL)(n=6)
Amount
founda (%) % RSD
Method 1 12 49.5590 99.8130 0.4023 Method 2 12 49.4787 99.5955 0.1713
a
Average of six estimations.
Table 7: Analysis of Formulation Brand name- Lixiana 30mg.
Method Concentration
(µg/mL) (n=6)
Amount found (µg/mL)(n=6)
Amount
founda (%) % RSD
Method 1 12 49.8780 99.8342 0.9011 Method 2 12 49.6706 98.5672 0.930
a
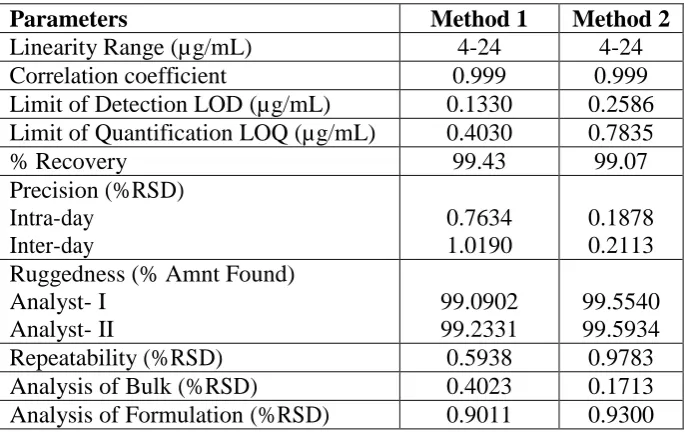
Table 8: Summery of validation parameter.
Parameters Method 1 Method 2
Linearity Range (µg/mL) 4-24 4-24 Correlation coefficient 0.999 0.999 Limit of Detection LOD (µg/mL) 0.1330 0.2586 Limit of Quantification LOQ (µg/mL) 0.4030 0.7835 % Recovery 99.43 99.07 Precision (%RSD)
Intra-day Inter-day
0.7634 1.0190
0.1878 0.2113 Ruggedness (% Amnt Found)
Analyst- I Analyst- II
99.0902 99.2331
99.5540 99.5934 Repeatability (%RSD) 0.5938 0.9783 Analysis of Bulk (%RSD) 0.4023 0.1713 Analysis of Formulation (%RSD) 0.9011 0.9300
CONCLUSION
Both the developed methods are economical, simple, accurate, precise and rugged, and can be
used for the usual study of Edoxaban from its pharmaceutical formulations. The methods are
developed for quantification of Edoxaban tablets. It is also used in routine quality control of
the formulations containing Edoxaban.
REFERENCES
1. International Conference on Harmonization, Harmonized Tripartite Guideline, Validation
of Analytical Procedures Text and Methodology, ICH Q2 (R1), 2005.
2. Rognoni C, Marchetti M, Quaglini S, Liberato NL. Edoxaban versus warfarin for stroke
prevention in non-valvular atrial fibrillation: a cost-effectiveness analysis. J Thromb
Thrombolysis, 2015; 39(2): 149- 54. doi:10.1007/s11239-014-1104.
3. Zimmerman HJ. Antithrombotic agents. Drugs used in cardiovascular disease. In,
Zimmerman HJ. Hepatotoxicity: the adverse effects of drugs and other chemicals on the
liver. 2nd ed. Philadelphia: Lippincott, 1999; 639-42. (Textbook of hepatotoxicity
published in 1999, well before the availability of edoxaban and the direct factor Xa
inhibitors).
4. Camm AJ, Bounameaux H. Edoxaban: A new oral direct factor xa inhibitor. Drugs, 2011
Aug 20; 71(12): 1503-1526. PubMed 21861537
5. International Conference on Harmonization, guidance for industry, QIA (R2): Stability
6. Edoxaban (Savaysa)--the fourth new oral anticoagulant. Med Lett Drugs Ther, 2015; 57
(1465): 43-5. PubMed Citation (Concise review of efficacy and safety of edoxaban for
prevention of stroke or systemic embolization in patients with nonvalvular atrial
fibrillation, which is equivalent or better in efficacy than warfarin with a lower rate of
bleeding; no mention of hepatotoxicity or ALT elevations).
7. Perzborn E, Roehrig S, Straub A, Kubitza D, Misselwitz F (2011) The discovery and
development of rivaroxaban, an oral, direct factor Xa inhibitor. Nat Rev Drug Discov ,
10: 61–75.
8. Watson J, Whiteside G, Perry C (2011) Apixaban: first global approval. Drugs, 71:
2079–2089.
9. Bounameaux H, Camm AJ (2014) Edoxaban: an update on the new oral direct factor Xa
inhibitor. Drugs, 74: 1209–1231.
10.Shimadzu Corporation-Kyoto Japan, Analytical & Measuring Instruments Division,