https://doi.org/10.5194/hess-22-6357-2018 © Author(s) 2018. This work is distributed under the Creative Commons Attribution 4.0 License.
Estimating the effect of rainfall on the surface temperature of a
tropical lake
Gabriel Gerard Rooney1, Nicole van Lipzig2, and Wim Thiery3,4 1Met Office, FitzRoy Road, Exeter, EX1 3PB, UK
2KU Leuven, Department of Earth and Environmental Sciences, Celestijnenlaan 200E, 3001 Leuven, Belgium 3ETH Zurich, Institute for Atmospheric and Climate Science, Universitaetstrasse 16, 8092 Zurich, Switzerland 4Vrije Universiteit Brussel, Department of Hydrology and Hydraulic Engineering, Pleinlaan 2, 1050 Brussels, Belgium Correspondence:Gabriel Gerard Rooney ([email protected])
Received: 10 August 2018 – Discussion started: 24 August 2018
Revised: 22 November 2018 – Accepted: 25 November 2018 – Published: 10 December 2018
Abstract.We make use of a unique high-quality, long-term observational dataset on a tropical lake to assess the effect of rainfall on lake surface temperature. The lake in question is Lake Kivu, one of the African Great Lakes, and was selected for its remarkably uniform climate and availability of multi-year over-lake meteorological observations. Rain may have a cooling effect on the lake surface by lowering the near-surface air temperature, by the direct rain heat flux into the lake, by mixing the lake surface layer through the flux of ki-netic energy and by convective mixing of the lake surface layer. The potential importance of the rainfall effect is dis-cussed in terms of both heat flux and kinetic energy flux. To estimate the rainfall effect on the mean diurnal cycle of lake surface temperature, the data are binned into categories of daily rainfall amount. They are further filtered based on comparable values of daily mean net radiation, which re-duces the influence of radiative-flux differences. Our results indicate that days with heavy rainfall may experience a re-duction in lake surface temperature of approximately 0.3 K by the end of the day compared to days with light to mod-erate rainfall. Overall this study highlights a new potential control on lake surface temperature and suggests that further efforts are needed to quantify this effect in other regions and to include this process in land surface models used for atmo-spheric prediction.
Copyright statement. The works published in this journal are distributed under the Creative Commons Attribution 4.0 License. This licence does not affect the Crown copyright work, which
is re-usable under the Open Government Licence (OGL). The Creative Commons Attribution 4.0 License and the OGL are interoperable and do not conflict with, reduce or limit each other.
© Crown copyright 2018
1 Introduction
Lakes are important features of the terrestrial environment for physical, ecological, economic and recreational reasons. Physically, lake–atmosphere interactions can influence the local weather and climate. Thus their representation in Earth system modelling has increased in complexity in recent years. Lake water surface temperature (LWST) is of particu-lar relevance to atmospheric modelling due to the contrast in temperature, and hence in boundary-layer fluxes, that often exists between lakes and their surroundings (Mironov et al., 2010).
produced over land, while strong convection develops over the lakes, leading to high precipitation amounts. This phe-nomenon is caused by the diurnal cycle of the lake–land tem-perature difference, which leads to land breezes converging over the lake surface during the night. When these air masses, moistened by the lake, lift up into the atmosphere, they gen-erate convective precipitation and often thunderstorms (Doc-quier et al., 2016; Thiery et al., 2015, 2016). The African Great Lakes are thus important regulators of the East African climate, which continues to present a challenge to modellers (James et al., 2018; Woodhams et al., 2018).
Adequately observing and modelling tropical lake– atmosphere interactions often remains a challenge, even though efforts have been made to quantify these exchanges (Verburg and Hecky, 2003; Verburg and Antenucci, 2010; Thiery et al., 2014a, b; Delandmeter et al., 2018; Weyhen-meyer et al., 2017). Moreover, important uncertainties main present in several of the reference products, notably re-garding precipitation (Dinku et al., 2008; Sylla et al., 2013; Awange et al., 2016; Kimani et al., 2017), hence the need for high-quality in situ meteorological measurements over the African Great Lakes (Anyah and Semazzi, 2004; Anyah et al., 2006; Anyah and Semazzi, 2009). To help address this need, a state-of-the-art automatic weather station was in-stalled in 2012 on Lake Kivu (AWS Kivu).
Lakes interact with the atmosphere via a variety of processes. Physical lake models developed for use in a meteorological context have thus far concentrated on lake–atmosphere interaction through turbulent and radiative fluxes. The effects of rain on LWST, both directly from ther-mal perturbation and indirectly from changing the lake strati-fication, are little understood or represented to date. Evidence of the significance of rain effects, particularly in the trop-ics, is beginning to emerge however (Wei et al., 2014). Here, we combine theoretical considerations with analysis of the unique multi-annual dataset from AWS Kivu to estimate the significance of the rainfall effect on LWST in the tropics. As will be shown, the uniformity of the Lake Kivu climate in-creases its appeal as a location at which to assess this effect. To summarise the structure of the following sections, in Sect. 2 the study area is described, Sect. 3 discusses the mechanisms of rain effect on LWST, the Kivu data are pre-sented and analysed in Sect. 4, and finally the results are dis-cussed in the conclusion.
2 Description of Lake Kivu
The African Great Lakes are of utmost importance for re-gional economies, as well as being essential to the survival of the local population. As the largest reservoir of freshwater in the tropics, they provide numerous ecosystem services to local communities, such as fishing grounds, drinking water and electricity. Lake Victoria alone directly supports 200 000 fishermen operating from its shores and sustains the
liveli-hood of more than 30 million people living on its shores (East African Community, 2011). During the last decades, how-ever, the African Great Lakes experienced fast changes in ecosystem structure and functioning, and their future evolu-tion is a major concern (O’Reilly et al., 2003; Verburg et al., 2003; Verburg and Hecky, 2009; Borges et al., 2015). More-over, outflow dam management, along with climate variabil-ity and change, exert a large influence on the water levels of the largest African Great Lake, Lake Victoria (Vanderkelen et al., 2018a, b).
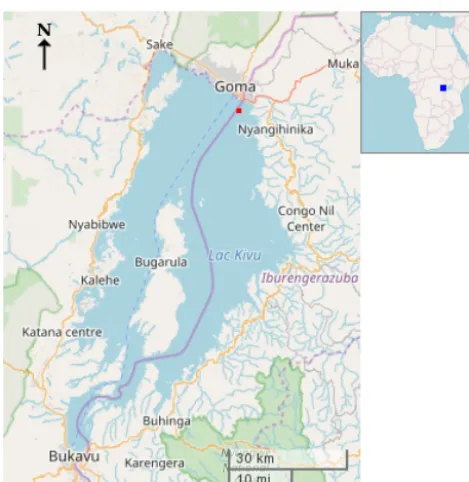
Lake Kivu (01◦350–02◦300S, 028◦500–029◦230E) is situ-ated along the border of Rwanda and the Democratic Repub-lic of the Congo and is one of the seven African Great Lakes (Fig. 1). The lake has a surface area of 2370 km2, lies 1463 m above sea level and is up to 485 m deep. The outflow is lo-cated at the lake’s southern tip and forms the Ruzizi River, which flows southwards into Lake Tanganyika. Although the lake is meromictic, the oxic mixolimnion deepens to 60– 70 m during the dry season. Below that, the monimolimnion is found to be rich in nutrients and dissolved gases, in par-ticular carbon dioxide and methane (Degens et al., 1973; Borges et al., 2011; Descy et al., 2012; Morana et al., 2015a, b, 2016). Interestingly, temperature and salinity within the monimolimnion increase with depth due to the input of heat and salts from deep geothermal springs (Degens et al., 1973; Spigel and Coulter, 1996; Schmid et al., 2005). Given its high altitude and location close to the Equator, surface water tem-peratures over Lake Kivu are relatively constant throughout the year.
3 Physical effects of rainfall
Rain may have an effect on the lake surface in four ways: (i) evaporative cooling of the near-surface air during pre-cipitation, which induces an additional upward sensible heat flux from the lake towards the atmosphere; (ii) direct rain heat flux into the lake; (iii) mixing of the lake surface layer through the flux of kinetic energy; and finally (iv) convective mixing of the lake surface layer. The first of these ought to be parametrised by atmospheric models, as with related at-mospheric effects like the reduction of insolation by cloud cover. The others lie mainly in the lake modelling domain. Hereafter, we discuss points (i)–(iv) above in some more de-tail.
3.1 Cooling of near-surface air
Figure 1.Maps of Lake Kivu geography and situation. The lower left corner of the large map is at 2.6◦S, 28.7◦E, and the upper right corner is at 1.5◦S, 29.5◦E. The lake is approximately 90 km long and 50 km wide. The purple line along the lake indicates the boundary between the Democratic Republic of the Congo to the west and Rwanda to the east. The weather station is situated ap-proximately 3 km offshore, near Goma at the northern end of the lake. Its position is marked with a red square. The location of Lake Kivu within Africa is marked on the small map by a blue square. (©OpenStreetMap contributors. Mapping data are available under the Open Database License.)
atmospheric moisture and temperature profile, drop-size dis-tribution, drop concentration, etc. (Schlesinger and Oh, 1988; Feingold, 1993).
At the extreme end of intense convection, atmospheric cooling and momentum transfer from rain may produce cold convective downdraughts, which transport cold air to the surface from higher levels (Kamburova and Ludlam, 1968; Knupp and Cotton, 1985; Srivastava, 1987). These additional dynamic effects are potentially less well represented or re-solved in atmospheric models but are of importance in terms of gust hazard, as well as for their relevance to modelling of the convective cycle (Rooney, 2015; Thiery et al., 2017). 3.2 Direct heat flux
The specific heat capacity of water is approximately 4.2×
103J kg−1K−1. A rainfall rate of 1 mm h−1is thus equivalent to a heat flux of approximately 1.21TW m−2, where1T is the temperature difference between the rain and the surface which absorbs it. Rain temperature variation relative to air or surface temperature is not well known. According to Byers et al. (1949), rain may be much colder than the ambient air at
the start of a thunderstorm but possibly comparable at later stages. This is presumably due to evaporative cooling reduc-ing the air temperature to nearer that of the rain over time and is consistent with the approximation of the rain temper-ature to the wet-bulb tempertemper-ature (Wei et al., 2014, see also references therein).
On seasonal to decadal timescales, the sensible heat con-tribution by rainfall is deemed small (Verburg et al., 2011). Wei et al. (2014) have estimated that this flux is largest in the tropics, with seasonal mean values of the order of−2 W m−2, and they also state that neglect of this contribution may partly explain some air temperature biases in climate reanalyses. In their study, van Beek et al. (2012) have noted its significance for correctly estimating the surface temperature of tropical rivers. On much shorter timescales, surface cooling due to rain may affect weather patterns. On land, this process has been widely studied (Seneviratne et al., 2010; Taylor et al., 2012; Guillod et al., 2015; Lorenz et al., 2016). The rain effect in water bodies is more uncertain, although recently there have been some interesting observational studies, e.g. Reverdin et al. (2012).
3.3 Mechanical and convective mixing
As well as the direct effects of an additional heat flux, rainfall may produce a perturbation of LWST by the mechanical and convective mixing of the near-surface portion of the lake.
An early study by Katsaros and Buettner (1969) indicated that large drops (3 mm diameter) produce mixing to depths of 10 cm and smaller drops (≤1.2 mm) mixed to perhaps one-third of this depth. Similarly, Green and Houk (1979) found that the presence of some large drops is very important in producing significant subsurface mixing.
Several subsequent studies of artificial rainfall have ex-amined rainfall-generated turbulence in slightly more detail. Artificial heavy rainfall has been observed to produce turbu-lent mixing over depths of 10–20 cm in the study of Lange et al. (2000), with a drop size of approximately 3 mm, and that of Zappa et al. (2009) with a distribution of drop sizes in the range 0.3–5.3 mm, which was modelled on the measured natural-rain distributions of Marshall and Palmer (1948). By contrast, Harrison and Veron (2017), with drop sizes of ap-proximately 1.3 mm, found turbulent kinetic energy (TKE) to be independent of artificial rainfall intensity, at even higher intensities, and suggested that a significant fraction of the energy went into producing small-length-scale or capillary motions within 1–2 cm of the surface. Again, these results would seem to indicate that drop size is an important factor. While the effects of drop impact in a deep liquid reservoir are quite complex, even for a single drop (Prosperetti et al., 1989; Rein, 1996), it may be reasonable as a first hypothesis to assume that a significant fraction of the kinetic energy of natural heavy rain goes into subsurface TKE production.
2002; van Dijk et al., 2002; Yu et al., 2012). A rain rate of 5 mm h−1may give rise to a kinetic energy fluxFKof around 0.02 W m−2, for example. The rate of TKE production in the surface boundary layer of a lake may then be assumed to scale asφFK/(ρw`), where`is the depth to which the rain penetrates,ρwis the water density andφFKis some fraction ofFKwhereφ≤1 (see for example Townsend, 1976, chap. 2 for a discussion of TKE evolution). The significance of this rain-driven production of TKE may be gauged by compari-son with the kinetic energy input from wind shear.
Mechanical surface forcing by wind upon lakes is usually modelled through matching of stress, so that the aqueous fric-tion velocity at the lake surfaceu∗lis
u∗l=
ρ
a
ρw 1/2
u∗, (1)
whereu∗ is the friction velocity in the atmospheric surface layer, andρais the air density. A typical atmospheric friction velocity of the order of 1 m s−1then implies an aqueous value of u∗l≈0.03 m s−1 (Anctil and Donelan, 1996; Csanady, 2001). The lake surface TKE production from wind-driven shear scales asu3∗l/(κz), wherezis the depth andκ=0.4 is von Kármán’s constant (e.g. Skyllingstad and Denbo, 1995). Thus, settingz=`, the turbulent mixing from rain may be compared to that from wind shear by comparing u3∗l/(κ`)
with φFK/(ρw`), or equivalently by comparing u∗l with
(κφFK/ρw)1/3. This last term is evaluated as being of the or-der of 0.02 m s−1for heavy rain, using the value ofFKgiven above andφin the range of 0.5–1, and is the same order of magnitude as the friction velocity for a moderate to strong wind. Hence, the turbulent mixing rates due to wind shear and rain may at times be comparable in the top few centime-tres of a lake.
For cold rain falling onto a relatively warm lake, convec-tive effects will presumably add to the mixing strength and depth. While Green and Houk (1979) concentrated mainly on the case of warm rain falling onto cold water, their experi-ments with the opposite temperature contrast showed cooling throughout the depth of their reservoir, i.e. to at least 0.4 m. The LWST perturbation caused by mixing effects will de-pend on the stratification of the lake near-surface region.
4 Data analysis
4.1 Instrumentation and measurements
AWS Kivu is installed on the research platform of the Rwanda Energy Company, approximately 3 km offshore of the cities of Gisenyi (Rwanda) and Goma (Democratic Re-public of the Congo; see Fig. 2). Since 9 October 2012, AWS Kivu has provided continuous high-quality observations of near-surface meteorology and four-component radiation. The continuous time series obtained so far from AWS Kivu is, to our knowledge, unique among its kind in the tropics.
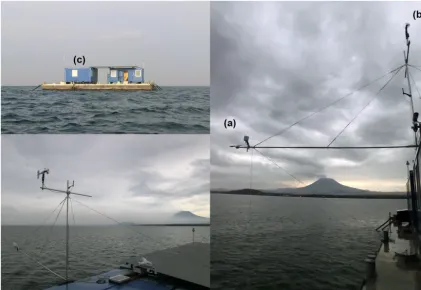
AWS Kivu consists of sensors for air temperature (Ta,◦C), relative humidity (RH, %), air pressure (p, Pa), precipitation (P, mm), wind speed (U, m s−1), and direction (WD,◦) and the four radiation components (SWin, SWout, LWin, LWout, all in W m−2). Details of the sensors are given in Table 1. LWST is calculated from the upwelling longwave irradiance using the Stefan–Boltzmann law and assuming an emissiv-ity of 0.99 (Wan, 2008). The station is powered by a solar panel, and all sensors are placed at a height of 4.40 m above the water surface (Fig. 2a), except for wind speed and direc-tion, which are measured at 7.20 m above the lake (Fig. 2b). While the station is mounted on a metal container (Fig. 2c), efforts were made to minimise its effect on the meteorologi-cal measurements. Notably, temperature, humidity and radi-ation sensors were mounted 6 m horizontally away from the container edge, making sure that recorded conditions are rep-resentative for the water surface.
Variables are sampled every 15 s, from which 30 min av-erages are calculated and stored. In the case of precipitation, accumulated values are stored, and for wind speed both mean and maximum values are recorded. Moreover, short periods of high-frequency radiation measurements enable an assess-ment of the potential effect of platform moveassess-ments. Through a General Packet Radio Service (GPRS), the KU Leuven Re-gional Climate Studies group receives the observations di-rectly from the station, allowing for remote problem detec-tion.
The time span of measurements used here was between 13 September 2012 and 14 August 2017; however most of the analysis is based on 4 calendar years of data from 1 Jan-uary 2013 to 30 December 2016.
4.2 Weather and climate
The data indicate that there is a remarkable uniformity of the lake climate. The annual air temperature range is around 14 K. The daily rainfall totals for 4 calendar years show a generally uniform spread but with a slightly drier period around July (Fig. 3). There seem to be two prevailing wind directions which do not vary greatly with the weather, inas-much as this is represented by rainfall (see Sect. 4.3). This uniformity is beneficial for the following analysis since there are consequently fewer sources of variation upon which the lake behaviour may potentially depend.
The temporal variations in weather may be examined fur-ther using power spectra of rainfall and wind speed (Fig. 4). These show that a large part of the variation is on the diur-nal scale. This provides justification for the use of average diurnal cycles to explore the behaviour of the system.
Figure 2.Automatic weather station on Lake Kivu after its installation, 8 October 2012 (© Wim Thiery). Position (a) indicates the location of the temperature, relative humidity and radiation sensors at 4.40 m above the lake surface. Position (b) shows the location of the wind vane at 7.20 m above the lake surface. Position (c) indicates the container on which the station was mounted.
Table 1.AWS Kivu sensor specifications.
Data Sensor Range Accuracy
Air pressure Campbell Scientific CS100 600–1100 hPa 0.5 hPa Air temperature Campbell Scientific CS215 −40 to+70◦C 0.3 K Relative humidity Campbell Scientific CS215 0 %–100 % 2 %–4 % Wind speed Young 05103 0–100 m s−1 0.3 m s−1
Wind direction Young 05103 0–360◦ 3◦
Precipitation Tipping bucket ARG100 0.2–500 mm h−1 95 – 98 % SW components Kipp and Zonen CNR4 305–2800 nm <5 % LW components Kipp and Zonen CNR4 4500–42 000 nm <10 %
speed. These fluctuations are probably due to local circula-tions caused by lake or land breezes, and the largely bimodal distribution of the wind direction, also shown later, appears to support this interpretation.)
4.3 Partitioning by rainfall
To examine the effect of heavy rain, 4 years of data will be analysed (1 January 2013 to 30 December 2016). This amounts to 1457 days, as three days are omitted due to miss-ing data. These data are referred to as ALL data in the fol-lowing analysis. Based on daily rainfall totals, they may be
divided into DRY, WET and VWET days. DRY days are days with no rainfall. The remaining days are partitioned into WET or VWET depending on whether the rainfall total is re-spectively less or greater than a threshold of 8 mm (Fig. 3). DRY has 690 days, WET has 585 days and VWET has 182 days.
[image:5.612.130.463.439.550.2]Figure 3. Daily rainfall totals for 4 years of the observational record, beginning on 1 January 2013. The red line marks the 8 mm point, which is used to partition rain days between WET (≤8 mm) and VWET(>8 mm).
Figure 4. (a)Power spectrum of half-hourly rainfall amount (Sr,
mm2s) and(b) power spectrum of half-hourly mean wind speed (Sw, m2s−1), both for the period from 13 September 2012 to 14 Au-gust 2017. The vertical dotted lines mark frequencies (f, days−1) corresponding to 1, 30 and 365 days. Both plots show a distinct peak at the daily frequency, with the wind speed also exhibiting several sub-daily peaks.
of the day. There is also a later precipitation maximum in VWET, which may indicate the development of nighttime heavy storms.
[image:6.612.329.524.70.215.2]The effect of daily weather on LWST is summarised in Fig. 6. It can be seen that the average diurnal cycles of air temperature and relative humidity are quite smooth, with a spread related to the rainfall category. Thus DRY days are the warmest and least humid, VWET days are the coldest and most humid, and WET and ALL days lie between these extremes. Both the air temperature and LWST start close to-gether for the WET and VWET categories, but by the end
Figure 5.The average rainfall for each hour of the day, for VWET days (cyan), WET days (green) and DWET days (purple). In this and later plots, time is shown as UTC (coordinated universal time), which is 2 h behind LT (local time), i.e. LT=UTC+2 h.
of the day there is a difference in the mean, with VWET be-ing colder than WET. Specifically, the average temperature difference over the last 6 h of the day is 0.42 K.
Atmospheric forcing of LWST is usually characterised in terms of turbulent or radiative fluxes, with turbulent fluxes depending on mean wind speed, lake–air temperature dif-ference and near-surface humidity. For the categories de-scribed here, the choice of partitioning threshold between WET and VWET days coincidentally produces extremely similar graphs of mean wind speed. This has the effect of re-moving an important potential source of variation between these categories. The distributions of wind directions and speeds are also quite uniform; see Figs. 7 and 8.
Figure 9 shows the difference between the WET and VWET cases in terms of mean net radiation, on average over the course of a day. The lake has absorbed approximately 1.7×10⁶J m−2more in the WET case. This is due presum-ably to WET days having less (or less thick) cloud cover than VWET days on average. This source of difference may be eliminated by adding a further constraint to the total ab-sorbed radiation on WET days. This is described in the next subsection.
4.4 Further partitioning by rainfall and net radiation
[image:6.612.49.283.315.473.2]cho-Figure 6.Mean diurnal cycles of(a)air temperature (Ta,◦C),(b)wind speed (U, m s−1),(c)relative humidity (RH, %) and(d)lake surface temperature (LWST,◦C) from the upwelling longwave irradiance, assuming an emissivity of 0.99. The input data are those from the 4 years 2013–2016 of the campaign to represent all seasons equally. The colours correspond to diurnal cycles averaged over ALL days (black), DRY days (red), WET days (green) and VWET days (cyan).
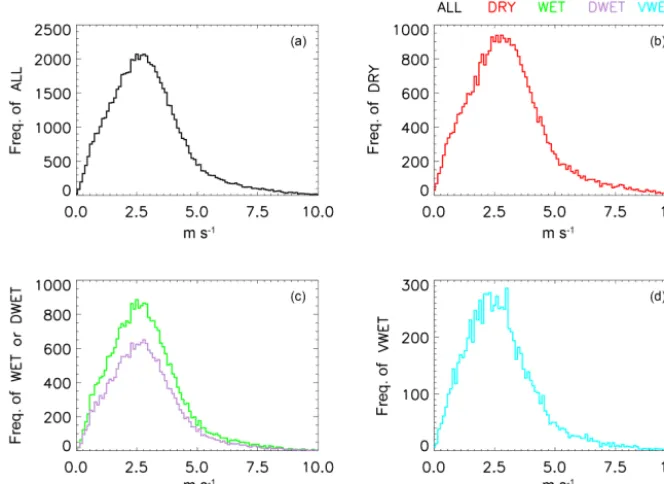
[image:7.612.132.465.439.680.2]Figure 8.Histograms of half-hourly mean wind speed for 2013–2016. The colours are the same as in Figs. 5 and 6.
Figure 9.Comparison of the differences in net radiation. WET mi-nus VWET net radiation is the solid line, and DWET mimi-nus VWET net radiation is the dashed line.
sen to allow a small margin, so that VWET days absorbed 1 %–2 % more radiation in the mean than DWET days. Thus any extra LWST cooling in VWET days compared to DWET days would be against a background of a slight excess of ab-sorbed radiative energy on VWET days, in the mean.
Using this additional constraint, the number of DWET days in the 4-year period is 425 or 73 % of the WET days. Table 2 summarises the number of days of each type in each year, along with data on which type of day came immedi-ately before and after. The distributions of wind directions and speeds for the DWET category are also plotted in Figs. 7 and 8. The diurnal cycle of the mean net radiation difference between DWET and VWET cases is shown in Fig. 9.
The average daily rainfall on DWET days is 2.31 mm, compared to 2.33 mm on WET days and 17.99 mm on
VWET days. Thus, the contrast in rainfall amount is largely preserved by this resampling. The diurnal evolution is also plotted in Fig. 5, again showing that DWET is similar to WET.
The average diurnal evolution for the categories of ALL, DRY, DWET and VWET is shown in Fig. 10. It can be seen that the evolution of diurnal wind speed is reasonably un-changed for DWET days compared to that of WET days (Fig. 6), but the evolution of LWST on DWET days is closer to that of VWET days. However, most of the difference in surface temperature between these categories in the last few hours of the day remains, with an average temperature differ-ence over the last 6 h of 0.29 K.
Considering the reliability of this difference, it may be noted that a difference of 0.3 K against a background at ap-proximately 300 K is equivalent to a difference in upwelling longwave radiation of approximately 1.8 W m−2. However, since this is a difference between mean values taken over a minimum of 182 observations at each time of day, it should be compared with the standard error of the mean. That is, it only requires instrumental accuracy of 1.8×
√
182≈
24 W m−2, which is within the instrument specification (Ta-ble 1).
In terms of significance, the standard error of the differ-ence between the mean DWET and VWET values is given by
SED= s
σDWET2 NDWET
+ σ 2 VWET
NVWET
Table 2.Percentages of the types of day which came immediately before and after each type, broken down by observation year.Ndenotes the number of days of each type in each year. OTH denotes days classified as WET but not DWET, so that the OTH and DWET categories combine to make up the WET category. The data from each year are presented separately to give an indication of inter-annual variation. To give an example from the last line of the table, in 2016 there were 45 VWET days, and 27 % of the days in 2016 directly preceding VWET days were DRY, compared to 18 % of the days directly following VWET days.
% preceding days N % following days
DRY OTH DWET VWET DRY OTH DWET VWET
2013
DRY 66 5 21 7 183 66 7 16 11
OTH 44 22 26 7 27 37 22 22 19
DWET 28 6 46 20 109 36 6 46 12
VWET 43 11 28 17 46 29 4 49 18
2014
DRY 68 7 20 6 167 68 8 18 6
OTH 31 17 40 12 42 26 17 33 24
DWET 29 13 37 21 106 31 16 37 16
VWET 20 20 34 26 50 20 10 44 26
2015
DRY 66 6 23 5 158 66 5 20 9
OTH 19 21 48 12 42 24 21 38 17
DWET 26 13 44 18 124 29 16 44 11
VWET 34 17 34 15 41 20 12 54 15
2016
DRY 68 12 16 4 182 68 9 17 7
OTH 33 14 27 27 49 43 14 22 20
DWET 35 13 35 16 86 35 15 35 15
VWET 27 22 29 22 45 18 29 31 22
Note that calculating percentages to the nearest percent occasionally produces sets that do not sum to 100 exactly.
whereσDWET2 andσVWET2 are the variances of LWST in the DWET and VWET cases respectively, and the number of ob-servations at any particular time of day are NDWET=425 and NVWET=182, as stated earlier. The standard error of the difference (SED) takes values in the range of 0.05– 0.07 K during the first and last few hours of the day, climb-ing to over 0.14 K durclimb-ing daylight hours. The hypothesis that the means are equal may be tested using the difference in mean values divided by SED (e.g. Frank and Althoen, 1994, chap. 10). This is plotted in Fig. 11. It can be seen that, before 16:00 UTC, this statistic takes values in the approxi-mate range of[−2,2], indicating that the hypothesis of equal means may be accepted at approximately the 5 % level of significance at these times. However, after 17:00 UTC, this statistic climbs to values well above 2, indicating that the hy-pothesis may reasonably be rejected at later times. It is there-fore concluded that the difference in the means during the last few hours of the day is statistically significant.
Finally, the effect of rain on the sensing of LWST should also be considered as a possible cause of observed LWST differences. From an atmospheric modelling viewpoint, the
sensed surface temperature is the important quantity in many cases, as has been recently discussed in the context of the in-troduction of a “skin” temperature into the FLake lake model (Le Moigne et al., 2016). In this particular case, it may be remarked that while the rain rate during VWET days is high-est during the final few hours of the day, Fig. 5 shows that the average VWET rain rate is also appreciably higher than that of the DWET category at some earlier times. However, the LWST differences, and their significance, at these earlier times are both much less than during the final few hours of the day, as shown in Figs. 10 and 11. This provides some ev-idence that a systematic effect of rain on the sensor is not the main cause of LWST differences.
5 Discussion and conclusion
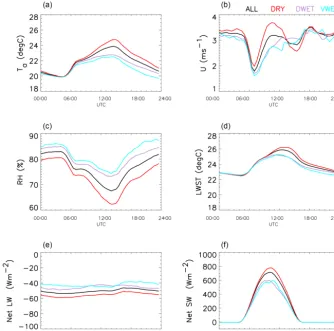
Figure 10.Mean diurnal cycles of(a)air temperature (Ta,◦C),(b)wind speed (U, m s−1),(c)relative humidity (RH, %),(d)lake surface temperature (LWST, ◦C) from the upwelling longwave irradiance, assuming an emissivity of 0.99,(e)net longwave irradiance (net LW, W m−2) and(f) net shortwave irradiance (net SW, W m−2). The input data are those from the 4 years 2013–2016 of the campaign, to represent all seasons equally. The colours correspond to diurnal cycles averaged over ALL days (black), DRY days (red), DWET days (purple) and VWET days (cyan).
Figure 11.Diurnal behaviour of the difference in mean values of LWST in the DWET and VWET cases, normalised by the standard error of the difference, SED; see Eq. (2). The dotted lines show±2 standard deviations for this statistic. It may be seen that the value climbs above 2 at later times, indicating the significance of the dif-ference in the means then.
tropics and well suited to the present research question. This study is the first such use of these data.
[image:10.612.87.245.499.612.2]The possible pathways by which this effect may arise are (i) cooling of the air due to contact with evaporatively cooled raindrops, and a subsequent increase in atmospheric sensible heat flux from the lake, (ii) negative heat flux directly to the lake from rain impingement, (iii) mechanical mixing of the lake surface layer by the kinetic energy of rain impact and (iv) convective mixing of the lake surface layer due to the negative heat flux from rain. Of these, the first is the most likely to be a parametrised process in a general circulation model of the atmosphere, although it could be considered the most indirect of the four. The rain heat flux is likely to be pro-portional to the difference between the air wet-bulb temper-ature and LWST. We have indicated with scaling arguments that the mechanical mixing due to heavy rain may be com-parable to that of a strong wind. The convective mixing will depend on the near-surface temperature structure of the lake, and hence on its recent history.
Unfortunately, the available data do not cover several other process-related quantities that would be useful to have, such as turbulent heat fluxes, rain temperature, fine-scale lake tem-perature profiles or lake turbulence measurements. Thus, the processes producing this effect are not directly measured. However, through our indirect analysis of the processes, it seems likely that cooling by rain combined with mechanical and convective mixing from droplet impact may have an ef-fect on LWST, in addition to the efef-fect from the more widely studied pathway of evaporative cooling.
Potential avenues of future work would be to examine these processes more closely in a targeted campaign of ob-servations, including the quantities listed above, and to con-sider how lake models may be modified to include their rep-resentation. An intermediate step in the latter might be to re-examine previous modelling studies to explore correlations between lake model errors and rainfall records. Since, as dis-cussed earlier, rainfall may affect not only the surface tem-perature but potentially also the temtem-perature or depth of any upper mixed layer, some or all of these quantities could be susceptible to rainfall effects. For models that predict ver-tical fluxes through the water column, comparison of these with any available flux or TKE measurements would be a possible way to estimate rain penetration in real lakes. There is an indication in the data of Reverdin et al. (2012) that rain-fall effects may have a sudden onset but a subsequent slower decay, so that some filtering method such as an exponential moving average applied to the rainfall data may be required when considering correlations. The decay timescales of any such filtering could also have a depth dependence.
In large tropical lakes, it is possible that a surface tempera-ture difference of the order of 0.5 K may suppress or enhance the strength of local air circulations, such as lake breezes, and hence have some effect (or even feedback) on the evolution of the local weather (Thiery et al., 2015, 2016). For exam-ple, the length of time between severe storms may be partly affected by the recovery timescale of LWST. In the short term it would seem possible to incorporate, perhaps
semi-empirically, the effect of rain temperature and rain-induced turbulence into simple lake models as used for weather and climate modelling.
Data availability. The data are available on request from the dataset owners, Wim Thiery and Nicole van Lipzig.
Competing interests. The authors declare that they have no conflict of interest.
Special issue statement. This article is part of the special issue “Modelling lakes in the climate system (GMD/HESS inter-journal SI)”. It is a result of the fifth workshop on “Parameterization of Lakes in Numerical Weather Prediction and Climate Modelling”, Berlin, Germany, 16–19 October 2017.
Acknowledgements. WT was supported by an ETH Zurich post-doctoral fellowship (Fel-45 15-1). The Uniscientia Foundation and the ETH Zurich Foundation are thanked for their support of this research. The Belgian Science Policy Office (BELSPO) is acknowledged for the support through the research project EAGLES (CD/AR/02A). We thank Stijn Bruggen, who analysed the AWS data in his master’s thesis and thereby supported the design of this study and the analysis presented here. GGR thanks John M. Edwards for a helpful discussion of TKE budgets.
Edited by: Miguel Potes
Reviewed by: two anonymous referees
References
Anctil, F. and Donelan, M.: Air–water momentum flux observations over shoaling waves, J. Phys. Oceanogr., 26, 1344–1353, 1996. Anyah, R. O. and Semazzi, F.: Idealized simulation of
hydrody-namic characteristics of Lake Victoria that potentially modulate regional climate, Int. J. Climatol., 29, 971–981, 2009.
Anyah, R. O. and Semazzi, F. H. M.: Simulation of the sensitivity of Lake Victoria basin climate to lake surface temperatures, Theor. Appl. Climatol., 79, 55–69, 2004.
Anyah, R. O., Semazzi, F. H. M., and Xie, L.: Simulated Physical Mechanisms Associated with Climate Variability over Lake Vic-toria Basin in East Africa, Mon. Weather Rev., 134, 3588–3609, 2006.
Awange, J., Ferreira, V., Forootan, E., Khandu, Andam-Akorful, S., Agutu, N., and He, X.: Uncertainties in remotely sensed precipitation data over Africa, Int. J. Climatol., 36, 303–323, https://doi.org/10.1002/joc.4346, 2016.
Borges, A. V., Abril, G., Delille, B., Descy, J.-P., and Darcham-beau, F.: Diffusive methane emissions to the atmosphere from Lake Kivu (Eastern Africa), J. Geophys. Res., 116, G03032, https://doi.org/10.1029/2011JG001673, 2011.
T., Morana, C., Okuku, E., and Bouillon, S.: Globally signifi-cant greenhouse-gas emissions from African inland waters, Nat. Geosci., 8, 637–642, https://doi.org/10.1038/NGEO2486, 2015. Byers, H. R., Moses, H., and Harney, P. J.: Measurement of rain
temperature, J. Metorol., 6, 51–55, 1949.
Camberlin, P., Gitau, W., Planchon, O., Dubreuil, V., Funatsu, B. M., and Philippon, N.: Major role of water bodies on diur-nal precipitation regimes in Eastern Africa, Int. J. Climatol., 38, 613–629, https://doi.org/10.1002/joc.5197, 2017.
Csanady, G. T.: Air-sea interaction: laws and mechanisms, Cam-bridge University Press, CamCam-bridge, UK, 2001.
Degens, E., Von Herzen, R., Wong, H.-K., Deuser, W., and Jan-nash, H.: Lake Kivu: Structure, chemistry and biology of an East African rift lake, Geol. Rundsch., 62, 245–277, 1973.
Delandmeter, P., Lambrechts, J., Legat, V., Vallaeys, V., Naithani, J., Thiery, W., Remacle, J.-F., and Deleersnijder, E.: A fully consis-tent and conservative vertically adaptive coordinate system for SLIM 3D v0.4 with an application to the thermocline oscilla-tions of Lake Tanganyika, Geosci. Model Dev., 11, 1161–1179, https://doi.org/10.5194/gmd-11-1161-2018, 2018.
Descy, J.-P., Darchambeau, F., and Schmid, M.: Lake Kivu: Past and Present, in: Lake Kivu: Limnology and Biogeochemistry of a Tropical Great Lake, edited by: Descy, J.-P., Darchambeau, F., and Schmid, M., Springer, Dordrecht, the Netherlands, 1–11, 2012.
Dinku, T., Chidzambwa, S., Ceccato, P., Connor, S. J., and Ro-pelewski, C. F.: Validation of high-resolution satellite rainfall products over complex terrain, Int. J. Remote Sens., 29, 4097– 4110, 2008.
Docquier, D., Thiery, W., Lhermitte, S., and van Lipzig, N.: Multi-year wind dynamics around Lake Tanganyika, Clim. Dynam., 47, 3191–3202, 2016.
East African Community: Enhancing Safety of Navigation and Ef-ficient Exploitation of Natural Resources over Lake Victoria and its Basin by Strengthening Meteorological Services on the Lake, Tech. Rep. October, Approved by the East African Community Council of Ministers, 2011.
Feingold, G.: Parametrization of the evaporation of rainfall for use in General Circulation Models, J. Atmos. Sci., 50, 3454–3467, 1993.
Frank, H. and Althoen, S. C.: Statistics: concepts and applications, Cambridge University Press, Cambridge, UK, 1994.
Green, T. and Houk, D. F.: The mixing of rain with near-surface water, J. Fluid Mech., 90, 569–588, 1979.
Guillod, B. P., Orlowsky, B., Miralles, D. G., Teuling, A. J., and Seneviratne, S. I.: Reconciling spatial and temporal soil moisture effects on afternoon rainfall, Nat. Commun., 6, 6443, https://doi.org/10.1038/ncomms7443, 2015.
Harrison, E. L. and Veron, F.: Near-surface turbulence and buoy-ancy induced by heavy rainfall, J. Fluid Mech., 830, 602–630, 2017.
James, R., Washington, R., Abiodun, B., Kay, G., Mutemi, J., Pokam, W., Hart, N., Artan, G., and Senior, C.: Evaluating cli-mate models with an African lens, B. Am. Meteorol. Soc., 99, 313–336, 2018.
Kamburova, P. L. and Ludlam, F. H.: Rainfall evaporation in thun-derstorm downdraughts, Q. J. Roy. Meteor. Soc., 94, 510–518, 1968.
Katsaros, K. and Buettner, K. J. K.: Influence of rainfall on tem-perature and salinity of the ocean surface, J. Appl. Meteorol., 8, 15–18, 1969.
Kimani, M. W., Hoedjes, J. C. B., and Su, Z.: An Assess-ment of Satellite-Derived Rainfall Products Relative to Ground Observations over East Africa, Remote Sensing, 9, 430, https://doi.org/10.3390/rs9050430, 2017.
Knupp, K. R. and Cotton, W. R.: Convective cloud downdraft struc-ture: an interpretive survey, Rev. Geophys., 23, 183–215, 1985. Lange, P. A., Van der Graaf, G., and Gade, M.: Rain-induced
sub-surface turbulence measured using image processing methods, in: Proc. IGARSS, 7, 3175–3177, 2000.
Le Moigne, P., Colin, J., and Decharme, B.: Impact of lake surface temperatures simulated by the FLake scheme in the CNRM-CM5 climate model, Tellus A, 68, 31274, https://doi.org/10.3402/tellusa.v68.31274, 2016.
Lorenz, R., Argüeso, D., Donat, M. G., Pitman, A. J., Hurk, B., Berg, A., Lawrence, D. M., Chéruy, F., Ducharne, A., Hage-mann, S., Meier, A., Milly, P. C. D., and Seneviratne, S. I.: Influ-ence of land-atmosphere feedbacks on temperature and precip-itation extremes in the GLACE-CMIP5 ensemble, J. Geophys. Res.-Atmos., 121, 607–623, 2016.
Marshall, J. S. and Palmer, W. M.: The distribution of raindrops with size, J. Meteorol., 5, 165–166, 1948.
Mironov, D. V., Heise, E., Kourzeneva, E., Ritter, B., Schneider, N., and Terzhevik, A.: Implementation of the lake parameterisa-tion scheme FLake into the numerical weather predicparameterisa-tion model COSMO, Boreal Environ. Res., 15, 218–230, 2010.
Morana, C., Borges, A. V., Roland, F. A. E., Darchambeau, F., De-scy, J.-P., and Bouillon, S.: Methanotrophy within the water col-umn of a large meromictic tropical lake (Lake Kivu, East Africa), Biogeosciences, 12, 2077–2088, https://doi.org/10.5194/bg-12-2077-2015, 2015a.
Morana, C., Darchambeau, F., Roland, F. A. E., Borges, A. V., Muvundja, F., Kelemen, Z., Masilya, P., Descy, J.-P., and Bouillon, S.: Biogeochemistry of a large and deep tropical lake (Lake Kivu, East Africa: insights from a stable isotope study covering an annual cycle, Biogeosciences, 12, 4953–4963, https://doi.org/10.5194/bg-12-4953-2015, 2015b.
Morana, C., Roland, F. A. E., Crowe, S. A., Llirós, M., Borges, A. V., Darchambeau, F., and Bouillon, S.: Chemoautotrophy and anoxygenic photosynthesis within the water column of a large meromictic tropical lake (Lake Kivu, East Africa), Limnol. Oceanogr., 61, 1424–1437, 2016.
O’Reilly, C. M., Alin, S. R., Plisnier, P.-D., Cohen, A. S., and Mc-Kee, B. A.: Climate change decreases aquatic ecosystem produc-tivity of Lake Tanganyika, Africa., Nature, 424, 766–768, 2003. Prosperetti, A., Crum, L. A., and Pumphrey, H. C.: The underwater noise of rain, J. Geophys. Res.-Oceans, 94, 3255–3259, 1989. Rein, M.: The transitional regime between coalescing and splashing
drops, J. Fluid Mech., 306, 145–165, 1996.
Reverdin, G., Morisset, S., Boutin, J., and Martin, N.: Rain-induced variability of near sea-surface T and S from drifter data, J. Geophys. Res., 117, C02032, https://doi.org/10.1029/2011JC007549, 2012.
Salles, C., Poesen, J., and Sempere-Torres, D.: Kinetic energy of rain and its functional relationship with intensity, J. Hydrol., 257, 256–270, 2002.
Schlesinger, M. E. and Oh, J.-H.: A parametrization of the evapora-tion of rainfall, Mon. Weather Rev., 116, 1887–1895, 1988. Schmid, M., Halbwachs, M., Wehrli, B., and Wüest, A.: Weak
mix-ing in Lake Kivu: New insights indicate increasmix-ing risk of un-controlled gas eruption, Geochem. Geophy. Geosy., 6, Q07009, https://doi.org/10.1029/2004GC000892, 2005.
Seneviratne, S. I., Corti, T., Davin, E. L., Hirschi, M., Jaeger, E. B., Lehner, I., Orlowsky, B., and Teuling, A. J.: Investigating soil moisture-climate interactions in a changing climate: A review, Earth-Sci. Rev., 99, 125–161, 2010.
Skyllingstad, E. D. and Denbo, D. W.: An ocean large-eddy sim-ulation of Langmuir circsim-ulations and convection in the surface mixed layer, J. Geophys. Res.-Oceans, 100, 8501–8522, 1995. Spigel, R. and Coulter, G.: Comparison of Hydorology and
phys-ical limnology of the East African Great Lakes: Tanganyika, Malawi, Victoria, Kivu and Turkana (with references to some North American Great Lakes), in: The Limnology, Climatology and Paleoclimatology of the East African lakes, edited by: John-son, T. and Odada, E., Gordon and Breach Publishers, Amster-dam, the Netherlands, 103–140, 1996.
Srivastava, R. C.: A Model of Intense Downdrafts Driven by the Melting and Evaporation of Precipitation, J. Atmos. Sci., 44, 1752–1773, 1987.
Sylla, M. B., Giorgi, F., Coppola, E., and Mariotti, L.: Uncertainties in daily rainfall over Africa: assessment of gridded observation products and evaluation of a regional climate model simulation, Int. J. Climatol., 33, 1805–1817, 2013.
Taylor, C. M., de Jeu, R. A. M., Guichard, F., Harris, P. P., and Dorigo, W. A.: Afternoon rain more likely over drier soils, Na-ture, 489, 423–426, 2012.
Thiery, W., Martynov, A., Darchambeau, F., Descy, J.-P., Plisnier, P.-D., Sushama, L., and van Lipzig, N. P. M.: Understanding the performance of the FLake model over two African Great Lakes, Geosci. Model Dev., 7, 317–337, https://doi.org/10.5194/gmd-7-317-2014, 2014a.
Thiery, W., Stepanenko, V. M., Fang, X., Jöhnk, K. D., Li, Z., Martynov, A., Perroud, M., Subin, Z. M., Darchambeau, F., Mironov, D., and van Lipzig, N. P. M.: LakeMIP Kivu: Evaluating the representation of a large, deep tropical lake by a set of 1-dimensional lake models, Tellus A, 66, 21390, https://doi.org/10.3402/tellusa.v66.21390, 2014b.
Thiery, W., Davin, E. L., Panitz, H.-J., Demuzere, M., Lhermitte, S., and van Lipzig, N. P. M.: The Impact of the African Great Lakes on the Regional Climate, J. Climate, 28, 4061–4085, 2015. Thiery, W., Davin, E. L., Seneviratne, S. I., Bedka, K.,
Lher-mitte, S., and van Lipzig, N. P. M.: Hazardous thunderstorm intensification over Lake Victoria, Nat. Commun., 7, 12786, https://doi.org/10.1038/ncomms12786, 2016.
Thiery, W., Gudmundsson, L., Bedka, K., Semazzi, F. H. M., Lher-mitte, S., Willems, P., van Lipzig, N. P. M., and Seneviratne, S. I.: Early warnings of hazardous thunderstorms over Lake Victoria, Environ. Res. Lett., 12, 074012, https://doi.org/10.1088/1748-9326/aa7521, 2017.
Townsend, A. A.: The structure of turbulent shear flow, Cambridge University Press, Cambridge, UK, 1976.
van Beek, L. P. H., Eikelboom, T., van Vliet, M. T. H., and Bierkens, M. F. P.: A physically based model of global fresh-water surface temperature, Water Resour. Res., 48, w09530, https://doi.org/10.1029/2012WR011819, 2012.
van Dijk, A., Bruijnzeel, L., and Rosewell, C.: Rainfall intensity-kinetic energy relationships: A critical literature appraisal, J. Hy-drol., 261, 1–23, 2002.
Vanderkelen, I., van Lipzig, N. P. M., and Thiery, W.: Modelling the water balance of Lake Victoria (East Africa) – Part 1: Ob-servational analysis, Hydrol. Earth Syst. Sci., 22, 5509–5525, https://doi.org/10.5194/hess-22-5509-2018, 2018a.
Vanderkelen, I., van Lipzig, N. P. M., and Thiery, W.: Modelling the water balance of Lake Victoria (East Africa) – Part 2: Future projections, Hydrol. Earth Syst. Sci., 22, 5527–5549, https://doi.org/10.5194/hess-22-5527-2018, 2018b.
Verburg, P. and Antenucci, J. P.: Persistent unstable atmospheric boundary layer enhances sensible and latent heat loss in a tropi-cal great lake: Lake Tanganyika, J. Geophys. Res.-Atmos., 115, d11109, https://doi.org/10.1029/2009JD012839, 2010.
Verburg, P. and Hecky, R.: Wind patterns, evaporation, and re-lated physical variables in Lake Tanganyika, East Africa, J. Great Lakes Res., 29, 48–61, 2003.
Verburg, P. and Hecky, R.: The physics of the warming of Lake Tan-ganyika by climate change, Limnol. Oceanogr., 54, 2418–2430, 2009.
Verburg, P., Hecky, R. E., and Kling, H.: Ecological consequences of a century of warming in Lake Tanganyika, Science, 301, 505– 507, 2003.
Verburg, P., Antenucci, J. P., and Hecky, R. E.: Differential cool-ing drives large-scale convective circulation in Lake Tanganyika, Limnol. Oceanogr., 56, 910–926, 2011.
Wan, Z.: New refinements and validation of the MODIS Land-Surface Temperature/Emissivity products, Remote Sens. Envi-ron., 112, 59–74, 2008.
Wei, N., Dai, Y., Zhang, M., Zhou, L., Ji, D., Zhu, S., and Wang, L.: Impact of precipitation-induced sensible heat on the simula-tion of land-surface air temperature, J. Adv. Model. Earth Sy., 6, 1311–1320, 2014.
Weyhenmeyer, G., Mackay, M., Stockwell, J., Thiery, W., Grossart, H.-P., Augusto-Silva, P., Baulch, H., de Eyto, E., Hejzlar, J., Kan-gur, K., Kirillin, G., Pierson, D., Rusak, J., Sadro, S., and Wool-way, I.: Citizen Science shows systematic changes in the temper-ature difference between air and inland waters with global warm-ing, Sci. Rep.-UK, 7, 43890, https://doi.org/10.1038/srep43890, 2017.
Woodhams, B. J., Birch, C. E., Marsham, J. H., Bain, C. L., Roberts, N. M., and Boyd, D. F. A.: What Is the Added Value of a Convection-Permitting Model for Forecasting Extreme Rainfall over Tropical East Africa?, Mon. Weather Rev., 146, 2757–2780, 2018.
Yu, N., Boudevillain, B., Delrieu, G., and Uijlenhoet, R.: Estimation of rain kinetic energy from radar reflectivity and/or rain rate based on a scaling formulation of the raindrop size distribution, Water Resour. Res., 48, w04505, https://doi.org/10.1029/2011WR011437, 2012.