THE BEHAVIOUR OF SOLDER PASTE IN STENCIL
PRINTING FOR SURFACE MOUNT ASSEMBLY
DA HE
B.Eng., M.Sc.Behaviour of Solder Paste in Stencil Printing
for Surface Mount Assembly
Da He
B.Eng., M.Sc.
T.I.M.E. Research Institute
Department of Aeronautical, Mechanical and Manufacturing Engineering
University of Salford, Salford, UK
Submitted in Partial Fulfilment of the Requirements of the
Table of Contents
Acknowledgements List of Figures List of Tables Abstract
Chapter One Introduction 1
1.1 Overview and problem description 1
1.2 Research objectives 4
1.3 Overview of thesis 5
Chapter Two Review of relevant literature 6
2.1 Characterization of solder pastes 6
2.1.1 Solder particles 6
2.1.2 Rehology of solder paste 9
2.2 Modelling of solder paste printing 14
2.3 Experimental investigations 25
Chapter three Modelling of the behaviour of solder paste in stencil printing using
vibrating squeegee 35
3.1 Paste roll in front the vibrating squeegee 35
3.1.1 The displacement, velocisty and accelerate of the vibrating
squeegee 36
3.1.2 The linear motion of the solder paste 39 3.1.3 The paste roll in front the squeegee and the filling of paste to
the stencil apertures 41
3.2 The packing of solder paste inside apertures 46 3.2.1 Introduction of oscillatory shear theory 47
suspensions 48 3.2.3 Prediction of solder paste behaviour inside the aperture 52 3.2.4 Effect of the vibration parameters 55 3.3 Summary of Chapter three 61
Chapter Four Experiments on solder paste response to vibration 63 4.1 High frequency oscillatory shear measurement of solder paste 63 4.1.1 Instrumentation and shearing methods 64 4.1.2 Experimental procedure 65 4.1.3 Oscillatory parameters and solder paste samples 66 4.1.4 Oscillatory shear measurement results and discussion 67 4.1.5 Summary of oscillatory shear measurements 71 4.2 Experimental study of paste roll in front of a vibrating squeegee 72 4.2.1 Experimental setup and paste samples 73 4.2.2 Experimental procedure 76 4.2.3 Results of vibrating blade experiment and discussion 77 4.2.4 Main conclusion vibrating squeegee experiments 87 4.2.5 Further inprovements to the experiments 88 4.3 The behaviour of solder paste inside a vibrating container 89 4.3.1 Experimental procedure 89 4.3.2 Results and discussion of vibrating container 90 4.3.3 Main conclusion of the vibration experiment of solder paste
inside a container 96
4.4 Summary of Chapter four 96
Chapter Five Numerical simulation of the maximum solid volume concentration
and the micro-structure of solder paste 98
5.1 Highlight of Chapter five 98
5.2.2 Computer simulation methods 106 5.3 The new simulation model for the random packing of solder particles
and the microstructure of solder paste 114 5.3.1 The generation of particle sizes and their initial positions 114 5.3.2 The relocation of particle positions - relaxation algorithm 120 5.3.3 The generation of micro-structure - particle separation 124 5.3.4 Effect of particle number on the packing density and isostatic
packing test 127
5.4 The simulation results and discussion 129 5.4.1 The random packing of solder particles 129 5.4.2 The micro-structure of solder paste 134 5.5 Summary of Chapter five 137
6.
7.
The effects of particle size distributions on the viscosity and on the
hydro-dynamic interaction between adjacent particles in solder paste flow 139 6.1 The effect of particle size distributions on the viscosity of dense
suspensions 139
6.1.1 Introduction of viscosity models of dense suspensions 140 6.1.2 A modified viscosity model 146 6.1.3 The effect of particle size distributions on the viscosity of
solder paste 148
6.2 The effect of particle size distributions on neighbouring particle
interaction 156
6.2.1 Modelling of particle interaction in suspensions 156 6.2.2 Hydro-dynamic interaction between adjacent solder particles
in paste flow 161
6.3 Summary of chapter six 166
Summary and Suggestion for Future Work 168
7.1 Summary 168
7.2.2 Experimental validation of the theoretical predictions 170 7.2.3 The random packing of solder particles and the microstructure
of solder pastes 172
7.2.4 Solder paste viscosity and solder particle hydrodynamic
interaction 172
7.3 Suggestion for future work 173
Appendix 1 Programme for simulation of particle random packing 175 Appendix 2 Programme for simulation of dense suspension's microstructure. . 195
I would like to thank my supervisor Dr N N Ekere for having identified this research project and given me the opportunity to carry out this work. His help and expert guidance throughout the period of writing up is gratefully acknowledged.
I also extend my gratitude to the following people: Dr A M Dore who supported me to apply for the Overseas Research Student Award, Mark and Mike for their help and advise during my study at Salford, N Clark, B Wroe, R Gardner, S Kenway, H Pendlebury and the Department Workshop staff for their assistance to carry out the experiments.
Figure 1.1 Stencil printing of solder paste and sub-processes 1 Figure 2.1 Relation between pitch and Maximum particle size 8
Figure 2.2 Hysteresis loop of solder paste 9
Figure 2.3 Time-dependent effect under constant shear rate 10 Figure 2.4 Pseudoplasticity of solder paste fitting with Casson model 11 Figure 2.5 Relation between minimum pad separation and yield point 12 Figure 2.6 Viscosity vs solid volume fraction of Sn63 paste 13
Figure 2.7 Off-contact scrren printing of ink 16
Figure 2.8 Streamline and pressure distribution of Riemer's model 18 Figure 2.9 Solder paste shear rate at stencil surface 19 Figure 2.10 Solder paste pressure on the stencil surface 19
Figure 2.11 The motion of paste relative to squeegee 20
Figure 2.12 Deposit thickness, H, in relation with h, paste velocity and pressure profiles.21 Figure 2.13 Effect of solid volume fraction of solder particles on tensile stress in paste ..23 Figure 2.14 Effect of stencil thickness on tensile stress in paste 23 Figure 2.15 Comparison of squeegee profile cross aperture 24 Figure 2.16 Comparison of aperture shapes by different process methods 26
Figure 2.17 Comparison of ultra-fine-pitch traces of different aperture processes 27
Figure 2.18 Paste deposit height profile 28
Figure 2.19 Shear stress applied to paste sample 29
Figure 2.20 Shear stress vs gap between plates 30
Figure 2.21 Main effect plot 33
Figure 2.22 Interaction plot 33
Figure 3.1 Stencil printing using a vibrating squeegee 37 Figure 3.2 Comparison of squeegee velocities for different amplitudes 38 Figure 3.3 Comparison of squeegee displacements for different amplitudes 38 Figure 3.4 Displacement and velocity profiles of squeegee and paste roll 40
Figure 3.5 Forces acting on paste roll 42
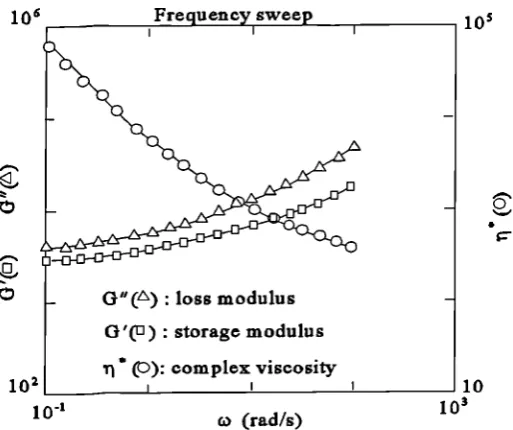
Figure 3.9 Steady shear stress and superimposed shear stress for CMC 51 Figure 3.10 Response of fresh cement paste to frequency sweep 52 Figure 3.11 Behaviour of solder paste beneath the tip of a vibrating squeegee 53 Figure 3.12 Effect of amplitude on squeegee displacement 56 Figure 3.13 Effect of frequency on squeegee displacement 57 Figure 3.14 Schematic of squeegee displacements for different amplitudes 58 Figure 3.15 Schematic of squeegee displacements for different frequencies 59 Figure 3.16 The backward oscillation of vibrating squeegee 60
Figure 4.1 StressTech Rheometer 64
Figure 4.2 Methods of oscillatory shear measurement 65
Figure 4.3 Strain control oscillatory measurement of solder paste 67 Figure 4.4 Shear stress control oscillatory measurement of solder paste, stress=500 Pa. .69 Figure 4.5 Shear stress control oscillatory measurement of solder paste, stress=1KPa . . 69 Figure 4.6 Frequency reverse loop measurement results 72
Figure 4.7 Apparatus I of vibrating squeegee system 74
Figure 4.8 Apparatus II of vibrating squeegee system 75
Figure 4.9 Illustration of experimental setup of vibrating squeegee system 75 Figure 4.10 though Figure 4.19 Pictures of paste response to vibrating squeegee 78-82 Figure 4.20 Correlation between suitable frequency and amplitude 84 Figure 4.21 Effect of vibration on the reduction of paste sticking on the blade 84 Figure 4.22 Generation of air bubbles and roughness of paste roll surface 86 Figure 4.23 Response of high metal load paste to vibrating squeegee 87
Figure 4.24 Picture of vibrating container 90
Figure 4.25 to Figure 4.28 Pictures of paste response to vibration inside container. . . 92-93 Figure 4.29 Microscope photo of particle arrangement by vibration 94 Figure 4.30 The effect of vibration on particle arrangement 95
Figure 5.1 Packing density versus ball number, N 101
Figure 5.2 Contact between balls: (a) close contact, (b) near contact 102
Figure 5.6 Centre growing model 108 Figure 5.7 Jodrey's separation sequence of overlap particles 111 Figure 5.8 The moving of a particle by Clarke's model 112 Figure 5.9 The generation of particle size from the accumulation probability 115 Figure 5.10 Comparison of simulation result with theoretical normal distribution 118 Figure 5.11 Comparison of simulation reslt with theoretical log-normal distribution. . 119 Figure 5.12 The new position of particle i respect to particle] 121
Figure 5.13 The relocation of particle i 122
Figure 5.14 Relocation of particles and overlap rela)dtions 122 Figure 5.15 The disturbing distance and direction of particle i 127 Figure 5.16 The influence of particle number on the packing density 128 Figure 5.17 Two and three-dimensional views of particle random packing 129 Figure 5.18 The relationship between packing density and particle size dispersion 131 Figure 5.19 Average contact number vs standard deviation of particle radii 132
Figure 5.20 Percentage histogram of contact number 133
Figure 5.21 The relationship between contact number and average particle radius 133 Figure 5.22 The micro-structure of a dense suspension of 0.5 solid volume fraction. . 134 Figure 5.23 The average neighbour number vs particle standard deviation 136 Figure 5.24 Average gap between neighbour particles vs particle standard deviation. 136
Figure 6.1 Relative viscosity vs solid volume fraction measured by different
investigators 144
Figure 6.2 Comparison of viscosity models of suspension of equal particles 146 Figure 6.3 Comparison of the effect of n on the viscosity of dense suspensions 148
Figure 6.4 Relative viscosity of bimodal suspensions 150
Figure 6.5 Comparison of close random packing density and fluidity limit 150 Figure 6.6 Relative viscosity vs relative solid volume fraction 151 Figure 6.7 The agreement between Eq. (6.17) and Eq. (6.12) 152 Figure 6.8 The effect of particle size distributions on suspension viscosity,
Figure 6.10 Comparison of different particle size distributions 155 Figure 6.11 Hydrodynamic interaction between neighbour particles 159 Figure 6.12 Effect of € on F 11 and F 1 112 163 Figure 6.13 Effect of € on F, and F112 164
Figure 6.14 Effect of a on f, and fj 1 165
List of Tables
Table 2.1 Levels of parameters 32
Table 4.1 Experiment condition 66
Table 4.2 Test sequence and parameters 77 Table 5.1 Statistic data of simulation results 130 Table 6.1 Comparison of viscositis of dense suspensions with different
One of the main challenges facing the electronics manufacturing industry in solder paste printing for ultra-fine pitch surface mount and flip-chip assembly is the difficulty in achieving consistent paste deposit volumes from pad-to-pad. At the very small aperture geometries required for ultra-fine pitch and flip chip assembly, flow properties of the paste becomes one of the dominant factors in the printing process. It is widely accepted that over 60% of assembly defects originate from the solder paste printing stage, and hence the urgent need for a better understanding of solder paste rheology, its behaviour during printing, and its impact on defect generation. This understanding is essential for achieving proper control of the printing process.
This thesis presents the result of work on the modelling and computer simulation of solder paste behaviour during printing, and consists of three main parts. The first part concerns the modelling of paste behaviour in stencil printing using a vibrating squeegee. The performance of the vibrating squeegee is analysed and process models developed for predicting the ideal printing conditions. In the second part, the random packing of solder powder and the microstructure of solder paste are numerically simulated by applying Monte Carlo method. The effect particle size distributions on the paste microstructure is studied in this part. Based on the simulation results of the second part, the third part concerns the study of the effect of particle size distribution on the paste viscosity and the hydrodynamic interaction between adjacent particles during paste flow. A theoretical enhanced model for predicting the viscosity of dense suspensions such as solder pastes has been developed. This correlates relative viscosity with particle size distribution and with solid volume fraction of dense suspensions.
Squeegee
Solder Paste
Stencil
Stencil printing of solder paste
PCB
41111%
NM MI
ph wow/ /13
1111111111MININNIMMINIMONIUMW
Introduction
1.1 Overview and problem description
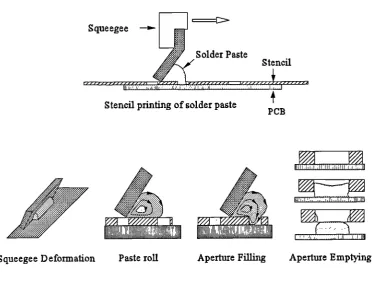
The stencil printing of solder paste is one of the key steps in the reflow soldering of electronic components and Printed Circuit Boards (PCB's) using the Surface Mount Technology (SMT) technique. In general, the stencil printing process must transfer accurate and consistent volumes of solder paste deposits onto the pads on the PCB. The components are then placed onto the PCB before the populated board is passed through an Infra-red reflow oven to complete the soldering process. Figure 1.1 shows a schematic of the stencil printing process and the key sub-processes in the printing process (Ekere, 1994).
[image:13.595.88.462.419.707.2]Squeegee Deformation Paste roll Aperture Filling Aperture Emptying
As can be seen in Figure 1.1, the process can be divided into four main stages:
a). The squeegee is lowered onto the stencil to a pre-set squeegee pressure; b). The squeegee pushes solder paste to produce a paste roll in front the squeegee; c). The paste ahead of the paste roll is squeezed by the squeegee into the apertures; d). Paste is transferred onto the pads on the PCB as stencil is separated from PCB.
As the trend towards miniaturisation of electronic products continues, depositing precise volumes of solder paste onto the PCB from pad-to-pad, and from board-to-board is becoming increasingly difficult at the fine-, and ultra-fine-pitch level. The importance of the paste printing process is underlined by the fact that over 60% of the surface mount assembly defects are estimated to originate from the stencil printing process (Currie, 1997). The stencil printing process is still not very well understood, and is known to be governed by complex interactions between a large number of process parameters and variables. These factors can be classified into three groups:
a). Printing equipment variables (eg. stencil material and aperture fabrication); b). Printing process parameters (eg. printing speed and squeegee pressure); c). Solder paste properties (eg. viscosity and creep recovery).
flux/vehicle system and are determined by the solid volume fraction, the solder powder particle size and size distribution. There is thus a need for a proper understanding of the effects of various paste properties and paste microstructure as it passes through the various sub-processes, and to correlate the microstructure to the printing process performance.
As the demand for miniature hand-held and pocket electronic products continue, the major challenge facing the electronics manufacturing industry is to put more and more components into a unit area on a PCB. To meet the challenges posed by consumer's requirement for miniature products, high density components with as many as 500 input and output (I10) leads, and with pitch sizes as small as 0.3 mm are now being designed into new products. In response, the electronics manufacture and assembly industry is forced to develop innovative processing techniques to deal such fine-pitch components. An example of one of the recent developments is the application of sinusoidal vibration to the squeegee system in the solder paste stencil printing process (Anon, 1994). The use of vibrating squeegee can provide several benefits to the stencil printing process, and this is made possible by the changes in the solder paste properties and its behaviour as it experiences sinusoidal vibration. A review of the literature shows no records of any studies on this new technique. Proper understanding of the pastes' viscoelastic properties under the action of the vibrating squeegee is important for optimising the printing quality.
packing structure inside the aperture.
1.2 Research objectives
As stated earlier, the solder paste stencil printing process is a very critical stage in the SMT assembly process, and the printing performance is directly influenced by the properties of the solder paste. Although a number of papers on the modelling of solder paste printing have been reported in the literature (see Literature Review in Chapter two), there are no records of any previous work on the application of sinusoidal vibration to the stencil printing process, and specifically on the behaviour of the paste under the action of the vibrating squeegee. The literature search also showed that there are very few reports on the paste microstructure and its effect on the solder paste viscosity.
In this study, the following research issues and questions were addressed:
a). The behaviour of solder paste in stencil printing using a vibrating squeegee; b). The effects of squeegee vibration parameters such as frequency and amplitude
on the printing quality;
c). The pastes microstructure and the random distribution of solder particles within the flux/vehicle system;
d). The effect of solder powder particle size distribution on the hydro-dynamic interactions between neighbouring particles within the solder paste;
e). The effect of solder powder particle size distribution on the solder paste viscosity.
The main research objectives are as follows:
b). To evaluate the effects of the vibration parameters, and to determine the process window;
c). To develop computer simulation models of solder powder packing, and to study the random packing of dispersed particles, and the microstructure of solder paste;
d). To develop models for predicting solder paste viscosity based on the solder powder particle size distribution and the solid volume fraction.
1.3 Overview of thesis
Review of Relevant Literature
This chapter presents a literature review on the stencil printing of solder pastes used in the reflow soldering of SM assemblies. The review covers the period from the introduction of the SMT assembly technique to date and is organised under three different headings: the characterisation of solder pastes, the modelling of solder paste printing and the experimental work on the printing.
2.1 Characterization of solder pastes
As was stated earlier in section 1.1 the majority of SM assembly defects are thought to originate at the solder paste printing process stage, and proper understanding of the effect of the paste properties and their interactions with process and equipment parameters holds the key to control the printing process. To this end, a great deal of the work on solder pastes reported in the literature concerns the characterisation of paste rheology. A good understanding of the paste processing behaviour is essential for achieving defect free SM assembly and reliable solder joints.
Most of the early work, notably Roos-Kozel (1983,1984), MacKay (1981), Daebler (1981), Hwang (1989), Park (1993), concentrated on determining the effect of the solder powder particle size distribution, shape, metal loading, and the rheology of the flux/vehicle system on the viscosity and printing.
2.1.1 Solder particles
would tend to produce greater numbers of extraneous solder balls during paste reflow which are highly undesirable as they may result in electrical shorting of the circuit. The particle size may also influence the oxide content of the paste. Smaller particles will intrinsically have a greater oxide content due to increased surface area per gram of powder. Consequently, flux activity may be wasted on breaking down powder oxides rather than substrate oxides. This may result in poor solderability. Rubin (1983) showed that high oxide content, which may be present in small solder powder particles tends to increase solder ball formation. The similar result was reported by Lee et al (1994), but their work also indicated that finer powder can help to reduce slumping which is the major cause of bridging defects in reflow soldering.
In another study of solder pastes for fine pitch printing, Morris et al (1991) suggested a rule for achieving good stencil printing performance is that the diameter of the largest particle should not be larger than one-half the thickness of the stencil (i.e., for a 102 gm thick stencil, the largest solder particles should be smaller than 51 gm). Hwang (1994) also indicated that it is alway advantageous to use the coarsest powder allowed for achieving the desired printability so the lowest possible cost and proper fluxing can be obtained. However, it should be noted that the finer powders offer more latitude in the printing process. Lee et al (1994) investigated the effect of solder particle size on the defect rate of fine pitch printing. Their result showed that both smear and insufficient deposit defects can be reduced by decreasing the particle size. Figure 2.1 shows the relationship between pitch size and maximum particle size of solder powder for achieving a printing defect rate of less than 0.1%.
§
1
i 201
a40
Printing defect rate < 0.1%
1 1
o 1 1
o 0.25 0.50 0.75 1.00 1.25
or non-spherical particles can help to reduce slumping (and flowing out during paste heating) as the elongated particles enhance mechanical interlocking. Evan et al (1987) and Hwang (1994) suggested that smooth surface and spherical shape are the desired characteristics of solder particles for good stencil printing and soldering performance. Evan et al also agreed that spherical particles provide the most consistent rheological behaviour and may increase screen or stencil life when compared with non-spherical particles. Mannan et al (1995) measured the particle size distribution and shape. They found that there exists a small percentage of particles which are dumbbell shaped, ellipsoidal or more irregular. They also indicated that irregular particles will tend to cause the formation of particle clusters and agglomeration, which may contribute to the clogging of stencil apertures.
Pitch (mm)
Figure 2.1 Relation between pitch and maximum particle size.
a.. 3528
{A 2648
cd 1768
880
2.1.2 Rheology of solder paste
The rheology of solder pastes is influenced by two main factors: the rheology of the flux/vehicle system, and the solder powder particle characteristics (size, size distribution, shape solid volume fraction). In practice, the major elements used by the solder paste manufacturers for controlling the rheology of the solder paste are the solder particle size distribution, metal loading and flux/vehicle rheology. In this section, four key properties of solder paste: viscosity, thixotropy, pseudoplasticity and yield point will be examined.
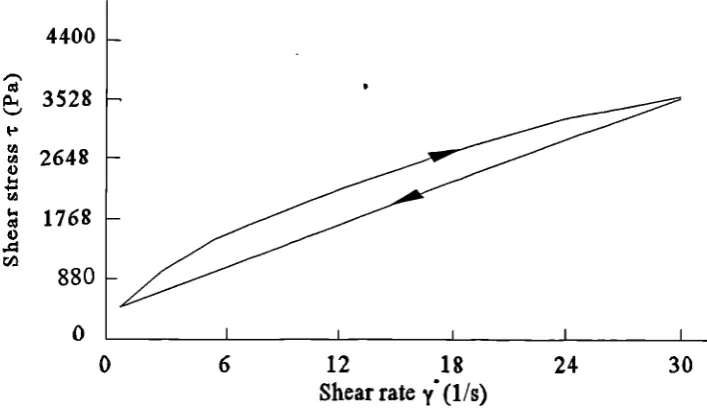
Thixotropy implies the paste will change viscosity over time under a constant shear rate. This behaviour may be exemplified by the presence of a hysteresis loop in the shear stress vs shear rate curves for increasing and decreasing shear rate, as shown in Figure 2.2 (Hwang, 1994). Lapasin et al (1994) measured the shear stress in solder paste under constant shear rate, as shown in Figure 2.3. Note that, under constant shear rate, the shear stress decreases with time. Hwang (1994) indicated that although the thixotropic nature of solder paste is assumed, the measure of the thixotropy is important to the resolution of
4400
0 6 12 18 24 30
[image:21.595.103.457.475.680.2]Shear rate (Vs)•
i = 50 el
a
...
-paste deposition. Excessive thixotropy hinders the viscosity recovery process, causing post-print slumping. On the other hand, shear thinning is advantageous, facilitating the transfer of paste through the narrow stencil apertures. Evans et al (1987) believed that thixotropic behaviour of solder paste is undesirable as it causes the paste to fluctuate in viscosity over the course of a working day as the paste is agitated by mixing, handling, and printing. Thixotropy may also make reproducible viscosity measurement difficult depending on how much recovery time occurs after initial agitation of the paste.
0 100 200 300 400 500
Time t (s)
Figure 2.3 Time-dependent effect under constant shear rate
Pseudoplasticity implies that viscosity of solder paste will drop dramatically on the application of shear stresses and subsequently recover when the stresses are removed. This behaviour is illustrated in Figure 2.3. Lapasin et al (1994) measured the pseudoplasticity of solder paste and fitted the experimental data with the Casson model as:
where To is the yield point or yield stress as y i --n 0 and ri ,., is the infinite viscosity as
Figure 2.4 shows the fitting of measurement data with the Casson model. A review of the work by Hwang, Evans et al, Lapasin et al shows that they agree that the plastic flow behaviour of solder paste is desirable for both screen and stencil printing. This behaviour facilitates the filling of solder paste into the apertures under high shear stress and allows the paste deposits to retain the desired shape on the PCB pads after the shear stress is removed.
50 60 10 20 30 40
Shear rate (e)
Figure 2.4 Pseudoplasticity of solder paste fitting with Casson model. (Lapasin)
••nn
0.25
0.20
• 0.15
0.10
g 0.05
0.15 ram thick stencil — — - 0.10 mm thick stencil
•nn
0
0 200 400 600 800 1000
Yield stress (Pa)
Figure 2.5 Relationship between min. pad separation and yield point.
The viscosity of the solder paste is widely considered to be the most important rheological property. The viscosity influences the paste roll in front the squeegee, the filling of the apertures and the paste release from the apertures. The viscosity of solder paste is affected by a lot of factors such as the shear rate, the temperature, the metal load and particle size distribution. Hwang (1994) indicated that "As a convenience, a single-point viscosity has been used as an indicator of paste consistency. It is a useful measurement when the following conditions are met:
• The rheology of the paste is known;
• The paste handling technique immediately prior to measurement is specified; • The measurement technique and equipment are specified;
• The measurement temperature is specified."
3000
---,
I a. 2000
.t' 8' 1000 • • • o -• • is • • •
the viscosity of solder paste. Lee et al (1994) measured the viscosity of Sn63 solder paste as a function of the metal load (the volume fraction of solder powder) which is shown in Figure 2.6. They indicated that the volume fraction of solder powder appears to be more meaningful for a structure-property correlation study of solder paste. The maximum metal load for solder paste is 59%(v/v) or 92.5%(w/w). They attributed the rapid increase in viscosity for high volume fraction to the onset of formation of powder cluster. As result, the viscosity of a high metal load is dictated by the solder powder, and the variation in the flux/vehicle viscosity will have a relatively minor effect on the paste viscosity.
0 10 20 30 40 50 60
Volume fraction (%)
Figure 2.6 Viscosity vs solid volume fraction of Sn63 paste.
(i) a -11,. cc [ 1 - (—) b i
(km
where a and b are positive constants. Mannan et al indicated that, the maximum solid volume fraction, ki, of poly dispersed particles is higher than that of uniform particles, and
hence the lowering of the viscosity. It can be observed from Equation (2.2) that as (I) approaches 4)., ri r tends to be infinite.
There are also some other paste properties that affect the stencil printing process. Lee et al (1994) studied the tack and tack time of solder paste which are indicators of the capability of paste deposits to hold the components on pads prior to reflow. Currie (1997) investigated the tensile strength of solder paste experimentally. In the experiment, paste samples were sandwiched between two parallel plates which were then separated. The force and time required for complete separation of the paste was measured. Experimental result showed that the tensile stress of solder paste depends on both the strain rate and the sample geometry. The empirically enhanced model developed can be used to predict the onset of skipping defect in the aperture emptying process, and it can be used to estimate when skipping is likely to occur for a given stencil aperture geometry and stencil and PCB separation speed.
2.2 Modelling of solder paste printing
The stencil printing of solder paste is a relatively new technique when compared with the well established screen printing technique which is used to produce thick film circuitry on PCB's. The screen printing process is illustrated in Figure 2.7. There are several models of screen printing in the literature which may be applied to stencil printing of solder paste when the differences between the two techniques are identified. Therefore, these screen printing models will be reviewed. Mannan et al (1993) identified the similarities and the differences between the two techniques and discussed the possibility of applying screen
printing models to stencil printing of solder paste. The similarities between the two techniques are:
i.
A squeegee moves along the stencil or screen surface to drive a paste roll ahead (either solder paste or ink). The squeegee generates hydrostatic pressure in the paste roll, which injects the paste into the apertures, and the paste wets the substrate. The squeegee then shears off the paste inside the apertures from the paste roll as it moves over the apertures.Both the solder paste and the ink are non-Newtonian, and the rheological properties change dramatically during the different printing stages.
In both processes, clogging of apertures and smearing of deposits are the main defects.
The differences between the two techniques are:
i.
Screen printing is performed off-contact while stencil printing is generally on contact. Therefore, the screen/stencil and substrate separation patterns are different.In screen printing the pressure difference above and below the screen governs the transfer of ink through the screen and onto the substrate. Whilst, in stencil printing the adhesive forces of paste to the aperture wall and to the substrate are the decisive factors.
The aperture geometries of stencils and screens are different.
iv. The viscosity of solder paste is higher than that of ink and ink can be modelled as a homogeneous fluid. However, for solder paste, the presence of solder particles in the paste can not be ignored, especially as it flows through narrow apertures.
V
14
I
1
Snap-off distance
Figure 2.7 Off-contact screen printing of ink.
ink into the mesh openings. To model the ink roll he employed the simplified Navier-Stokes equation for high viscosity fluid which has the form:
-grad p + rl Al, = 0 (2.3)
where p is the hydrostatic pressure (scalar), v is fluid velocity (vector), 11 is the viscosity of ink, grad = aiax i + atay j, I and j are unit vectors, A = a 2 iax 2 + a 2 iay 2 . In this
equation only viscous forces and pressure drop are considered (other relatively small forces such as gravity, centrifugal force and inertia are neglected) and Newtonian fluid is also assumed. For infinite amount of fluid, Taylor derived a stream function to solve the Stokes equation in cylindrical polar coordinates, r-q). The stream function is presented as:
T = r V T(y, a) (2.4)
where 7(p,a) is the Taylor's function composed of trigonometric functions, a is the wedge
angle between squeegee and screen surface and V is the squeegee speed. The velocity components vr and v are derived from the stream function as:
V = -1 3W V9 =- ---3W
r3par
The hydrostatic pressures on the squeegee and on the screen surface are derived as: (2.5)
1 2a sina
P sq ri V
r a 2 -sin2a
1 2sin2a
Psc ri V (2.6)
r - sin2 a
The total force on the squeegee surface is represented by the integration of the pressure pc, as:
2a sina F
hft = I po sqdr = 1(Q)) , a --sin2 a ri V
where f(Q) is a factor increases with ink quantity (Q) in front of the squeegee. F1 tends to lift the squeegee that may lead to increasing of ink deposit height on the substrate. Equation (2.5) (2.6) and (2.7) establish the effect of ink viscosity, squeegee angle and printing speed on the ink roll, the screen and squeegee surface pressures and lift force acting on the squeegee. Figure 2.8 is the simplified streamline and pressure distribution of Riemer's model.
Riemer's work makes significant contribution both to screen and stencil printings, and some useful common ideas can be taken over directly to model the stencil printing process, such as the paste/ink roll in front of the squeegee, the pressure distributions on the screen and on the squeegee surface and the shear rate in the paste/ink near the contact point between the squeegee and stencil/screen may also be predicted.
PSC
Figure 2.8 Streamline and pressure distribution of Riemer's model.
+ Infinite model
4-4
0 20
0
120 100
• Free swface model
al-
• I-
• 4-• ±
2 4 6 8
Distance along stencil (mm)
Figure 2.9 Solder paste shear rate at stencil surface
• Free suiface model
+ Infinite model
0
• -I; , -r
• •
-r-0 2 4 6 8
Distance along stencil (mm)
It is important to notice that both Riemer and Harahan et al assumed the ink and the paste to be Newtonian fluids. In fact both materials are non-Newtonian and the viscosities vary with shear rate, and usually decrease with an increase in the shear rate. This shear thinning property of both materials significantly affects the pressure and velocity near the squeegee and stencil (or screen) contact point because the shear rate in this region is very high. It is also important to notice that, Riemer and Harahan et al both assumed that there is no slipping at the interface between ink/paste and screen/stencil. However, it has been demonstrated by Kolli et al (1997) that it is only when the ink/paste is properly formulated and printing parameters are carefully selected that the no slipping assumption are true.
Owczarek and Howland (1990a) also modelled the screen printing process. Their model is focused on the flow pattern as ink/paste is injected into screen openings. The flow field ahead of the squeegee is divided into three regions: the pressurization region I, the downward screen cross-flow region II, and the paste accumulation region III, as shown in Figure 2.11. In this model Owczarek et al first raised the concept that underneath the squeegee there is a flow of paste with speed w relative to the substrate in the direction opposite to the squeegee motion, V. This flow is caused by the pressure build-up ahead the
Squeegee
V Region III
Region IT
squeegee. Using continuity equation they derived the relation between the thickness of deposited wet paste, H, and the average paste thickness, h, under the squeegee, as shown in Figure 2.12. The average speed, w, of paste underneath the squeegee is estimated between 0.1 and 0.2 of the squeegee speed. This opposite flow of paste leads to H being higher than h.
Figure 2.12 Deposit thickness H in relation with h, paste velocity and pressure profiles.
squeegee tip, w, and deposit thickness, H, are calculated.
Marman et al (1993) examined Owczarek and Howland's model and examined the idea of building into the model the distortion of the squeegee tip as applied to stencil printing. The power law fluid assumption leads to the calculation of velocity profile and pressure distribution more accurately than the Newtonian fluid assumption. The paste flow under the squeegee in the direction opposite to the squeegee motion is also one of the possible explanations of the observation in stencil printing that the deposits are often higher than the stencil thickness; there are also some assumptions in this model that are questionable such as the neglecting of the vertical velocity component near the squeegee tip and the effect of the screen on the paste flow not being taken into consideration.
In all of the above models, the ink/paste is treated as a uniform, continuous and homogenous liquid. Such a treatment to solder paste may be reasonable in cases where the concerned geometry and dimensions are much larger than the solder particle size, such as modelling the paste roll in front of the squeegee. However, when the particle size is comparable with the geometric dimension, such as the filling and emptying of stencil apertures, where the ratio of the thickness or width of stencil apertures to the particle size is less than 10, the effect of particle size cannot be ignored. In such case the interactions between individual particles should be taken into consideration.
• Volume fraction = 51%
• Volume fraction = 48% 12
RI 10
4
4
2
0
Chapter two
was applied along the aperture length to reduce the number of particles considered. Applying explicit method, the particle positions, the tensile and shear forces in the paste at each step in time were determined by solving the group of force balance equations. Using this simulation technique Mannan et al examined the effects of aperture shape, solid volume fraction and particle size distribution on the tensile stress in the paste during withdrawal.
6 16 26 36 46 56 66 76 86 96
Time (ms)
Figure 2.13 Effect of solid volume fraction of solder particles on tensile stress in the paste.
6 16 26 36 46 56 66 76 86 96 Time (ms)
160
'"El
120
.1.4 00 •,..,
0
A 80 0,..
140 <4
The separation speed of the stencil from the substrate was assumed to be 1 mm/s. Then the tensile stress was compared with the tensile strength of solder paste to predict when skipping will occur. Figure 2.13 shows the effect of solid volume fraction and particle size distribution on the tensile stress in the paste and Figure 2.14 shows the effect of stencil thickness.
Mannan et al (1993, 1994) also theoretically investigated squeegee deformation during stencil printing. First, the static deformation was predicted using stencil material properties; for a squeegee of 90-94 hardness on the Shore A scale, and squeegee/substrate contact force of 480 N/m, Figure 2.15 shows the squeegee profile across a 0.25 mm wide aperture. Then the squeegee was treated as a damped harmonic oscillator and the dynamical deformation during the printing process was predicted by vibration theory. Mannan et al concluded that the use of a hard squeegee increases the defect rate of skipping compared with the use of a soft squeegee; the use of a soft blade tends to scoop more paste out of the aperture than the use of hard one. They suggested that a soft blade should be used for fine-pitch printing, while a hard blade being more suitable for large apertures.
50 100 150 200 250
Aperture width (i.im)
• Actual profile • Theoretical profile
2.3 Experimental investigations
Since the introduction of the stencil printing technique into the assembly process of PCB's, theoretical analysis and numerical simulation models have been developed to study this process and investigate the effects of variables on the performance. Because the number of variables governing this process is very large and their interactions are too complex to be taken into account completely in the models, experimental studies have been and still are widely used. A lot of experimental investigations can be found in the literature. In this section some of the experimental investigations are reviewed.
There are three methods commonly used for fabricating stencils, electroforming, chemical etching and laser cutting. The fabrication can directly affect the paste printing quality. Clouthier (1995) appraised stencils made by different methods for fine-pitch printing. He indicated that electroform method allows for tight tolerance control and is geometrically blind which means different shapes can be produced. Laser cutting provides a fine geometry capability compared to chemical etching, but it tends to leave a rough aperture wall which may hinder the solder paste transfer efficiency. Chemical etching is the most economical means of producing stencils but as pitches continue to reduce, repeatability from aperture to aperture becomes difficult. The aperture's knife edges add to clogging and the deposition of too little solder paste. Measurement on the aperture sizes from 142 samples for each fabrication method, showed that for ultra-fine pitch aperture (0.0045" width) chemical etching and laser cutting show a process variability of between two to four times the process variability for the electroforming method.
Chemical etched Laser cut Electroformed
.0%
The laser-cut and chem-etch stencil apertures are ragged and the ends do not have well-defined corners or end segments as compared with that of electroformed stencil.
Figure 2.16 Comparison of aperture shapes of three fabrication methods. (Clouthier)
Chemical etched Laser cut Electroformed
Figure 2.17 Comparison of fine-pitch traces of three stencil printing processes. (Clouthier)
To meet the tight tolerance requirement for fine-pitch printing and to reduce the cost of the stencil manufacturing, Myklak and Coleman (1995) investigated the application of hybrid stencil: laser cut/chemical etched stencil. The stencil had some apertures laser cut and some apertures chemical etched. Both the laser cut and chemical etched apertures were electro polished. Due to the high cost of laser cutting process only the apertures of 0.5 mm pitch and less were laser cut and the remaining apertures were chemical etched. They experiments demonstrate that the hybrid stencil provides a high printing quality whilst the cost of stencil manufacture is still economical. In addition, this speeds up delivery, which is an essential factor in the fast paced SMT industry.
Squeegee travle direction 200
150
100
50
0
-_
etched stencil was used with different ratios of aperture pitch to aperture width. The apertures were clustered in 100 groups with 100 apertures in each group. In each group of 100 apertures some were orientated perpendicularly and some parallel to the squeegee travel direction. Figure 2.18 shows the paste deposit height profile that the aperture was perpendicular to the squeegee travel direction. To eliminate the effect of other factors the underneath of the stencil was cleaned after each print stroke. Four solder pastes were used in this experiment. For each paste, three values of separation speed (1, 10, and 5 mm/s) were examined. The squeegee speed was 12 mm/s. Their experiment results confirmed that the effect of varying separation speed on the print quality is paste-dependent, but small. For some pastes a low separation speed is not favourable. But for other pastes there is no statistically significant effect of separation speed. For a 0.35 mm fine pitch, bridging is the most serious defect which indicates that either the paste flow underneath the stencil during separation (leading to bridging) is affected by separation speed or the paste deposits are likely to slump at different separation speeds. Compared with bridging, the skipping defect is insignificant and there is no correlation with separation speed which means that the adhesive force of the paste to the substrate dominates over the frictional forces at the aperture walls for all values of separation speed. The bridging defect rate, for 0.35 mm pitch, obtained by this experiment was from a minimum value of 7.5% up to a maximum value of 32.5%, which is in agreement with Clouthier's and Myklak and Coleman's conclusions that chemical etched stencils are unsuitable for fine/ultra-fine-pitch printing (see Figure 2.16 and Figure 2.17).
To model the withdrawal process of solder paste from apertures, Head et al (1994) adapted and programmed a micro-mechanical testing device to measure the shear stress developed at the interface between the solder paste and the side wall of the stencil aperture as the stencil is separated from the substrate. The test set up is shown in Figure 2.19, which is very similar to a parallel plate rheometer. A paste sample was sandwiched between two horizontal parallel plates which were mounted in a mechanical stressing device; the bottom plate was stationary and the top one was driven at a constant speed of 1 mm/s (similar to the stencil/substrate speed) to shear the sample. The gap between the plates was adjustable between 0.16 and 1.5 mm to investigate the changes in the shear force required to overcome the shear strength of the paste for various aperture dimensions. The test was started from a full overlap of 1 cm of the two plates to the release of the overlap and the shear stress was recorded. Two paste samples were tested. Figure 2.20 shows one of the experimental results in which the shear stress is as function of the gap size between the two plates. As a stencil is separated from a substrate the aperture wall acts as a shearing plate which transfers shear stress to the paste. The shear stress is an important factor that affects the final deposit volume of paste on the pad of the PCB. Experimental result shows that the smaller the gap the higher the shear stress. This can be useful in assessing the applicability of the stencil for fine-pitch printing.
Stationary plate
1600 NEI
1200 s. ra 800
?)
400 0
0.0 0.4 0.8 1.2 1.6 Gap between plates (mm)
Figure 2.20 Shear stress vs gap between plates. (Head)
Head et al's work does provide useful information about the theological properties of solder paste. However, it does not provide ideas on how to apply the experimental result to predict the stencil/substrate separation performance. In addition the experiment is more like a viscosity measurement than a measure of the stencil/substrate separation process. In the separation process the paste does not merely experience simply a shear force at the aperture wall there is also adhesive force exerted on the paste by the substrate which together with the shear force of the aperture side wall will generate tensile stress in the paste. If the adhesive force, which is affected by the surface energy of the pads and by the paste properties, is smaller than the shear force, the paste could not withdraw from the aperture to the pad, but will remain inside the aperture. If the tensile stress exceeds the tensile strength, the paste inside the aperture will deform and part of the paste will be deposited on the pad and part will be left inside the aperture. In both of these cases aperture clogging defects will occur.
of the designing parameters, which would result in minimum solder paste height variation for new board designs with 0.5 mm, 0.625 mm and 1.25 mm pitch pad patterns. First, a Taguchi orthogonal array, L27, was designed to capture the main effects of six most important printing equipment parameters and the PCBs pad conditions. Some interaction between the parameters were also examined. Experimental data were used to construct neural network models to correlate the desired quality characteristics to the input design parameters. A modular approach was used to select the appropriate architecture for these models. These models in conjunction with the gradient descent algorithm were used to determine the optimum settings for minimum solder paste height variation. The optimum settings predicted by the model was validated by experiments on the production line. In addition to the combination of all three pad patterns, Li et al also built neural network models for individual and dual combinations of the three pad patterns. They concluded that there are different optimum settings for different pad pattern combinations.
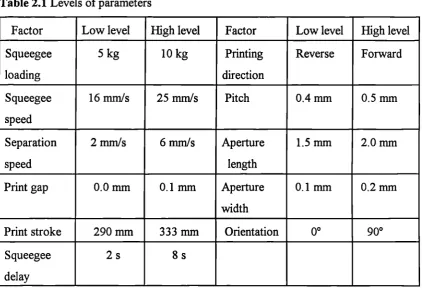
Haslehurst et al (1996) intensively investigated the parameter interactions in stencil printing of solder paste. Eleven parameters, each at two levels, were examined. The parameters and the levels are given in Table 2.1. In order to reduce the number of experiments, a Fractional Factorial Design method was employed which uses only a fraction of the total possible combinations of levels and the highest order of interactions were assumed negligible. By this method all of two parameter interactions and some three parameter interactions could be estimated. The height of paste deposit was measured as the criterion of printing quality.
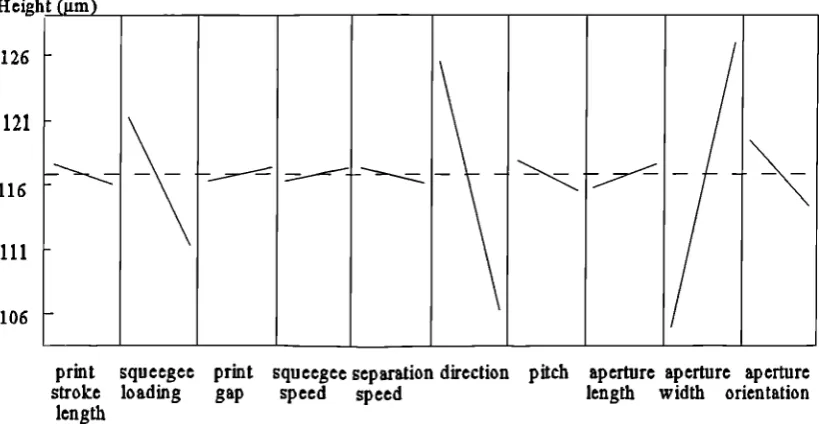
independently for the forward and reverse print strokes. As mentioned earlier, the squeegee speed and separation speed are important parameters that affect the printing process, but Figure 2.21 shows the effects of these two parameter are not very significant. Haslehurst et al suggested this may be because the two levels were too close together for the effects to show up. Of aperture geometry parameters, aperture width produced the most significant main effect. Haslehurst et al suggested that both the filling and the emptying of narrower apertures may be more difficult than that of wider apertures which lead to insufficient paste deposit on the PCB. Aperture orientation was also important: the mean height for apertures with the long axis parallel to the squeegee blade was higher than that for the apertures perpendicular to the squeegee blade. This is also in agreement with Mannan et al's prediction. In the experiments Haslehurst et al also found that the mean deposit height was affected by the aperture pitch where the larger the pitch the higher the deposit. This suggests the paste roll may be affected by the distance between two apertures.
Table 2.1 Levels of parameters
Factor Low level High level Factor Low level High level
Squeegee loading
5 kg 10 kg Printing
direction
Reverse Forward
Squeegee speed
16 mm/s 25 mm/s Pitch 0.4 mm 0.5 mm
Separation speed
2 mm/s 6 mm/s Aperture
length
1.5 mm 2.0 mm
Print gap 0.0 mm 0.1 mm Aperture
width
0.1 mm 0.2 mm
Print stroke 290 mm 333 mm Orientation 00 90°
Squeegee delay
Height (gm)
126
106 121
116
111
print squeegee print squeegee separation direction pitch aperture aperture aperture stroke loading gap speed speed length width orientation
[image:45.595.90.500.113.325.2]length
Figure 2.21 Main effect plot
loading
squeegee _____ ---
---squeegee speed
separation speed
--____„....„
...________.,,-_ __ directiont
,---<---—
, __----
---.. ,
_______ aperture width
---.
,.--,-,..._.,,._
----7-----. orientationaperture
_ ----.
[image:45.595.103.485.421.691.2]Figure 2.22 shows a graphical overview of two-way interactions between the important parameters. Parallel lines in the interaction plot indicate that there is no interaction between the two parameters; crossing and divergent lines indicate an interaction is present. Haslehurst et al found that most of the significant two-way interactions were those involving either aperture width or pressure. Direction, separation speed, squeegee speed, and aperture orientation were also involved in several interactions. From Figure 2.22 it can be seen that the most significant interaction was between squeegee pressure and squeegee direction; changes from low pressure to high pressure made more difference to the reverse print than to the forward print. The second significant interaction was between pressure and separation speed; at low speed, mean deposit height was affected more by an increase in pressure than at high speed. The significant interaction of geometrical parameters was between pitch and aperture width; pitch made no difference to deposit height for narrow apertures, but for wide apertures, 0.4 mm pitch produced deposits 6 pm higher than 0.5 mm pitch. The separation speed also interacted with print gap; change of separation speed had less effect if there was a gap between stencil and substrate than that of contact print. Haslehurst et al also examined some three way-interactions and they found that these interactions were not significant compared with the main effects and some of the two-way interactions. However they indicated that the three-way interactions should be taken into account when fine-tunning the printing process.
Modelling of the Behaviour of Solder Paste in Stencil Printing
Using a Vibrating Squeegee
One of the most important developments in stencil printing technology in recent years is the use of vibrating squeegee (Anon, 1994). The idea for the vibrating squeegee is taken directly from that of a mason oscillating a float to level and pack the mortar. The vibrating squeegee utilises the same principle with solder paste. An important feature of the vibrating squeegee is its ability to assist the rolling motion of solder paste during printing. The vibration of the squeegee also ensures a smooth and level packing of solder paste into the stencil apertures, providing dense packing of solder particles. The other benefit claimed for the vibrating squeegee are longer stencil and blade life as less pressure is applied to the squeegee blade.
In this chapter a theoretical analysis of the behaviour of solder paste during printing with a vibrating squeegee is presented. The effect of the vibration on the paste roll in front of the squeegee is analysed in 3.1. In 3.2 oscillatory shear theory is applied to analyse the packing of solder paste inside the apertures. The main conclusions are summarized in 3.3.
3.1 Paste roll in front a vibrating squeegee
Printing of solder pastes using a constant speed squeegee has been introduced in Chapter
one, and the process is illustrated in Figure 1.3. In this case, the squeegee moves at a
of the paste roll in front of a constant speed squeegee has been reviewed in Chapter two. With a constant speed squeegee, if we ignore the small paste deposits injected into the apertures, then the paste roll in front of the squeegee can be assumed to be a steady state, in which the pressure and velocity at any given point on the paste roll are constants, as shown in Figure 2.8 to Figure 2.10. In contrast, with vibrating squeegee both paste pressure and velocity are not constants. This section presents an analysis of the characteristcs of paste roll in front of a vibrating squeegee.
3.1.1 The displacement, velocity and accelerate of the vibrating squeegee
Figure 3.1 shows the stencil printing of solder paste using a vibrating squeegee. Note that as the squeegee moves forwards with a constant speed I70, it also vibrates sinusoidally. The motion of the vibrating squeegee relative to the stationary stencil is the superimposition of a vibration onto the constant squeegee motion, gives a squeegee displacement:
S = Vo t + A sin(cot) = So + A sin(W) (3.1)
where S is the squeegee displacement, V° is the constant velocity of the squeegee, t is time, A is the amplitude of vibration of the squeegee, and w is the vibration frequency. Then the velocity of the squeegee can be derived from Equation (3.1) as:
V. = Vo + AG) cos(cot) = Vo + V, cos(cat) (3.2)
where the product A w is the amplitude of vibration velocity. The acceleration of the squeegee is given by:
a = - Aca 2 t sin(o)t)
A w2 is amplitude of the vibration acceleration and is also called the acceleration modulus. The vibration frequency, co, and amplitude, A are both important parameters that affect the performance of the vibrating squeegee.
Substrate Aperture Paste roll
Stencil Squeegee
Vt Vo + Aw cos (wt)
Figure 3.1 Stencil printing using a vibrating squeegee.
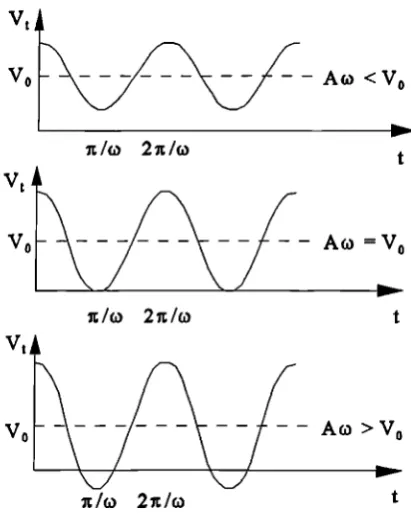
For constant speed squeegee printing, the printing speed, 170, is usually between 20 mm/s and 40 mm/s. For vibrating squeegee printing, examination of Equation (3.2) shows that, for a given constant speed, Vo, taking different values of the vibration velocity, A w, will
lead to three different types of the minimum values of the squeegee velocity, V. To express the minimum value of V, by V • , then V • is dependent on the ratio of Vo / Vs . Figure 3.2
illustrates the three typical squeegee velocities. From which it is seen that, if Vo > Vs, then V • is greater than zero; if V= V., then V • is equal to zero, and if Vo< V., then V • takes
a negative value.
Figure 3.3 shows the displacements of the vibrating squeegee corresponding to the different values of V • . For V • > 0, the squeegee motion is always forward; however, if V • <0,
then during each vibration cycle there is a backward motion; and if V • = 0, there is a
VA
Eh) 2n ha t
1/G) 2nha t
Figure 3.2 Comparison of squeegee velocities for different amplitudes.
[image:50.595.173.379.96.358.2]ic /ca 27t/ t
3.1.2 The linear motion of the solder paste
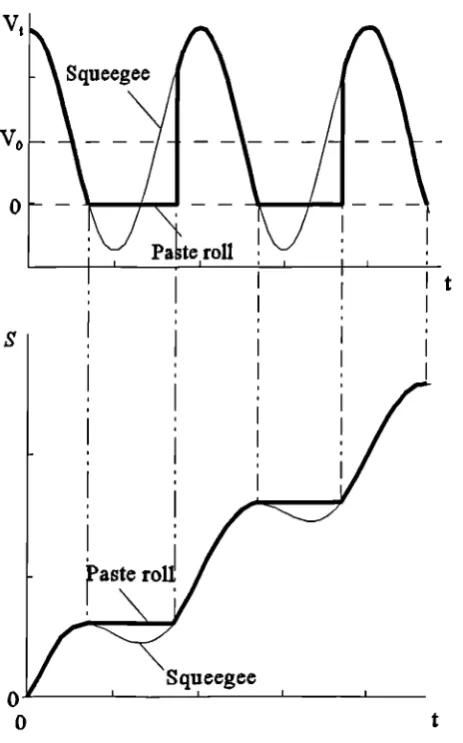
The paste roll in front of the squeegee is produced by the motion of the squeegee blade which pushes the paste during stencil printing. To examine the linear motion of the paste, it is assumed that the paste in front of the squeegee is taken to be a point of mass. Interrupted printing tests were conducted by Owczarek and Howland (1990), where the printing process was stopped suddenly before the end of the stroke, and observations showed that the paste in contact with the leading edge of the squeegee largely retained its shape after the process was stopped. This implies that when the speed of squeegee is reduced to zero, the paste in front of the squeegee stops moving simultaneously with the squeegee. From this observation the paste would be expected to move in front of the vibrating squeegee in different patterns under different squeegee vibrating conditions. First consider the condition V • Vo, in which the squeegee always moves forwards, and the
solder paste is in continuous contact with the leading edge of squeegee blade. This means that the displacement of the paste is the same as the squeegee displacement shown as I and 2 in Figure 3.3. For V • < Vo, when Tit > 0, the squeegee remains in continuous contact
with the paste as it moves forwards; but when IT, < 0, the squeegee oscillates backwards, and if the tack force between the squeegee and the solder paste roll is less than the squeegee pulling force exerted on the solder paste, then the solder paste would be separated from the squeegee. So it can be assumed that when the velocity of the squeegee is positive, the solder paste moves with the same velocity as the squeegee; but when the velocity of squeegee is zero or negative, then the velocity of the solder paste is zero. This means that when V,
is greater than or equal to zero, the paste will always move synchronously with the squeegee, but when V„„„ is less than zero, both the displacement and the velocity of the solder paste are not continuous functions of time. The velocity and displacement profile of the paste is illustrated in Figure 3.4. Notice that when V, < 0, the squeegee displacement
t
Figure 3.4 Displacement and velocity profiles of squeegee and paste roll.
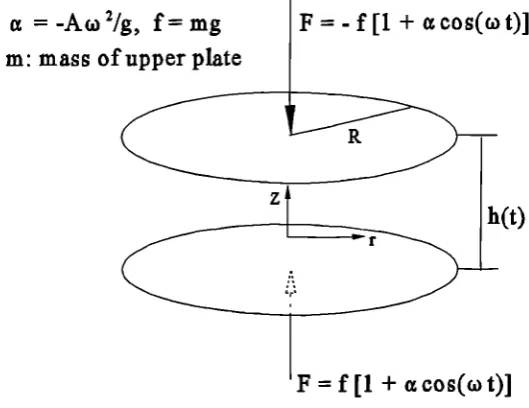
In the above analysis, it is assumed that as the squeegee moves backwards, the acceleration force of the squeegee exerted on the paste is greater than the tack force between the squeegee and the paste roll, and hence the paste roll is separated from the squeegee. Therefore, it is necessary to examine the squeegee acceleration. The vibration frequency of the squeegee can be up to 200 Hz, equivalent to 4007c rad/s (Anon, 1994). If the vibration frequency, for a typical application, is 150 Hz and the amplitude is 0.2 mm, then the squeegee acceleration modulus will be A 2 = 0.2 x 10 3 x 300 2 7c2 z 176 mg , which is
be separated from the squeegee as the squeegee oscillates backwards. Examining the vibration velocity amplitude, V, = A co, it can be seen that, to keep V, to be a constant, if A is multiplied by a factor and co is divided by the same factor (or vice verse) the value of Vs does not change. However this will affect the value of the acceleration modulus, A co'. This means that to enhance the paste roll separation from the squeegee, a relatively high frequency (a)) and a relatively low amplitude (A) are required as this can lead to a high acceleration modulus. It will be also seen, from the analysis of paste packing inside apertures (see 3.2), that relatively high frequency and relatively low amplitude are required. The acceleration of the squeegee at the moment when the squeegee starts oscillating backwards can be derived from the velocity and accelerate equations as follow. At the moment when the squeegee starts to oscillate backwards, the squeegee velocity equals zero, that is:
V = 0 cos(cot) = - - - a
AG) Vo
(3.4)
where a is the ratio of the constant squeegee velocity to the amplitude of the vibration velocity, and a < 1. The acceleration of the squeegee is:
a = -Aw'sin(o)t) =-Aw 2 1-cos2(6)t) = -caVA/ (3.5)
For fixed values of a and V 0, Equation (3.5) indicates that the increase of the frequency, co, will lead to an increase in the backward acceleration of the squeegee at the moment when the squeegee oscillates backwards. Equation (3.5) also indicates that, if a < 1/3, the acceleration of the squeegee, at the moment when the squeegee oscillates backwards, is nearly equal to the acceleration modulus.
3.1.3 The paste roll in front of the squeegee and the filling of paste into the apertures
A. The forces acting on the paste roll
Liquid rich layer
P2
12
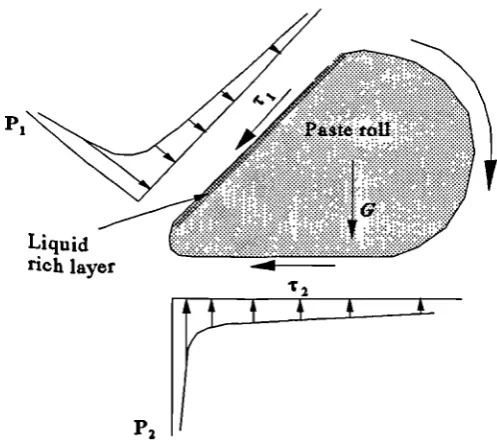
[image:54.595.140.389.433.656.2]exerted on it by the moving squeegee. This section presents the analysis of the rolling motion of the paste in front of the squeegee and an examination of the effect of the external forces on the paste roll. Comparison shows that the paste roll diameter is much smaller than the paste roll length, which means that the forces acting on the paste roll can be taken as two dimensional case. Figure 3.5 shows a cross-sectional view of the paste roll and the forces acting on the paste roll and the paste rolling direction. Three types of forces acting on the paste roll can be identified. Firstly, there are the shear stresses (also called frictional forces), .r, and T 2 . T i acts on the squeegee and paste roll interface and is against the paste rolling direction, while T2 acts on the substrate and paste roll interface and is in the paste rolling direction. Then there are the pressure forces, P1 and P2 . P1 is perpendicular to the squeegee and paste roll interface, while P2 is perpendicular to the substrate and the paste roll interface. And finally there is the gravity force G.
For a constant speed squeegee printing process, the forces acting on the paste roll are in a steady state, in which the shear stresses, T1 and T2 , and the pressures, P1 and
1,
are all position variables only. But in a vibrating squeegee printing process, all these forces are not only functions of position but also functions of time, that is both the shear stresses and the pressures at a given point vary with the squeegee velocity.B. The paste roll in front of the squeegee
On close observation of the forces shown in Figure 3.5, it can be seen that T 2 generates a positive torque on the paste roll which supports the paste rolling action, while t i generates a negative torque on the paste roll which opposes the paste rolling action. This means that for the stencil printing process, any changes to the printing process parameters which helps to increase T 2 or to decrease T1, will also help to enhance the paste roll. A good paste roll is known to be essential for good aperture filling and for good paste deposition. The vibration of the squeegee does have the effect of reducing the resistance T i by generating a liquid rich layer at the interface between the paste roll and the squeegee blade. By theoretical analysis using lubrication theory, Cox (1967, 1974) showed that, if a spherical particle moves near a flat plate with a relative speed, VII, parallel to the plate, then the plate resistant force acting on the particle is given by:
F = - —167C 11 rVii ln(3L) as r »8 5 0
8
where ti is the viscosity of the liquid, r is the radius of the particle and 8 is the gap size between the plate and the surface of the particle. Equation (3.6) indicates that, for stencil printing of solder paste, if the gap, 8, between a solder particle and the leading edge of the squeegee increases, the resistant force of the squeegee on the particle decreases. The shear stress, T 1 on the paste roll is the integration of F on a unit area, and the total resistance is the integration of T 1 on the contact area between the squeegee and the solder paste. This means that the generation of a liquid rich layer at the squeegee and paste roll interface by the application of vibrating squeegee can help to enhance the rolling action of the solder paste in front of the squeegee.
Chapter three
As was stated earlier in Chapter two, solder paste is a dense suspension of spherical solder alloy particles in a flux/vehicle system. The volume fraction of solder particles is typically about 50%, and the mass density of the solder particle is about eight times higher than that of flux/vehicle (Hwang, 1989). Further analysis presented in Chapter five shows that the random loose packing density of equal spheres is about 60%, and for poly dispersed spheres the packing density increases with the standard deviation of particle size. Therefore, for solder paste with a solid volume fraction about 50% the solder particles within the solder paste are separated from each other and there are voids in the paste to be filled by the flux/vehicle system within the solder alloy particle matrix. The average gap between adjacent particles is about 15% to 22% of the average radius of the particles.
As was demonstrated in 3.1.2, if V° / < 1, then the motion of the paste roll is not a continuous function of time. As the squeegee oscillates forwards and backwards, the leading edge of the squeegee impacts the paste roll. The frequency of this impaction is the vibration frequency of the squeegee. During the impactions, kinetic energy is transferred to the solder alloy particles located at the squeegee and the paste roll interface. As shown in Figure 3.6, with each impact, these particles are forced to move further into the bulk of the paste which leads to the formation of a liquid rich layer at the squeegee and paste roll interface as shown in Figure 3.5. The resistance force exerted on each particle by the squeegee is given by Equation (3.6). Then the total resistance force exerted on the paste roll by the squeegee can be written as:
R = --16 Tyr' E r, PTln()2r
5 i=1
where m is the total number of particles at the interface.
Comparing the vibrating squeegee with a constant speed squeegee, we note that the main difference is the effect of these impacts on the paste roll, and that under vibration the solder alloy particles at squeegee and paste roll interface are moved into the bulk of the paste. This leads to an increase in the gap, 8„ between particle and squeegee leading edge. For the