International Journal of Emerging Technology and Advanced Engineering
Website: www.ijetae.com (ISSN 2250-2459, Volume 2, Issue 7, July 2012)12
Adoption of Six Sigma Concept in Process Improvements
Methodology: A Case Study
Low Shye Nee
1, Shahrul Kamaruddin
2, Ong Loong
3, Chip Wai Tien
4, Amira Nadwa Hamdan
51,2,3,4,5 School of Mechanical Engineering, Engineering Campus Universiti Sains Malaysia, 14300, Nibong Tebal, Pulau Pinang,
Malaysia
Abstract—This paper is presenting a developed process improvement methodology that based on the Six Sigma concept. The process improvement methodology applied in the backend assembly process department of a case study company. By adopting process improvement model into the case study, line improvements can be achieved in terms of overall cycle time reduction of 8.34% and manpower reduction at a 37.5%. The process improvement model based on Six Sigma techniques ensures a sustainable continuous improvement cycle can keep on looping in future in more systematic and proper framework.
Keywords— process improvement methodology, Six Sigma concept, continuous improvement
I. INTRODUCTION
Process improvements especially in manufacturing areas are critical for manufacturing companies in order to increase their competitiveness. One of the well known process improvement approaches generally adopted for solving production problems is Six Sigma. The Six Sigma concept is an organized and systematic approach that focuses on improving quality such as reducing the wastes by helping the company produce product and service faster, better and cheaper. Results achieved are reflected in manufacturing cost savings and quality of product and process improvements on their shop floor [1].
Six Sigma methodologies are based on DMAIC (Define-Measure-Analyze-Improve-Control) cycle. DMIAC is adopted in manufacturing company to identify, quantify and eliminate sources of waste in an operational process, up to optimization usage of the available resources, improve the sustain performance of the production line improvement with well executed control plans in future [2]. Kumar and Sosnoski had adopted the DMAIC method the machining and fabrication industries to improve the production quality through driving down manufacturing costs [3].Currently, there is much emphasis on the quality of processes. However, application of this concept lack of focusing on solving the manpower reduction and time reduction problems in the process improvement context.
On the other hand, improving the process by eliminating root causes and controlling the process for ensuring mistakes or defects do not reappear should ideally provide long-term benefits to the company [4]. Therefore, the improvements made without following an appropriate methodology in carrying out the improvement processes, leads to the failure of the project. This is because the solutions that have been selected and implemented could solve the problem in short term since the analysis and evaluation of the situation were not comprehensive. In other words, the root causes of the problem not have been solved completely. By adopting Six sigma methods, companies are able to understand fluctuations in a process, which will allow them to pinpoint the causes of the problem.
Hence there is a need for manufacturing company to have a systematic methodology in carrying out the improvement processes through the Six sigma concept. A suitable process improvement methodology based on Six Sigma is needed to ensure proper and systematic process flow to reach the improvement objectives. Therefore the objective of this paper is to develop a process improvement model. In this paper, the process improvement model will be discussed in Section 2.0. Then, it will be applied and implemented in practical case study in the following section. The discussion of the implementation is concluded in the last section.
II. METHODOLOGY
International Journal of Emerging Technology and Advanced Engineering
Website: www.ijetae.com (ISSN 2250-2459, Volume 2, Issue 7, July 2012)13
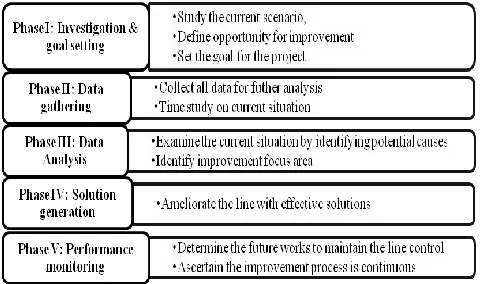
[image:2.612.48.288.190.332.2]Then, the effective solutions generated in Phase IV and then will be ameliorated into the production line. Once the solution had been implemented, the performances need to be monitored that is achieved in Phases V.
Figure 1: Process improvement methodology based on Six Sigma concept
Team formation with a good planning using Gantt chart will ease the process of setting the goal for the project to run through the 5 phases. By adopting the process improvement model, the overall production flow can be analyzed phase by phase for defining the vital problems on the production line; measure the essential data collection via time study; analyze the root causes of the critical problems from the measured data; improve the production line with effective solutions to undertake the problems resolved; as well as controlling the performance of the production line by future planning. In the next section, this methodology will be adopted in a manual assembly production line to show the applicability and solving the production line problems.
III. CASE STUDY
A Malaysia company A that mainly produces electronic sub-assemblies and plastic molded components is used for the case study. Their main customers of Company A are producing electronic devices for global market. Within the final assembly department, one of the assembly production lines is selected for the focus of the continuous improvement project, which is running product X.
The line can be categorized as semi-automated line as the involvement of jigs and fixtures in certain stations as well as using conveyer for material transportation. Therefore in order to show the applicability of the process improvement methodology, it is adopted phases by phases as shown in Figure 1. Detail discussion of each phase is given as follow.
A. Phase I: Investigation and goal setting
Phase I investigate the current scenario for Product X assembly process and setting the goal in this project. The current condition for the product X as observed via gemba walk is rather typical in terms of vision. Firstly, the line is overcrowded with 16 operators, which is the highest number of operators in final assembly department. Besides, the inkjet printing process is located out of the assembly line (≈8m), which resulting into the need of external material handing from the inkjet machine back and forth. For the inspection part, the inspections are concentrated in 2nd half of the line, while 1st half of the line has no inspection is carried out. The most crucial problem is the tasks assigned in certain stations is too simple for the operator, yet an operator is placed there just to complete the task instead of combining those simple tasks assigned to a single operator. Hence, the goals to be achieved after having a discussion with the team that consist of manager and engineers on the company, as a priority are manpower reduction and cycle time reduction throughout the production line. Once the goal have been identified, the project progress to Phase II.
B. Phase II: Data gathering
International Journal of Emerging Technology and Advanced Engineering
Website: www.ijetae.com (ISSN 2250-2459, Volume 2, Issue 7, July 2012) [image:3.612.59.291.160.354.2]14
TABLE 1
CURRENT PROCESS WITH CYCLE TIME OF PRODUCT X
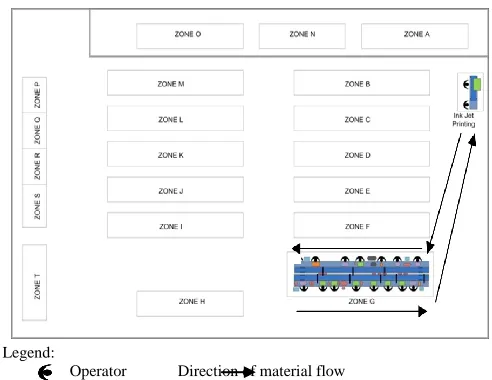
Besides that, the current Product X line consists of 14 workstations in Zone G as illustrated in Figure 3. Each workstation is operated by either one or two operator as stated in Table 1. The layout of assembly line is a U shape that equipped by continuous conveyor for transferring the parts except for the inkjet printing workstation. The time of the continuous conveyor had been taken, for 1st half conveyor to move per part is 16.7s; while for 2nd half conveyor to move per box is 7.7s. The collected data will be used for further analysis under Phase III.
Legend:
[image:3.612.47.293.486.676.2]Operator Direction of material flow
Figure 3: Current Overall Layout for Product X Flow
C. Phase III:Data Analysis
In Phase III, the data and the root causes in Product X assembly line is analysed. The takt time had been calculated for the product X to determine how often a line should produce one part or product, based on the rate of sales, for fulfilling the customer requirements. Therefore, it used as guideline in the line balancing to re-design the future process. If the cycle time of a workstation is higher than the calculated takt time, that particular workstation is the bottleneck. This may be causing overproduction waste or work in process (WIP) in some areas that required extra processing time, such as overtime, to meet demand. The calculation of takt time based on the equation (1) is shown in Table 2.
(1)
TABLE 2
TAKT TIME CALCULATIONS
Shift Length(A) 11hours = 11 x 60 x 60 = 39600s
Breaks(B) (1 small breaks x 10mins) + (60 mins lunch time) =1 hour 10mins =70mins = 4200s Planned
Production(C) (A - B) = 39600 – 4200 = 35400s
Customer
Demand(D) 2100 pieces/day
Takt Time (C/D) 35400/2100 = 16.85s/pieces
The work element of the bottleneck station had been analyzed as represented in Table 3. As it is clear to state that, the waiting time of part arrival and traveling for long distance are causing the operators taking the longest time to complete the assigned task. Therefore, the location of the bottleneck workstation needed to be improved in order to reduce the handling and travelling time.
TABLE 3
WORK ELEMENT OF BOTTLENECK WORKSTATION (INK JET PRINTING PROCESS)
Operator Work element Average cycle time (s) Left hand Right hand
1 Take the jig 0.7
Take the front part from box
1.1
Put it on the jig and waiting
the conveyer move the jig for printing
1.4
2 Remove the part from
the jig
and put into the tray
1.3
2 Waiting the tray is fully filled and take and transfer it to next process
15.0
No. Process step
Current Cycle Time(s)
Number of operator
1 Ptt Button / Ptt Bracket Assembly 15.3 1
2 Speaker Net Assembly 12.6 1
3 Glue Speaker Assembly(RHS) 14.0 1
4 Glue Speaker Assembly(LHS) 11.6 1
5 Black Adhesive Assembly 7.5 1
6 Label Assembly 6.3 1
7 Charger Contact Assembly 8.0 1
8 Charger Contact Pressing 10.1 1
9 Ink Jet Printing (Not in line) 19.6 2
10 LCD Pad / Poron 12.9 2
11 Inspection 9.3 1
12 Pressing Charger Contact 4.8 1
13 Battery Conducting 6.3 1
14 Final Inspection/ Packaging 12.3 1
International Journal of Emerging Technology and Advanced Engineering
Website: www.ijetae.com (ISSN 2250-2459, Volume 2, Issue 7, July 2012)15
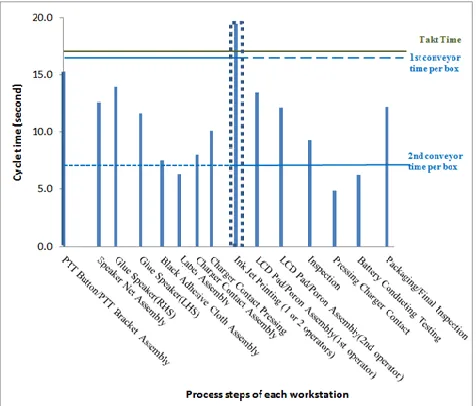
[image:4.612.50.288.268.471.2]Figure 4 shows the overall process time current process in each station for assembly line of Product X. The cycle time that above takt time is bottleneck and critical; and the cycle time that much below takt time will be idling. The comparison that have been carried out between the cycle time with the takt time for first conveyor time per box and second conveyer time per box. From there, the bottleneck is significant revealed at the inkjet printing process due to its cycle time is higher than the takt time. Therefore this workstation that highlighted in dotted line in the Figure 4, needed to be improved.
Figure 4: Overall Process Time for Each Workstation (Current Process)
Other from the bottleneck workstation, the project aims to reduce the manpower in the assembly line. With the brainstorming of all the team members, as well as having internal discussion with the operators and the engineers, a Fishbone Diagram is drawn to show the root causes in Product X assembly line as shown in Figure 5. The root causes are based on 4M (Method, material, manpower, and machine) which are the concerns of Company A. The main causes of the excessive manpower are improper process sequence and unnecessary material handling, inconsistence workplace arrangement, unbalance workstation and defective items. In order to solve those critical causes, a list of solution had been generated through brainstorming with the personal in company. With all the data been analyzed, the identification of the solution for the improvement is carried out in Phase IV.
D. Phase IV: Solution generation
[image:4.612.101.523.505.696.2]This phase is to ameliorate the line with effective solutions after analyzing the current situation. Some solutions are suggested in order to overcome the root causes as presented in Figure 5. The considerations that would be taken into account towards the solutions proposed include the budget, feasibility and the expected outcome of each solution. The improvements listed are not mutually exclusive to each other. The improvements proposed related the whole line performance, in other words, it might affect certain subsequent workstations as well as other improvements as well.
International Journal of Emerging Technology and Advanced Engineering
Website: www.ijetae.com (ISSN 2250-2459, Volume 2, Issue 7, July 2012)16
The improvements to be proposed after detail analysis are done in Phase III:
1)Insertion of Ink Jet Printing to the line and a new jig design is suggested.
2)Combination of Glue speaker stations (LHS and RHS) and a new jig design is recommended.
3)Combination of Black Adhesive Cloth Assembly and
Label Assembly.
4)Combination of Contact Charger Assembly and Charger
Contact Pressing.
5)Combination of Pressing Charger Contact and Battery Conducting Testing.
6)Location of inspections (Workstation 11) is rearranged and placed separately in 1st half of the conveyors.
[image:5.612.323.577.176.392.2]By implementing all the improvements listed above into the line, the expected output of these improvements is a balance line will be achieved as shown in figure 6. Figure 6 shows the overall process time future process in each station in assembly line of Product X and compare the cycle time with the takt time, first conveyor time per box and second conveyer time per box. The operators will be more utilized with less idle time; the productivity of the line will be increased since the number of operator is reduced; the line will have no bottleneck since all the cycle time is under takt time, making the line to be smoothed and ―starving‖ effect at most of the stations will be removed.
Figure 6: Estimated Process Time for Each Station
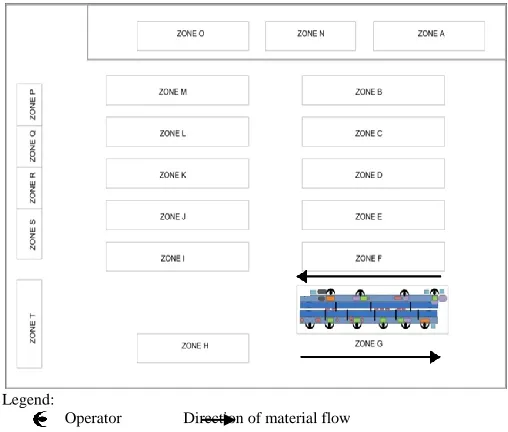
Based on the improvements, Figure 7 shows the overall assembly layout for Product X which is constructed out. For Bottleneck workstation, the Inkjet printing process proposed to be placed in the assembly line as shown in the Figure 7.
The material flow smooth by using the continuous conveyor without need to transport out from the assembly line for further assemble.
Legend:
[image:5.612.49.293.443.638.2]Operator Direction of material flow
Figure 7: Overall Future Assembly Layout for Product X
E. Phase V: Performance monitoring
In this phase, to ascertain the improvement process is continuous, determining the future works need to be done. The improvements will be implemented one by one in the assembly line. Time study and motion study will be collected again in order to compare with the present process. Observation and justification are necessary for the each improvement during the implementation. Besides, periodic reviews of various solutions and continuous process improvement are carried out until the process yield determined is achieved. Optional or contingency plan is needed as the problem solving during the implementation period. The operation manager and engineer executed strategic control by an ongoing process of investigating the goals and progress of the objectives. The management met periodically and reviewed the progress of improvement measures and their impacts on the comprehensive business plans.
IV. DISCUSSION
International Journal of Emerging Technology and Advanced Engineering
Website: www.ijetae.com (ISSN 2250-2459, Volume 2, Issue 7, July 2012)17
The result after the improvement had been analyzed and gathered. The comparison of reduction of total cycle time and total manpower of the line between before and after improvement had been done. Table 4 tabulated the difference between before and after the process in term of total cycle time and total manpower. The reduction of cycle time is 12.55s, 8.34% of the total; on the other hand, reduction of manpower is 6 people, which is 37.5% out of 16 people in before improvement process. Generally when the manpower is reduced, the total cycle time should be increased due to same tasks dividing to remaining people. However, reduction of cycle time can be done
simultaneously when improvements proposed are
[image:6.612.53.278.330.498.2]implemented. Furthermore, the reduction of the total manpower in turn reducing the labor cost significantly, that is approximately 37.5%.
TABLE 4
COMPARISON OF THE RESULTS BETWEEN BEFORE AND AFTER IMPROVEMENT PROCESS
Total Cycle Time (s)
Total Manpower
Labor Cost per
year* (RM) Before
Improvement Process
150.50 16 153,600
After Improvement Process
137.95 10 96,000
Percentage
In Reduction 8.34 37.5 37.5
*Assume RM800 per month per operator
From the implementation results, the project goal was contentedly achieve which the performance in term of reduction operator and total cycle time. The achievement is not only to prove the robustness of the process improvement methodology, but also weigh up the acceptability and also the acceptability and practicality of the developed methodology for industrial application.
V. CONCLUSION
The process improvement methodology that has been developed based on Six Sigma concept had improves the flow of completing the project by separating the tasks into phases. The saving percentage of improvement total cycle time and manpower were 8.34% and 37.5% respectively. This model is leading the project to better utilization of resources, decreases the unnecessary wastes and maintains consistent quality of the process output via systematic and well-organized phases.
When applying Six Sigma approach in a project, a company eventually can achieve its ultimate goal to improve its profitability.
Acknowledgement
This work is supported in part by the University Sains Malaysia, the top management of Company A and Knowledge Transfer Grant (KTP) from the Ministry of Higher Education (MOHE), Malaysia.
REFERENCES
[1 ] Ward, Sophronia & Poling, Sheila R., Six Sigma: Maximize the benefits, Pinnacle Partners Inc, Oak Ridge, TN, 2005 ,44, pp.44-47 [2 ] Tushar N.Desai & Shrivastava, R.L., 2008, Six Sigma – A New
Direction to Quality and Productivity Management, World Congress on Engineering and Computer Science WCECS
[3 ] Kumar, S. and M. Sosnoski, Using DMAIC Six Sigma to systematically improve shopfloor production quality and costs. International Journal of Productivity and Performance Management, 2009, 58 (3), pp. 254-273.