International Journal of Emerging Technology and Advanced Engineering
Website: www.ijetae.com (ISSN 2250-2459, Volume 2, Issue 3, March 2012)468
Identification of Power Electronics Controlled Loads in
Distribution Power System Using 10 Complex MUSIC Technique
Jai Shree Gupta
1, K. P. Singh
2, Dr. A. N. Tiwari
3 1M.Tech. Student, Department of Electrical Engineering2,3
Professor, Department of Electrical Engineering
1,2,3
M.M.M Engineering College Gorakhpur (U.P.)-India.
1[email protected] 2[email protected]
Abstract— In this paper, we propose a model of distributed power system with power electronic controlled loads. Distribution networks transport the electrical energy from the transmission substations to the various loads. There are so many power electronics controlled loads that are connected in the distribution power system. Due to intensive use of power electronics controlled loads in an industry and other consumers in general, the harmonics produces a distortion in distribution network. Therefore, to protect the power system from the power electronics controlled loads, it is very important to identify the types and number of all the working power electronics controlled loads. The result of this paper shows that the method of calculating the number and also the types of all working power electronics controlled loads in any distribution system. A Multiple Signal Classification (MUSIC) Spectrum technique is used to identify the power electronics controlled loads in distribution power system. Here a case study for all types of power electronics controlled loads has been made which are taken in the power system using MUSIC algorithm.
Keywords—Digital signal processing, MUSIC algorithm, nonlinear loads, power electronics controlled loads, power quality problems
I. INTRODUCTION
In large power stations, ideal assumption is that, an electricity supply should have invariably a perfectly sinusoidal voltage signal at every customer location. But because of the number of reasons, utilities generally it becomes difficult to preserve such desirable conditions. The intensive use of non-linear loads in industry and by consumers in general, is keeping harmonic distortion in distribution network on the rise. The most used nonlinear device is perhaps the AC regulators, adjustable speed drives, electrical transportation system, PWM inverters and electrodomestic appliances. Therefore, to save or protect the distribution system from the additional power losses, it is necessary to identify that in any distributed power system which types of nonlinear loads are used and how many loads work at a time. The existing nonlinear loads identification techniques in electric power system are unsuitable, inefficient and very complex.
Therefore, to find out easy solution for Multiple Signal Classification Spectrum (MUSIC) technique to identify the nonlinear loads in distribution power system has been worked out. This identification technique is much reliable, efficient and more easy to understand [1].
II. SYSTEM DESIGN
With an increasing amount of measurement data, automating power quality characterization and classification of disturbances is desirable. This will require combined effort and knowledge from both electrical power systems and signal processing. A digital signal processor is a specialized microprocessor designed specifically for digital signal processing, generally used in real-time computing. DSP algorithms require a large number of mathematical operations to be performed quickly on a set of data. The digital signal processor can be programmed to perform a variety of signal processing operations, such as filtering, spectrum estimation, and other DSP algorithms [3]. There are so many techniques to perform the DSP operation. Here the MUSIC technique to identify the loads has been considered. The MUSIC method employs a harmonic model and estimates the frequencies and powers of the harmonics in the signal. The MUSIC algorithm is a noise subspace based method. MUSIC detects signal frequencies by performing an eigen decomposition on the data vector covariance matrix from received signal samples.
III.SIMULATION RESULTS
International Journal of Emerging Technology and Advanced Engineering
Website: www.ijetae.com (ISSN 2250-2459, Volume 2, Issue 3, March 2012)469
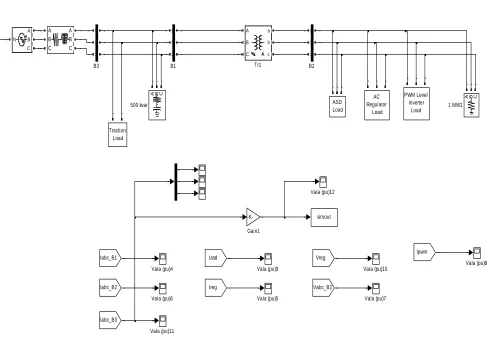
Now it generates the current waveforms of the loads which is distorted or nonsinusoidal in nature. Then the use of the current waveform on MUSIC technique algorithm the number of peaks & power values of loads are generated.The MUSIC algorithm is a kind of directional of arrival (DOA) estimation technique based on eigen value decomposition, which is also called the subspace-based method.
Discrete, Ts = 2e-005 s.
VaIa (pu)9
VaIa (pu)8
VaIa (pu)7
VaIa (pu)6 VaIa (pu)5
VaIa (pu)4
VaIa (pu)12
VaIa (pu)11
VaIa (pu)10 A
B
C a
b
c
Tr1
simout
AC Regulator
Load
PWM Level Inverter
Load ASD
Load
Traction Load N
A
B
C
-K-Gain1
Iabc_B3
Vreg Iasd
Ipwm
Ireg Vabc_B2
Iabc_B1
Iabc_B2 A
B
C a
b
c
B3
A
B
C a
b
c
B2 A
B
C a
b
c
B1
A B C
500 kvar A
B C A
B C
[image:2.612.64.553.202.546.2]A B C 1 MW1
Fig 1. Simulation model of distribution power system with power electronic controlled loads
A. Case studies for one load at a time
Here the detail analysis has been done when amongst the all four loads, only one load works at a time in distribution power system then the current waveform of the load when it is included or not included in the power system.
AC regulator controlled load:
The current waveform of AC regulator when it is not
included in the distribution power system. Fig.2. Current waveform of ac regulator when it is not included in the
power system
[image:2.612.340.557.575.689.2]International Journal of Emerging Technology and Advanced Engineering
Website: www.ijetae.com (ISSN 2250-2459, Volume 2, Issue 3, March 2012)470
Fig.3. Current waveform of AC regulator when it is included in the power system
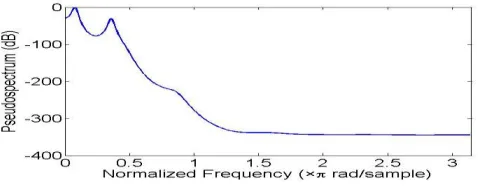
Above figure shows that the current waveform is distorted in nature. But with the help of this above waveform, it cannot be determined which type of loads are in working condition in power system. So to obtain our basic requirement MUSIC algorithm on the above current waveform is used. To apply MUSIC algorithm, it is needed to choose the input signal or the number of complex sinusoids. So it is chosen to apply 10 complex sinusoids and noted down the number of peaks and power values of the working load. Fig. 4 shows the 10 complex MUSIC analysis of AC Regulator.
Fig.4. 10 complex MUSIC analysis of AC regulator
Adjustable speed drives (ASD):
Fig.5. Current waveform of ASD load when it is not included in power system
Fig.6. Current waveform of ASD load when it is included in the power system
MUSIC analysis:
Fig.7. 10 complex MUSIC analysis of ASD load
PWM inverter:
The case studies of one load at a time with MUSIC analysis for PWM inverter will be same as used for A.C regulator and ASD.
Traction load:
Again the case studies of one load at a time with MUSIC analysis for traction load will be same as used for A.C regulator and ASD.
B. Case studies for two loads at a time
Now, amongst the all four loads, two loads work at a time then it obtained current waveform of the loads and then applies the MUSIC technique on the current waveforms
AC regulator & ASD:
International Journal of Emerging Technology and Advanced Engineering
Website: www.ijetae.com (ISSN 2250-2459, Volume 2, Issue 3, March 2012)471
MUSIC analysis: [image:4.612.325.561.138.255.2]To obtain our basis requirement it uses MUSIC algorithm on the above current waveform. Fig.9. shows the 10 complex MUSIC analysis of AC Regulator & PWM.
Fig.9. 10 complex MUSIC analysis no AC regulator & ASD
Now, the case studies of two loads at a time with MUSIC analysis for AC regulator & PWM, Ac regulator & traction, ASD & PWM, ASD & traction and PWM & traction will be same as the analysis used for A.C regulator & ASD in fig.8.
C. Case studies for three loads at a time
Now when in all the four loads, three loads work at a time in distribution power system the current waveform of the loads is obtained and apply the MUSIC technique on the current waveforms.
[image:4.612.51.290.210.303.2]AC regulator, ASD & PWM:
Fig.10. Current waveform of AC regulator, ASD & PWM when it is included in power system
MUSIC analysis:
Again to obtain our basis requirement it uses MUSIC algorithm on the above current waveform. Fig.11. shows the 10 complex MUSIC analysis of AC Regulator, ASD & PWM.
Fig.11. 10 complex MUSIC analysis of AC regulator, ASD & PWM
The case studies of three loads at a time with MUSIC analysis for Ac regulator, ASD & traction and AC regulator, PWM & traction and ASD, PWM & traction will be same as the analysis used for A.C regulator, ASD & PWM in fig.11.
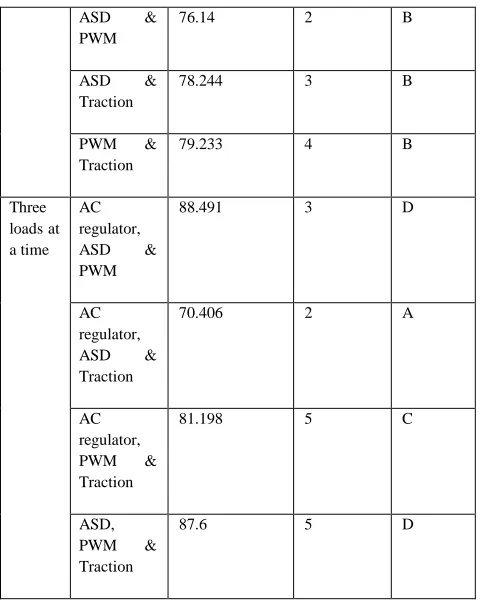
Now, the first thing is to make a table on the basis of the power and peak values which is obtained from the 10 complex MUSIC analysis graph of the all the loads.
[image:4.612.321.564.430.721.2]TABLE 1
TABLE OF 10 COMPLEX MUSIC ANALYSIS
Power electronic loads
Performance Index (po)
number of peaks
Group
One load at a time
Ac regulator
106.27 5 H
ASD 128.73 3 I
PWM inverter
90.823 2 E
Traction 79.609 3 B
Two loads at a time
Ac regulator & ASD
85.954 2 D
AC regulator & PWM
89.823 4 D
AC regulator & Traction
[image:4.612.56.287.474.613.2]International Journal of Emerging Technology and Advanced Engineering
Website: www.ijetae.com (ISSN 2250-2459, Volume 2, Issue 3, March 2012)472
ASD &
PWM
76.14 2 B
ASD &
Traction
78.244 3 B
PWM &
Traction
79.233 4 B
Three loads at a time
AC regulator,
ASD &
PWM
88.491 3 D
AC regulator,
ASD &
Traction
70.406 2 A
AC regulator,
PWM &
Traction
81.198 5 C
ASD,
PWM &
Traction
87.6 5 D
[image:5.612.48.288.132.432.2]After the 10 complex MUSIC analysis, the number of peaks and power values of the generated 10 complex MUSIC analysis waveform is note down. Now another table is made to differentiate the power values into the groups to make the observation easiest for everyone. For example- the values of power of which loads lies between 70-75 goes under the group A, the values of power which lies between 75-80 goes under the group B and so on.
TABLE 2
TYPES AND THEIR CAUSES OF POWER QUALITY PROBLEMS
Group division under the range of performance index
70-75 A
75-80 B
80-85 C
85-90 D
90-95 E
95-100 F
100-105 G
105-110 H
110-135 I
The table 2 shows the 10 complex MUSIC analysis of all the power electronics controlled loads in distribution power system.
Again on the basis of 10 complex MUSIC analysis waveform and power values of all the loads, the number of peaks and the power of all the loads are taken one by one and then divide the groups on the basis of the power values. For example- if number of peaks is 2 and group is D then AC regulator and ASD loads are working in power system.
IV.CONCLUSION
This paper has explained that when power electronic loads are present in the power system then power quality problems occur in the distribution power system. Here the analysis of all four loads in a step like one load at a time is taken, then two loads at a time and then three loads at a time with the help of MUSIC algorithm.
Firstly it is observed the current waveform of all the power electronic loads in the power system. Then applying the MUSIC algorithm on the current waveform and put the number of complex sinusoids is 10. Again with the help of generated 10 complex waveform, note down the number of peaks and power values of all the loads. On the basis of 10 complex analysis of power electronic loads, made a group of the power values. Then with the help of groups and number of peaks it is easy to identify the type and number of all the working power electronic loads in the distribution power system.
References
[1] Raul Alcaraz, Emilio J. Bueno, Santiago Cobreces, Francisco J.
Rodriguez, Felipe Espinosa and S. Muyulema, ―Power System Voltage Harmonic Identification Using Kalman Filter‖, vol.1, pp 4244-0121, 6 Jun 2006 IEEE.
[2] Resende, J.W., Chaves, M.L.R., Penna and C, ―Identification of
power quality disturbances using the MATLAB wavelet transform toolbox‖, Universidade Federal de Uberlandia (MG)-Brazil.
[3] Ekrem Gursoy, Member, IEEE, and Dagmar Niebur, Member,
IEEE, ―Harmonic Load Identification Using Complex Independent Component Analysis‖, IEEE Transactions On Power Delivery, Vol. 24, No. 1, January 2009.
[4] Koji Morimoto, Kazuki Konishi, Toru Miki, Naoto Nagaoka and
Akihiro Ametani, ―Harmonic Source Identification by Simultaneous-Multipoint Harmonic Measurements‖, PEC 2007 – 323.
[5] R. Alcaraz, E. J. Bueno, S. Cobreces, F. J. Rodriguez, C. Giron and
M. Liserre, ―Comparison of Voltage Harmonic Identification Method for Single-Phase System‖, vol.1, pp. 4244-0136, 4 Jun 2006 IEEE.
[6] Math H. J. Bollen and Irene Y. H. Gu, ―Signal Processing of Power
[image:5.612.52.299.568.687.2]International Journal of Emerging Technology and Advanced Engineering
Website: www.ijetae.com (ISSN 2250-2459, Volume 2, Issue 3, March 2012)473
[7] Jawed Qumar and Baquer Mazhari, ―Spectral Estimation Using a
MUSIC Algorithm‖, Nios II Embedded Processor Design Contest—Outstanding Designs 2005.
[8] JPV du Toit and JHC Pretorius Member, IEEE, ―The use of Power
Definitions and Correlation in the Identification of Nonlinear Loads for the purposes of Revenue‖, pp. 7803-8746, 2004 IEEE.
[9] Juan Jose Gonzalez de la Rosa and Antonio Moreno-Munoz, ―A
web-based distributed measurement system for electrical Power Quality monitoring‖, pp. 4244-2787, 2009 IEEE.
[10] Liu Hang, Li Qunzhan and Gao Fenghua, ―Traction Power System
Model and Simulation for Estimation and Forecast of Traction Load‖, pp. 4244-4813, 2010 IEEE.
[11] Dr. Paulo Ribeiro Dr. Siddharth Suryanarayanan, Jinglin Xu, Dr.
Michael Steurer, Dr. Sanjeev Srivastava, Dr. David Cartes, and Dr. Steve Woodruff, ―Time-Varying Power Quality Issues: An Overview of Advanced Modelling / Simulation and Control
Approaches, Applications and Solutions‖, 21st-25th May 2006.
[12] B. K. Panigrahi, Sunil Kumar Sinha, Ankit Mohaptra, Priyadarshini
Dash and Manas Kumar Mallick, ―A Comparative Study of Signal Processing and Pattern Recognition Approach for Power Quality