www.arpnjournals.com
THE CORRELATION BETWEEN TOTAL ELECTRON CONTENT
VARIATIONS AND SOLAR ACTIVITY
S. Z. M. Hamzah, M. J. Homam
Faculty of Electrical and Electronic Engineering, Universiti Tun Hussein Onn Malaysia, 86400, Parit Raja, Batu Pahat, Johor, Malaysia
E-Mail: [email protected]
ABSTRACT
Due to the irregularities and dispersive medium of ionosphere, the total electron content (TEC) varies caused by a several factors such as local time (LT), latitude, longitude, season, geomagnetic conditions, solar cycle and activity, and so on. This investigation focused on the correlation between TEC variation and solar activity at an equatorial and polar station. This paper investigated the TEC variation at recent solar cycle 24. 2008 indicates solar minimum period while 2013 indicates solar maximum period. This paper covered analysis on hourly mean TEC value at the equatorial station, Libreville, Gabon (0.354˚N, 9.672˚E) and the polar station, Ny-Alesund, Norway (78.929˚N, 11.865˚E). By using the GPS-TEC analysis application software, the TEC value was extracted from Receiver Independent Exchange (RINEX) observation files. The TEC values increases during solar maximum because of higher solar activities. Additionally, geographic latitude also affects TEC variation, as solar radiation hits directly to the Earth’s atmosphere at Libreville station thus more ionization processes occurs. At Ny-Alesund station, winter anomaly causes the TEC values in winter goes high, approximately ~5 TECU in 2008 and ~8 TECU in 2013.
Key words: Ionosphere, Total Electron Content, Solar Activity.
INTRODUCTION
Solar ultraviolet radiation has an enough amount of energy to radiate into the Earth’s upper atmosphere. The interaction between solar radiation with atomic molecules and atoms attributed to the formation of ionospheric layers by undergoing ionization (Olwendo, Baki et al. 2012). Solar radiation ionizes the air particles in the upper atmosphere creating electrically conductive region. Photons of energy from the radiation dislodge electrons from their molecules and atoms during collision producing electrically free electrons. These electrically free electrons formed the conductive plasma consists of several depletion layers. The depletion layers ranked according to a diverse of electron densities. A formation of variety of electron density is because of exposure of different types of radiation, recombination and transport processes. Ionosphere layers formed at the height of about 50 km up to 1000 km altitude above the Earth (Panda, Gedam et al. 2015). The depletion layers consist of the lowest layer (D layer), the middle one (E layer) and the top layer (F layer). F layer could be subdivided into F1 and F2 layers as the subdivision of these layers will apparently disappear at night.
Characteristics of ionosphere as a temporal and spatial variation in electron content brings so much help on navigation and satellite communication system. Ionospheric behaviour is widely investigated over many years by researchers including several measurement techniques. Prior to the well establishment of GPS, there are a few conventional ionospheric behaviour measurement techniques such as ionosonde measurement, incoherent radar system, topside sounders, backscatter radars, Doppler effect, Faraday rotations and dual frequency microwave tracking system (Aggarwal, Joshi et al. 2012), (D’ujanga, Baki et al. 2013), (Amabayo and Cilliers Pierre 2013), (Scidá, Ezquer et al. 2012). Nevertheless, all these methods
have some limitations to give accurate and precise estimation of the ionospheric dependent frequency time delay in the navigation signal. With nowadays sophisticated technologies and pervasive ionospheric TEC study, it attracts many researchers to explore this study into deeper. GPS navigational and communicational system is emphasized in exploring ionospheric TEC globally hence offer exceptional opportunities for ionospheric research. Its effectiveness and efficiency towards ionospheric research under various circumstances almost make it to ideal and preeminent technology system.
Ionospheric TEC is measured by the number of electrons in a vertical column with a cross sectional area of 1 m2 (one square meter), namely as TEC of the medium
(Klobuchar 1996). The TEC is measured in a unit called TECU, where 1 TECU= 1x10¹⁶ electrons/m2.
Solar cycle and solar activity
Solar cycle 24 is current solar cycle and it began on early 2008 with minimal solar activity until early 2010 (Hao, Shi et al. 2014). Solar cycle 24 is starting from year 2008 and expected to end in 2019. As till now, solar cycle 24 is recorded as a solar cycle with the lowest recorded sunspot activity (Hady 2013). Solar activity is represented by the number of sunspots. Sunspots are the dark areas on the Sun. Throughout the 11-year sun cycle, the number of sunspots is highly variable in which generally divided into two, solar minimum and solar maximum.
When the depletion layers formed due to ionization process, the TEC is heterogeneous. The more electrons along the path of propagation waves, the more signals will be affected. For ground to satellite communication and navigation, TEC is a good parameter to monitor for possible space weather impacts.
This paper covered a study on the hourly mean TEC values at the equatorial station, Libreville, Gabon (0.354˚N, 9.672˚E) and the polar station, Ny-Alesund, Norway (78.929˚N, 11.865˚E) under different solar activity.
METHODOLOGY
Reliance of modern community on navigation and communication system such as GPS since the late 1980s led to formal recognition of the International GPS Service (IGS) and IGS has become an important source for observing the TEC in almost real-time. The data of two receiver stations used for this investigation were obtained from the IGS web server. In this work, the obtained results used universal time (UT) zone in which for the equatorial station, its LT is 1 hour ahead from UT, and for the polar station, its LT is also 1 hour ahead from UT. The IGS is a voluntary federation of more than 200 agencies that pool resources and permanent GPS and GLONASS station data to generate precise GPS and GLONASS products (http://igscb.jpl.nasa.gov). These data are accessible from several servers including at the Crustal Dynamics Data
Information System (CDDIS) server
(ftp://cddis.gsfc.nasa.gov/pub/gps/data/daily/).
GPS measurements based on dual-frequency signals ƒ1, (1575.42 MHz) and ƒ2, (1227.60 MHz), were
used to obtain the vertical TEC data in 2008 and 2013 at both stations. The ground-based dual-frequency GPS receiver constantly records the two pseudo-ranges (P1 and
P2) and the phases (L1 and L2) of the two signals. The
obtained data were used to estimate the slant TEC, STEC at 30 s interval and to calculate vertical TEC, VTEC (Ma and Maruyama 2003). The vertical TEC is the total number of electrons in a vertical column with a cross sectional area of 1 m2 along the ray path (Klobuchar 1996). In practice,
VTEC is given by (Liu, Huang et al. 2012)
] cos arcsin cos[ ) ( h R R b b TEC VTEC E E r s sl (1)
TECsl = the slant path TEC
bs = the satellite biases
br = the receiver biases
RE = 6378 km
h = the height of the
ionospheric layer
α = the elevation angle of the satellite
The cut-off elevation angle, 30°, is selected to reduce the time shift and to avoid unnecessary errors caused by multipath and uncertain number of data. Pseudo-range with low elevation is more likely to be affected by the multipath effect and the decrease in reliability than that with high elevation. If the elevation angle is too high, a few satellites will record data to the ground-based GPS receiver, resulting
in the decline in the measured data. TECsl which is
calculated from the pseudo ranges (P1 and P2), and the
phases (L1 and L2) of the two signals, is given by (Liu,
Huang et al. 2012)
) ( ) ( 31 . 40 ) ( 1 2 2 2 2 1 2
1 p p
f f
f f
TECslp
(2)
) ( ) ( 31 . 40 ) ( 2 2 1 1 2 2 2 1 2 2
1 L L
f f
f f
TECsll
(3)
λ1 = the wavelengths that
correspond to f1
λ2 = the wavelengths that
correspond to f2
Equation (2) and (3) are the absolute and relative values of TECsl. To obtain high accuracy for TECsl, a parameter
named Brs baseline is introduced. This parameter is
computed as the average difference between TECslpi and
TECslli from i=1 to i=N. Brs is defined as follows (Liu,
Huang et al. 2012)
N i i Ni slpi slli i
rs TEC TEC B 1 2 1 2 sin sin ) ( (4)
Brs = baseline
N = the number of
measurements,
transmitted by the satellites
sin2 α
i = weighting factor
sin2 α
i is used to reduce the multipath effect. TECsll is fitted
to TECslp then the slant TECsl is obtained by (Liu, Huang et
al. 2012)
rs sll
sl TEC B
TEC (5)
Data retrieved from IGS network are stored in the Receiver Independent Exchange (RINEX) observation files. The GPS RINEX observation files are processed using Equation (1) to (5) in the GPS-TEC analysis application software version 2.5, developed by Gopi Seemala of the Institute for Scientific Research, Boston College, USA (Olawepo, Oladipo et al. 2015). The program plots vertical TEC on the screen and writes ASCII output files such as *.CMN and *.STD files. These files are required to represent data results in graphical form. In this study, the GPS observation data in 2008 and 2013 for both stations are processed. The respective RINEX observation files data of 2008 and 2013 were processed for further TEC analysis.
RESULTS AND DISCUSSION
As an early presumption, the relationship between solar activity and TEC is linearly proportional and it has showed a good positive correlation (Tourpali, Schuurmans et al. 2005). TEC is also dependent on the amount of sunlight irradiance. TEC is firstly determined by the ionization process. During a high solar activity, the number of sunspots increases, the amount of charged particles being emitted into Earth’s atmosphere also increases. Thus high sunlight irradiance causes numerous ionization processes in Earth’s atmosphere.
This early presumption is proven by undergo some investigations. By referring to Figure 2(a)-(d), it can be clearly seen that the TEC during low solar activity, 2008, lower than that during high solar activity of year 2013. Color bar indicates the range value of TEC. Figure 2(b) and 2(d) shows that the red color portion is large in comparing with Figure 2(a) and (c). The red color portion shows high value of TEC in respective years. Based on Figure 2(a)-(d), the highest peak TEC value is at around noon approximately within 1000 UT to 1500 UT. The SSN in February 2008 varied from 0 to 11, and the SSN in July 2008 varied from 0 to 8. While the SSN in February 2013 varied from 20 to 70 and the SSN in July 2013 varied from 25 to 95. It explains the larger red color portion in 2013 as its SSN is much higher than that 2008.
Based on Figure 2(a)-(d), some of TEC values are not available at IGS network data, in which marked with black color.
2(a)
2(b)
2(d)
Figure 2(a)-(d): mean TEC values during February and July, 2008 and 2013 over Libreville and Ny-Alesund stations
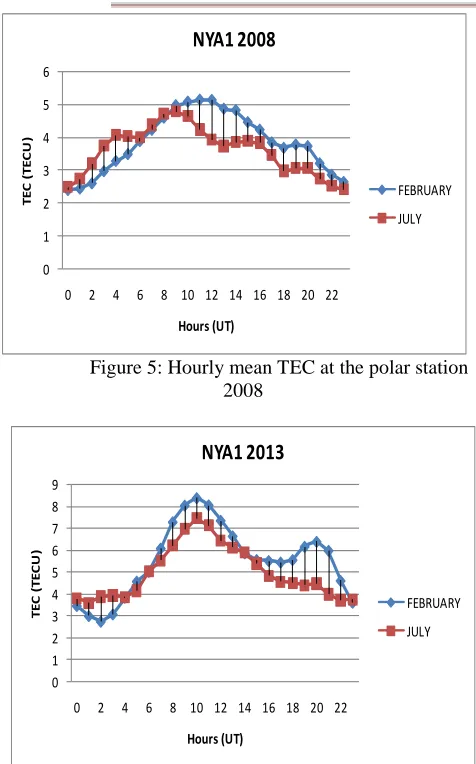
By referring to Figure 3 and 5, the peak TEC value at Libreville (equatorial) station on February and July, ~35 TECU and ~20 TECU in 2008 is higher than that Ny-Alesund (polar) station, ~5 TECU. Similarly in 2013, the equatorial station peak TEC value in respective months are ~45 TECU and ~40 TECU while the polar station peak TEC value are ~8 TECU and ~7 TECU, as shown in Figure 4 and 6. It can be inferred that the obtained graphs showed the TEC values at the polar station are very small in comparing with the equatorial station. The solar radiation hits Earth’s atmosphere directly over the equatorial station. As the solar radiation hits directly into Earth’s atmosphere, more charged particles being emitted that causes stronger ionization processes in ionosphere. Stronger ionization processes leads to higher amount of TEC.
However, the polar station experiences seasonal variation, February is considered as winter season while July is considered as summer season (Huo, Yuan et al. 2009). One of features of seasonal variation of TEC is winter anomaly and it is a typical phenomenon at high latitudes (Cai, Ma et al. 2008) and occurs only during the day. The winter anomaly is defined as the transfer of O/N2
ratio from the summer hemisphere to the winter hemisphere. The effect of winter anomaly is large during solar maximum and small during solar minimum (Torr and Torr 1973). The difference of TEC between winter and summer season in 2008 and 2013 is approximately ~1 TECU, as shown in Figure 5 and 6. Winter anomaly at the polar station is more frequent during solar maximum
(Panda, Gedam et al. 2015) primarily because of larger winter to summer differences of O/N2 ratio. During solar
maximum, less ionization processes occurs in winter than summer because of the different solar zenith angle hence produces an amount of low TEC value (Rishbeth and Setty 1961). However, the production of high O/N2 ratio, namely
winter anomaly helps to increase the TEC value in winter. The winter anomaly is less prevalent in solar minimum and the difference of TEC in respective February and July between 2008 and 2013 is approximately ~3 TECU. It is clearly shown in Figure 5 and 6.
0 5 10 15 20 25 30 35 40
0 2 4 6 8 10 12 14 16 18 20 22
T
E
C
(
T
E
C
U
)
Hours (UT)
NKLG 2008
FEBRUARY
[image:4.595.313.546.214.382.2]JULY
Figure 3: Hourly mean TEC at the equatorial station 2008
0 5 10 15 20 25 30 35 40 45 50
0 2 4 6 8 10 12 14 16 18 20 22
T
E
C
(
T
E
C
U
)
Hours (UT)
NKLG 2013
FEBRUARY
JULY
Figure 4: Hourly mean TEC at the equatorial station 2013
[image:4.595.310.543.410.577.2]0 1 2 3 4 5 6
0 2 4 6 8 10 12 14 16 18 20 22
T
E
C
(
T
E
C
U
)
Hours (UT)
NYA1 2008
FEBRUARY
[image:5.595.45.283.71.453.2]JULY
Figure 5: Hourly mean TEC at the polar station 2008
0 1 2 3 4 5 6 7 8 9
0 2 4 6 8 10 12 14 16 18 20 22
T
E
C
(
T
E
C
U
)
Hours (UT)
NYA1 2013
FEBRUARY
JULY
Figure 6: Hourly mean TEC at the polar station 2013
CONCLUDING REMARKS
This paper shows the presence of strong relationship between TEC variation and its dependence on solar activity mainly during solar maximum. The peak TEC value in respective February and July at both polar and equatorial stations during solar maximum is higher than that solar minimum, approximately ~8 TECU and ~7 TECU, and ~47 TECU and ~42 TECU. In addition to that, winter anomaly phenomenon also affects TEC by the changes of O/N2 ratio over winter hemisphere. Winter anomaly
frequently occurs at middle and high latitudes and during the day. Also, winter anomaly occurs prevalently in solar maximum because of high intensity of solar radiation. It is concluded that the TEC is much dependent on solar activity.
ACKNOWLEDGEMENT
The authors would like to express their gratitude to the Ministry of Education Malaysia for providing the funds for this work under FRGS Vot 1233. We are similarly thankful to the IGS Data Centers for providing the data. Lastly, we recognize the assistance of Dr. Gopi Seemala for his GPS-TEC analysis application.
REFERENCES
Aggarwal, M., H. P. Joshi, K. N. Iyer, Y. S. Kwak, J. J. Lee, H. Chandra and K. S. Cho. 2012. Day-to-day variability of
equatorial anomaly in GPS-TEC during low solar activity period. Advances in Space Research 49(12). 1709-1720.
Amabayo, E. B. and J. Cilliers Pierre. 2013. Multi-station observation of ionospheric irregularities over South Africa during strong geomagnetic storms. Advances in Space Research 51(5). 754-771.
Bhuyan, P. K. and R. Hazarika. 2013. GPS TEC near the crest of the EIA at 95°E during the ascending half of solar cycle 24 and comparison with IRI simulations. Advances in Space Research 52(7). 1247-1260.
Cai, H., S. Ma, Y. Fan, Y. Liu and K. Schlegel. 2008. Climatological features of electron density in the polar ionosphere from long-term observations of EISCAT/ESR radar. Annales Geophysicae.
D’ujanga, F. M., P. Baki, J. O. Olwendo and B. F. Twinamasiko. 2013. Total electron content of the ionosphere at two stations in East Africa during the 24–25 October 2011 geomagnetic storm. Advances in Space Research 51(5). 712-721.
Hady, A. A. 2013. Deep solar minimum and global climate changes. Journal of Advanced Research 4(3). 209-214.
Hao, Y. Q., H. Shi, Z. Xiao and D. H. Zhang. 2014. Weak ionization of the global ionosphere in solar cycle 24. Ann. Geophys. 32(7). 809-816.
Huo, X., Y. Yuan, J. Ou, K. Zhang and G. Bailey. 2009. Monitoring the global-scale winter anomaly of total electron contents using GPS data. Earth, planets and space 61(8). 1019-1024.
Klobuchar, J. 1996. Ionospheric effects on GPS. Global Positioning System: Theory and applications. 1. 485-515.
Liu, G., W. Huang, H. Shen and J. Gong. 2012. Vertical TEC variations and model during low solar activity at a low latitude station, Xiamen. Advances in Space Research
49(3). 530-538.
Ma, G. and T. Maruyama. 2003. Derivation of TEC and estimation of instrumental biases from GEONET in Japan. Annales Geophysicae.
Olawepo, A. O., O. A. Oladipo, J. O. Adeniyi and P. H. Doherty, 2015. TEC response at two equatorial stations in the African sector to geomagnetic storms. Advances in Space Research(0).
Olwendo, O. J., P. Baki, C. Mito and P. Doherty. 2012. Characterization of ionospheric GPS Total Electron Content (GPS–TEC) in low latitude zone over the Kenyan region during a very low solar activity phase. Journal of Atmospheric and Solar-Terrestrial Physics 84–85(0). 52-61.
anomaly Indian subcontinental region. Advances in Space Research(0).
Rishbeth, H. and C. S. G. K. Setty. 1961. The F-layer at sunrise. Journal of Atmospheric and Terrestrial Physics
20(4). 263-276.
Scidá, L. A., R. G. Ezquer, M. A. Cabrera, M. Mosert, C. Brunini and D. Buresova. 2012. On the IRI 2007 performance as a TEC predictor for the South American sector. Journal of Atmospheric and Solar-Terrestrial Physics
81–82(0). 50-58.
Torr, M. R. and D. G. Torr. 1973. The seasonal behaviour of the F2-layer of the ionosphere. Journal of Atmospheric and Terrestrial Physics 35(12). 2237-2251.