Journal of Chemical and Pharmaceutical Research, 2014, 6(6):1333-1338
Research Article
ISSN : 0975-7384
CODEN(USA) : JCPRC5
Data processing and visual representation algorithm for the
incomplete, multi-valued information system
Wei ling-ling
Department of Computer of Jiang Xi Technology University Nan Chang JiangXi, China
_____________________________________________________________________________________________
ABSTRACT
At present, many of the processing algorithms for the incomplete, diversity, and multiple-value data, but further processing is not introduced after filled. First calculated the probability of the missing attribute value in a certain scale, set the threshold, when the attribute probability is greater than or equal to the threshold value to fill in the missing; Secondly the information system after treatment is represented with hierarchical and visual decision tree; Finally designed and applied the algorithm, then verify the validity and practicability of the algorithm.
Keywords: decision tree; concept-layered; incomplete information systems; multi-valued information systems;
preprocessing.
INTRODUCTION
With the information technology developing constantly and the data size increasingly large, the incomplete, diversity, and multiple-value data are appeared with the data quantity increase every day, the preprocessing and storing of these data is the problem to be solved.
At present, many of the processing algorithms for the incomplete, diversity, and multiple-value data, for example[1-5] dealing with missing values in a probabilistic decision tree during classification, imputation algorithm of missing values based on EM and Bayesian network, missing value estimation for DNA microarray gene expression data with principal curves and missing value estimation for mixed-attribute data sets, they were offered filled method only, but further processing is not introduced after filled. So this article analyzes the present situation and put forward pretreatment method for the incomplete, multi-valued, and the data visualization by means of concept hierarchy.
CORRELATION CONCEPTION
Definition 1: information system
Information system[6-9] can be represented by S=(U,A,V,f),where U said the nonempty finite sets of object, A said the nonempty finite sets of property; , where Va said the priority of attributes A; is a
information function which specifies the attributes value of each object in U.
Definition 2: incomplete information systems
If the , where C said the condition attribute[10], D said the decision attribute, then
is the decision table or decision information systems. If and (i=1,2…n) containing null values which
Table 1. Family data incomplete data samples[11]
Num temp humi lumi power sensitivity Rm1 28 41 200 31.4 3 Rm 2 28 41 200 87.1 3 Rm 3 29 42 * 43.5 2 Rm 4 27.5 * 170 29.4 2 Rm 5 29 42 * 40.1 1 Rm 6 29 41 190 31.4 3 Rm 7 28 42 170 29.4 2 Rm 8 29 41 190 43.5 2 Rm 9 28 42 180 32.7 1 Rm 10 29 41 180 32.7 1
Definition 3: multi-valued information systems
If the ,where C said condition attribute, D said decision attribute,then is decision
table or decision information systems. If and (i=1,2…n) greater than 1 and not equal to 0,then
is the multi-valued information systems or the set-valued information systems, below is the multi-valued information systems.
For example: It is assumed that the soil analyst usually measure and analysis soil from soil color、partition size and
quality of soil. The range of three attributes are partitioned into below equivalence classes in measure:
COLOR={[black,ebony], [brown, tan, sienna],[white], [gray], [orange]}
SIZE={[big,large],[huge,enormous],[medium],[small, little, tiny]}
QUALITY={[good],[fertile,productive],[normal],[poor, bad]}
[image:2.595.198.416.439.541.2]Which COLOR has eight values, it is partitioned five equivalence classes; SIZE has eight values, it is partitioned into four equivalence classes; QUALITY has six values, it is partitioned into four equivalence classes. Soil analyst measured data once time below table 2.
Table 2 The rough relational table of soil information[12]
COLOR SIZE QUALITY
Brown Medium Normal Black, tan Large Normal, fertile Gray Medium, small Poor Gray, black Tiny Poor
Gray, brown Large Normal, productive Gray, white Medium Normal
Gray, black Big Normal, fertile
White, gray, tan Enormous, big Good, productive, normal
DATA PREPROCESSING ALGORITHM Data preprocessing
(1)The incomplete information system
It is use the probability fill method filled the missing sections of the incomplete information systems, specific methods as below:
The first calculated the probability of Va of attribute a(∃a∈C);
Secondly setting a threshold value alpha;
Finally the probability of Va is greater than or equal to the alpha fill into the missing place.
(2)The conception hierarchical and visual representation[13]
______________________________________________________________________________
The algorithm
Algorithm 1: The incomplete information systems filled method
Input: The incomplete information table; a record number of ReNum; The threshold alpha. Output:The multi-valued information table after filled
initialize:k=0; DeNum=0;
Typedef struct{ string value; int count;
}VaNum[ReNum];
for(i=0;i<ReNum;i++) //calculated the probability of Va;
{
int count=0;
for(j=0;j<ReNum;j++) {
VaNum[k].value=via //via said the ith and the value of the attribute a
if( VaNum[k].value=vja)
count++; } VaNum[k].count=count/ ReNum; K=k+1; } DeNum=k; for(k=0;k< DeNum;k++) {
if (VaNum[k].count>= ) filled value to the blank; }
Algorithm 2: the conception hierarchical and visual representation Input: the multi-valued information systems
Output: the decision tree Initialization:
#define MAX_TREE_SIZE 100; int A[N];
for(i=0;i<|C|;i++) {
make sure the classification attributes; count value of attribute i;
}
sort(i) from small to large; for(j=1;j<|A|;j++)
void CreateDeT(PTree *T)//decision tree construction CreateDeT(PTree *T)
{
Create a node N for the data table;
If the data in the databases belong the same class, then the N is the leaves and mark the class on the leaves;
If the data in the table have not other attributes can be considered
then the N is also the leaves, and mark leaves on category according to the minority is subordinate to the majority principle;
Else choose the one that best attribute as the splitting attribute node N according to attribute value sizes;
Node attribute is selected, for each of the attribute values: Create a branch from the N;
Collect the data relating to the branch of the data and form a node of branch; Delete the attribute of the table;
If the table is not empty
The time complexity is O(N2) of algorithm 1,and provide perfect data structure for data analysis and researched; the algorithm 2 provide a visual representation for multi-valued information systems make for decision makers visual browsing before formulation and selection of decision scheme.
The example analysis
Table 1 for the incomplete data samples U of the digital home system, Rmi(i=1,2,3,…)on behalf of the sensor nodes, C said the condition attributes, D said the decision attributes,* said the missing data. Where temp is the temperature information, humi is humidity information, lumi is the light intensity information, power is the node residual energy value, sensitivity is the decision value.
(1)Filled the missing value
[image:4.595.178.436.237.350.2]The result of table 1 used the probability filled method:
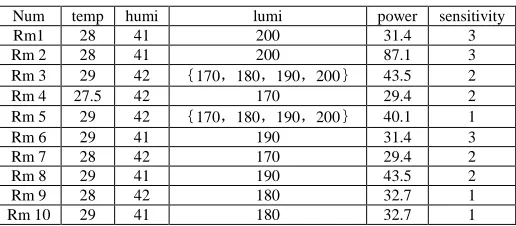
Table 3. Family data after processing
Num temp humi lumi power sensitivity Rm1 28 41 200 31.4 3 Rm 2 28 41 200 87.1 3 Rm 3 29 42 {170,180,190,200} 43.5 2
Rm 4 27.5 42 170 29.4 2 Rm 5 29 42 {170,180,190,200} 40.1 1
Rm 6 29 41 190 31.4 3 Rm 7 28 42 170 29.4 2 Rm 8 29 41 190 43.5 2 Rm 9 28 42 180 32.7 1 Rm 10 29 41 180 32.7 1
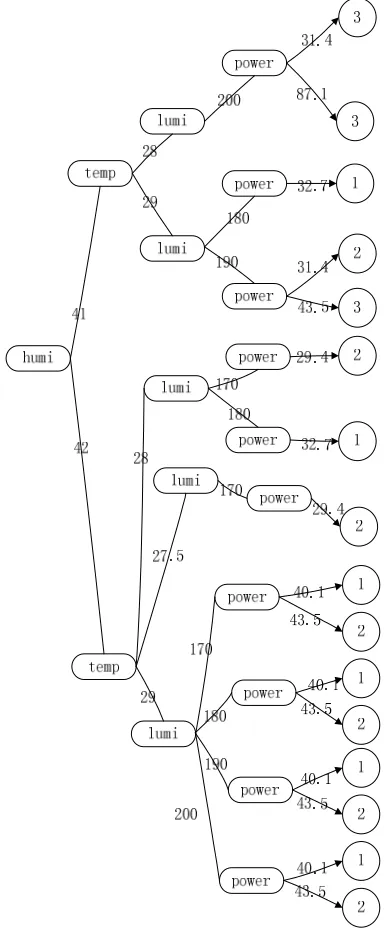
(2)The conception hierarchical and visual representation
______________________________________________________________________________
Figure 1 the conception hierarchical decision tree of table 3
From the data processing and visual representation can be seen:
It is can reached soon the decision attribute values that it is have the condition attribute value.
Figure2 the conception hierarchical decision tree of table 2
CONCLUSION
This paper main studied filled data in the incomplete information and the multi-valued information systems by probability of attribute values, and the data visualization is represented by the conception hierarchical decision tree of the multi-valued information systems after processing. The first step provide complete data for further researched, data visual representation is conducive the decision selection in various condition.
REFERENCES
[1] LamisHawarah,Ana Simonet, Michel Simonet TIMCIMAG. Dealing with missing values in a probabilistic decision tree during classification.proceeding of the 6th IEEE International Conference on data uning-workshops.
Washington,DC USA:IEEE,2006:325-329.
[2] Zhang S C. IEEE transactions knowledge and data engineering.2008,9(1):32-38.
[3] LI Hong, EMMANUER Amani, LI Ping, etc. Computer Engineering and Applications,2010,46(5):123-125. [4] Jinlong SHI,ZhigangLUO. missing value estimation for DNA microarray gene expression data with principal curves.International Conference on Bioinformatics and Biomedical Technology. Haesun Park:IEEE,2010:262-265. [5] Xiaofeng ZHU,Shichao ZHANG. IEEE transactions on knowledge and data engineering,2011,23(1):110-121. [6] Pawlak Z,Skowron A. Information Sciences,2007,177:3-27.
[7] ZHANG Wen-xiu,WU Wei-zhi,LIANG Ji-ye. rough set theory and method. BEIJING: science press,2001:1-212. [8] T.Beaubouef, F.Petry and G.Arora. Information Science, 1998,109: 185-195.
[9] T.Beaubouef, F.E.Petry and B.Buckles. Computational Intelligence,1995,11(2): 233-245. [10] JIANG Liu,MI Yun-long,WANG Tian. Computer Engineering And Applications,2013
[11] CHEN Zhi-kui,LV Ai-ling,ZHANG Qing-chen. microelectronics and computer,2013,30(7),167-176.
[12] GUO Jing-feng,LI Li,GONG Ji-bing. Computer Science,2004,31 (9):90-95.
[13] Jiawei Han,Micheline Kamber.data mining-concepts and technology.BEIJING:china machine press,2001:
70-95.
[14] Gu Shen-Ming,Wu Wei-Zhi,Xu You-Hong. Journal of Nanjing university(natural sciences).2013.49(5):567-573.
![Table 1. Family data incomplete data samples[11]](https://thumb-us.123doks.com/thumbv2/123dok_us/8768123.897527/2.595.214.403.88.201/table-family-data-incomplete-data-samples.webp)