Advanced Ceramics Progress
J o u r n a l H o m e p a g e : w w w . a c e r p . i r
Determination of Cristobalite Phase Content in Ceramic Cores Using Four
Different X-ray Quantitative Phase Analysis Methods
R. Naghizadeha*, F. Kazemib, F. Arianpoura, R. Ghaderic, M. Haj Fathalianc, M. Taheria, H.R. Rezaiea
a School of Metallurgy and Materials Engineering, Iran University of Science and Technology (IUST), Tehran, Iran. b Department of Mining and Metallurgy, Amirkabir University of Technology, Tehran, Iran.
c Mapna Turbine Blades Eng. and Mfg. Co. (PARTO), Karaj, Iran.
P A P E R I N F O
Paper history:
Received 08 November 2016
Accepted in revised form 03 October 2017
Keywords: Cristobalite Ceramic core X-ray diffraction Quantitative phase analysis
A B S T R A C T
The aim of this research isto investigate the cristobalite phase content in ceramic cores by different X-ray based quantitative phase analysis methods. For this purpose, four popular routes including peak absolute intensity method, relative intensity ratio method, direct or calibration method andinternal standard (or Alexander-Klug) method were chosen. Some control samples have been made using common raw materials which were used in the ceramic cores and characterized by X-ray diffraction to measure the main peaks intensities. Using each quantitative method with their unique mathematical calculation procedures, the cristobalite phase contents were calculated and compared with the real cristobalite phase contents of the samples. The results showed that the presence of the amorphous fused silica phase could have drastic effects on accuracy of the X-ray based quantitative phase analysis routes and the peak absolute intensity method showed the best results among the investigated routes.
1. INTRODUCTION1
Ceramic cores are mainly used in the manufacturing of the complex-shaped thin-walled gas turbine blades by casting with investment patterns to shape the internal cavities; they possess strength at the working temperature and provide a high precision of castings [1]. Processing technology and evolution of ceramic cores products were the main interesting subjects investigated in recent researches and studies [2]. However, most of the mentioned published reports are restricted as proprietary data or protected by patents. For successful application of the new super alloys, it is apparent that the control of phase contents, ceramic core microstructure, tailoring of related excellent leachability, chemically and dimensional stability at casting temperatures are significantly important [3]. Ceramic cores are high-tech parts usually produced by injection molding process which involves very precise and often complex forming tools to achieve ‘near net shape’ products. A list of possible ceramic materials is reduced to only a few candidates due to the required chemical solubility. For the practice of single-crystal casting, the available ceramics are silica, silica/zircon
1*Corresponding Author’s Email:[email protected] (R. Naghizadeh)
and alumina based materials for the majority of nickel and cobalt based super alloys [4, 5].
Ceramic cores based on fused silica are generally used in the investment casting technology to form hollow, precise, and complex-shaped metallic industrial products [4-6]. Their usage is prevalent in the manufacturing of super alloy gas turbine components where internal structures, such as cooling passages, are desired. A practical method to form these structures is to cast the metal around a chemical leachable, fused silica ceramic cores that have been previously fabricated by injection molding, transfer molding, or rapid prototype printing. A successfully used ceramic core is the one in which an optimum compromise between crushability and stability was promoted; namely, the ceramic deformed rapidly enough to allow sufficient stress relaxation in the metal and concomitantly being sufficiently rigid or stable to maintain intended dimensional tolerances of the metal component. Recent researches have been conducted to evaluate some thermomechanical effects on the mechanical properties of silica-based ceramic cores in terms of two facts including; first, the crystallization phenomenon of fused silica in the typical heating of alloys during casting and second, the density difference between amorphous and crystalline silica-based phases [7].
Generally, presence of cristobalite in refractories made from vitreous silica is, of course, a degrading factor.
Powder X-ray diffraction patterns of quartz ceramic specimens show that during firing, cristobalite crystallizes instructurally imperfect forms. Former works indicated that the crystallization control of fused silica is the most important factor to prevent the hot deformation of the ceramic cores which has been used to make the hollow-shaped investment casting components. Some researchers showed the relationship between cristobalite level and the bend rate of the core test pieces at 1150°C indicating that with a little devitrification the core could have very low level of cristobalite. These ceramic cores products have weak refractoriness which leads to intensive bending for thin and delicate shapes especially in single-crystal casted hollow blades and products. Other works indicated core strength reduction with high levels of devitrification and about 60 wt.% cristobalite [8]. So, it seems very important to control and determine the quantity of the cristobalite phase in ceramic core systems.
A number of techniques have been employed for determination the phase content of the materials; the most commonly used are microscopy, chemical separation, thermal analysis, density measurement and X-ray diffraction [9, 10]. The qualitative analysis method of X-ray diffraction involves the identification of multiphase in samples by comparing with the standard patterns, and evaluation of proportions of different phases by comparing peak intensities attributed to the identified phases [11-15]. However in previous research, a novel method was established for quantitative thermal analysis of cristobalite phase, other phases such as zircon or amorphous silica could not be determined by DSC thermal analysis method [16]. Therefore, the aim of this research is to investigate the cristobalite phase content in ceramic core bodies by four different X-ray based phase quantitative methods. For this purpose, four popular routes were selcted that included peak absolute intensity method, relative intensity ratio method, direct or calibration method, and internal standard (or Alexander-Klug) method.
2. EXPERIMENTAL
2.1. Materials and samples preparation
The fused silica, cristobalite, alumina, zircon and zinc oxide were used in this research work. Table 1 shows the specifications of the main raw materials used for sample preparation. The powders were weighted according to the formulation mentioned in Table 2 and then wet mixed in a PTFE jar using alumina balls and methanol as mixing media for 24 hr. Then the mixtures were dried on a heater-stirrer device and the powders were passed from a 325-mesh sieve.
2.2. X-ray diffractions In this work, all phase analyses were performed via X-ray
diffractometery (XRD) using Philips PW 1800 (Netherlands, 2004) X-ray system.
TABLE 1. Efficiency and particle size of microcapsule samples.
Purity (wt.%)
Mean Particle Size
(μm)
Source
Fused Silica > 98 75 Remet, UK
Cristobalite > 99 45 Sibelco, Belgium
Zircon > 98 1.5 JohnsonMatthey, Italy
Alumina > 99.5 4 Pechiney, France
Zinc Oxide > 99 2-5 Merck, Germany
TABLE 2. The composition of samples. (FS: Fused Silica, C: Cristobalite, Z: Zircon, A: Alumina, ZnO: Zinc Oxide).
FS C Z A ZnO
Control Samples
C1 60 5 20 5 10
C2 30 20 30 10 10
C3 25 40 20 5 10
C4 0 65 20 5 10
RIR Method Samples
RIR1 0 50 0 0 50
RIR2 0 0 50 0 50
RIR3 0 0 0 50 50
Calibration Method Samples
CA1 100 0 0 0 0
CA2 80 20 0 0 0
CA3 60 40 0 0 0
CA4 40 60 0 0 0
CA5 20 80 0 0 0
CA6 0 100 0 0 0
Internal Standard
Method Samples
IS1 0 90 0 0 10
IS2 10 80 0 0 10
IS3 30 60 0 0 10
IS4 50 40 0 0 10
IS5 60 30 0 0 10
IS6 80 10 0 0 10
IS7 85 5 0 0 10
Unknown Samples
US1 84 6.5 6.5 3 0
US2 51.5 34.5 10.5 3.5 0
US3 68.5 19.5 5.5 6.5 0
US4 32.5 44.5 20.5 2.5 0
The sample holder was disc like shape (40*4 mm) and the system has been equipped by a PW3011 detector, gas type counter, 40 mV voltage and 30 mA current. All X-ray patterns were obtained in the 2θ range of 5-120 degree, step size of 0.04 and time per step of 1 second for all samples. The total scanning times took place for about 50 minutes. All raw materials, control samples and also the specimens prepared through each method have been scanned by this manner.
2.3. Quantitative phase analysis methods 2.3.1. Peak absolute intensity method
In this rout, control samples were prepared according to Table 2 and then all X-ray diffraction patterns were obtained. The absorption coefficient (μ/ρ) of each sample was calculated according to Table 3 and Equation (1) [9, 11].
TABLE 3. The absorption coefficients of elements (E), phases (p), control samples (CS) and unknown samples (US).
i i
j w( )
) (
The amount of cristobalite phase is calculated via Equation (2), where I°(hkl)α is the intensity of pure α
phase, I(hkl)α is the intensity of α phase in each sample,
(μ/ρ)α and (μ/ρ)s are the absorption coefficients of pure
α phase and α phase in each sample, respectively, and Xα is the amount of α phase.
X I
I
s o
hkl hkl
) (
) (
) (
) (
2.3.2. Relative intensity ratio method
In this method, three different samples were prepared according to Table 2 which contain equal amounts of α phase and zinc oxide. The α phase can be corundum, cristobalite and zircon in different cases. Equation (3) determines the RIR indexes where I°(hkl)α and I°(hkl)ZnO
are the intensity of α phase and ZnO in the X-ray diffraction patterns of the above three samples. The X°ZnO/X°α ratio is equal to 1 according to the presence of
equal amounts of these components [6].
o o ZnO o
ZnO hkl
o hkl ZnO
X X I
I RIR
.
*
) (
) (
,
In order to determine the amounts of α phase in the control samples, Equation (4) was used. In this equation, I(hkl)α and I(hkl)ZnO are obtained from the
diffraction patterns of the control samples, XZnO is equal
to 0.1 for all control samples and consequently RIRα,ZnO
values were derived from Equation (4).
ZnO Content Sample ZnO
Sample Control ZnO hkl
hkl
RIR X
I I X
, ) (
) (
) ( '
.
2.3.3. Calibration or direct method
In this rout, the samples with compositions explained in Table 2 were prepared and then the X-ray diffraction patterns were obtained. Afterwards, a calibration line, which specifies the relationship between the cristobalite phase content and the peak intensity of this phase, was drawn. For comparison between peak absolute intensity method and calibration method, the calibration lines derived from control samples were used to estimate the cristobalite content of unknown samples.
2.3.4. Internal standard or alexander-klug method Samples with compositions explained in Table 2 were prepared in this method and then the X-ray diffraction patterns were generated. The phase intensities ratio of cristobalite (Iij) to ZnO (Iks)
was calculated and calibrated as a function of cristobalite phase content [15].
3. RESULT AND DISCUSSION
The Table 4 presents the phases intensities of all samples which have been described by various methods and also control samples. Some cells in the table include two data, which corresponding to the first and second peaks intensities of the related phases. In addition, the Iij/Iks ratios used in internal standard method are
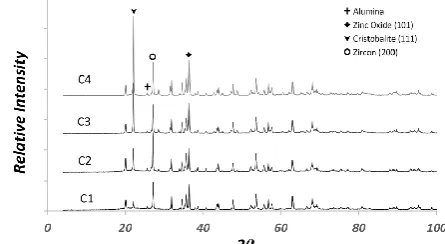
mentioned in front of IS series of samples. The X-ray diffraction pattern of control samples, RIR, calibration and internal standard samples are presented in Figs. 1-4, respectively. Furthermore, X-ray diffraction pattern of unknown samples is shown in Fig. 5. All major phases were marked and assigned to cristobalite, zircon, alumina and zinc oxide phases.
Figure 1. X-ray diffraction pattern of control samples. E (μ/ρ) P (μ/ρ)α CS (μ/ρ)s US (μ/ρ)s
Si 65.32 Silica 36.36 C1 46.59 US1 38.43
O 11.03 Corundum 31.78 C2 50.91 US2 39.62
Zr 136.8 Zircon 81.87 C3 46.59 US3 38.11
Al 50.23 ZnO 49.93 C4 46.59 US4 42.54
US5 42.63
(1)
(2)
(3)
TABLE 4. Phases intensities in all samples. (I( )= I( ) )
IZnO ICorundum IZircon ( ) ( ) 11044 3846 4553 1260 9178 I0 1756 515 1832 165 625 C1 Cont ro l Sam p les 1529 458 2611 552 1616 C2 2088 331 1823 912 3399 C3 2266 484 2079 1253 5300 C4 6626 3745 0 0 1289 4186 RIR1 RIR Me tho d Sa mp le s 2362 1362 0 1901 586 0 0 RIR2 6872 4045 1563 1246 0 0 0 RIR3 0 0 0 0 0 CA1 Ca li b rat ion Me th o d S
amples CA2 1945 467 0 0 0
0 0 0 453 3516 CA3 0 0 0 864 6806 CA4 0 0 0 1436 8028 CA5 0 0 0 1391 9187 CA6 4.07 2145 0 --- 8783 IS1 Int er n al St and ard Me th o d Samp le s 3.70 2127 0 --- 7876 IS2 2.69 2210 0 --- 5948 IS3 2.21 1668 0 --- 3699 IS4 2.02 1287 0 --- 2610 IS5 0.74 1494 0 --- 1108 IS6 0.53 1432 0 --- 764 IS7 524 --- 835 US1 Unkn o wn S
amples US2 3170 --- 620
449 --- 1989 US3 1156 --- 3624 US4 999 --- 1260 US5
Figure 2. X-ray diffraction pattern of RIR method samples
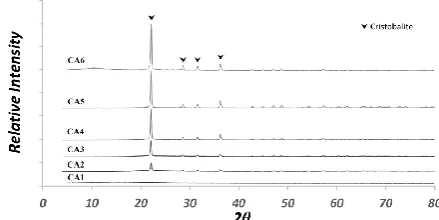
Figure 3. X-ray diffraction pattern of calibration method samples.
Figure 4. X-ray diffraction pattern of internal standard samples.
Figure5. X-ray diffraction pattern of unknown samples.
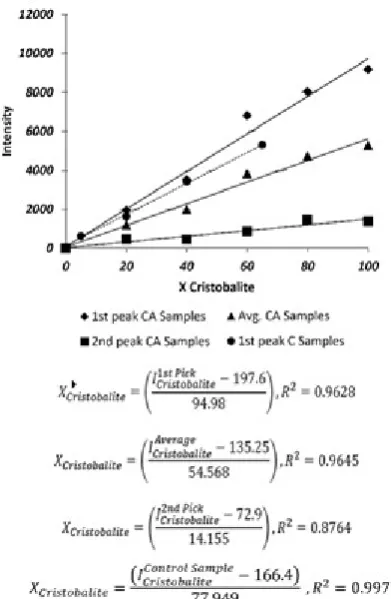
Table 5 shows the RIR indexes related to the first and second peaks and the average RIR values of each sample were inserted. According to the above-mentioned data, the calibration lines based on the first, second and average values have been drawn which are presented in Fig. 6 for CA series of samples.
TABLE 5. The calculated RIR indexes.
*RIRα,ZnO **RIR'α,ZnO Average RIR
RIR1 0.6317 1.0747 0.8532
RIR2 0.8048 0.5449 0.6749
RIR3 0.2281 0.1972 0.2127
the slops of the lines derived from control samples intensities were completely different. Therefore, the data derived out of the calibration lines, was not matched with cristobalite content of the control samples.
Figure 6. Calibration lines of control and calibration samples.
As Fig. 6 shows, the R2 factor of the average line is closer to 1 which means that the data obtained from average intensities is more linear; However, the cristobalite phase intensities of control samples was not fitted on this calibration line. According to differences between phase composition of control samples and CA samples, it seems that the presence of other phases could have effect on the intensity of each phase. The Equation (1) defines the relationship between the chemical composition and the intensity of each phase in peak absolute intensity method.
Fig. 7 has been plotted based on the Iij/Iks ratio reported
in Table 4 for IS and control samples; Similar to calibration method, the line derived out of control samples was not matched with the internal standard. The aim of dividing the intensities of two phases in this method is to reduce the effect of chemical composition. By dividing two sides of Equation (2), and inserting the indexes for ZnO and cristobalite, the equation can be written as Equation 5. This equation explains that the ratio of Iij/Iks is related to Xij/Xks and independent from
the absorption coefficient of the sample. The mismatch between internal standard calibration line and control
sample in Fig. 7, can be due to the errors multiplied from dividing two intensities.
Figure 7. Calibration line for internal standard and control samples.
ks ij
o iks
o ij
ks ij
X X
ks I
ij I
I I
. ) (
) (
After calculating the data extracted from X-ray analysis by all described methods, the calculated values of cristobalite phase are presented in Table 6. This data shows that the peak absolute intensity, relative intensity and calibration methods yield better values for cristobalite phase contents in control samples; according to the former discussion, since the peak absolute intensity is the unique method that considers the chemical composition of the samples, this method has the highest accuracy. In addition, the internal standard method could not meet the expectations and the errors of this method were unacceptable.
TABLE 6. Cristobalite phase contents estimated via different methods for control samples.
Content
Method
Peak Absolute Intensity
Relative Intensity Ratio
Calibration Standard Internal
C1 5 8.71 4.0 4.7 1.01
C2 20 24.62 24.8 17.4 16.06
C3 40 36.99 36.4 37 30.67
C4 65 73.91 51.9 57.6 44.9
values. It can be stated that for reaching an accurate calibration line to estimate cristobalite content of an unknown sample, the calibration samples should have nearest chemical composition to unknown samples.
TABLE 7. Cristobalite phase contents of unknown samples estimated via different methods.
Content Method
Peak Absolute Intensity Calibration
US1 6.5 9.6 8.57
US2 34.5 37.6 38.53
US3 19.5 22.69 23.38
US4 44.5 46.15 44.35
US5 11 16.08 14.02
4. CONCLUSION
Different methods were studied for quantitative X-ray diffraction. Methods based on dividing intensity of two phases i.e. relative intensity ratio and internal standard don’t have sufficient accuracy for determining the cristobalite content of the samples. However, the method based on the direct calculation of the cristobalite content of the samples showed sufficient accuracy. In addition, by selecting the chemical composition of the calibration samples near to unknown samples, calibration method represented acceptable accuracy.
5-ACKNOWLEDGMENTS
The authors gratefully acknowledge the MAPNA Turbine Blade Eng. & Mfg. Co. PARTO, Research and Development Department of MAPNA and PARTO for their funding, and also Mr. H. Alizade for his technical assistant.
REFERENCES
1. Li, H., Tang, Y., Sun, B. and Xu, D., "Rapid fabrication of alumina-based ceramic cores for gas turbine blades by stereolithography and gelcasting", Journal of Materials Processing Technology, Vol. 209, (2009), 5886-5891. 2. Qin, Y. and Pan, W., "A model alumina based investment casting ceramic core body system", Journal of Materials Science and Engineering with Advanced
Technology, Vol. 2, (2010), 11-25.
3. Huseby, I.C., Borom, M.P. and Greskovich, C.D., "High temperature characterization of silica-base cores for superalloys", Ceramic Bulletin, Vol. 58, No. 2, (1979), 448-452. 4. Li, X., Yao, J.S., Liu, X.G., Fan, H.N. and Niu, S.X., "Microstructure and Performance of Fused Silica-based Ceramic Core Reinforced by Mullite Fiber", Materials Science Forum, Vol. 848, (2016), 228-232.
5. Weresszczak, A.A., Breder, K., Ferber, M.K., Kirkland, T.P., Payzant, E.A., Rawn, C.J., Krug, E., Larocco, C.L., Pietras, R.A. and Karakus, M., "Dimensional changes and creep of silica core ceramics used in investment casting of superalloys",
Journal of Materials Science, Vol. 37, (2002), 4235-4245. 6. Qin, Y. and Pan, W., "Effect of silica sol on the properties of
alumina-based ceramic core composites", Materials Science and Engineering: A, Vol. 5, (2009), 71-75.
7. Mills, D. and Chen, C., In Proceedings of 15th annual conference of the british investment casters technical association, London, UK. (1979), 177-183.
8. Wang, L.Y. and Han, W.H., "The effect of cristobalite seed on the crystallization of fused silica based ceramic core — A kinetic study", Ceramic International, Vol. 21, (1995), 187-193.
9. Cullity, B.D. and Stock, S.R., Elements of X-Ray Diffraction, 1st edition, Prentice Hall, USA, (1956), 415-417.
10. Jenkins, R. and Snyder, R., Introduction to X-Ray Powder Diffractometry, 2nd edition, John Wiley & Sons, USA, (2012), 355-385.
11. Chung, F.H., "Quantitative interpretation of X-ray diffraction patterns of mixtures. I. Matrix-flushing method for quantitative multicomponent analysis", Journal of Applied Crystallography,
Vol. 7, (1974), 519-525.
12. Livingston, R.A., Stutzman, P.E. and Schumann, I., Historic Brick Structures, Donhead Publishing Ltd., UK, (1998), 105-116.
13. Kim, H.S., Rawlings, R.D., Rogers, P.S., "British ceramic",
Transactions and Journal, Vol. 88, (1989), 251-225.
14. Shinohara, Y. and Kohyama, N., "Quantitative Analysis of Tridymite and Cristobalite Crystallized in Rice Husk Ash by Heating", Industrial Health, Vol. 42, (2004), 277-285. 15. Li, Z., Ming, L.V., Pinggen, R., Anze, S. and Jianjing, W.,
"Quantitative XRD Analysis of Hydrothermally-derived Leucite Content in Dental Porcelain Ceramics", Journal of the Ceramic Society, Vol. 5, (2007), 329-332.