International Journal of Emerging Technology and Advanced Engineering
Website: www.ijetae.com (ISSN 2250-2459, Volume 2, Issue 5, May 2012)15
Performance Analysis of CS-ACELP Algorithm
With variation in Weight Factor for Weighted Speech Analysis
Nikunj Tahilramani
1, Ninad Bhatt
21Research Student, Fr. Conceicao Rodrigues College of Engg., Mumbai, India 2Research scholar, Veer Narmad South Gujarat university, Surat, Gujarat, India
1
[email protected] 2[email protected]
Abstract: G.729 algorithm is working on a analysis by synthesis principal and based on a Conjugate-Structure Algebraic Code Excited Linear Prediction (CS-ACELP) coding model which uses 10 ms speech frames for coder operations. Aim of this research is to observe overall performance of G.729 coder based on variation in the parameter weight actor. In this research, rather than using weight factor adaptively speaker dependent variations in the weight factor are suggested. This in turn produces better weighting speech for fixed weight factor moreover its also reduces complexity of implementation of this algorithm as FLAT algorithm process can now be eliminated from implementation. Here, as weighting speech is a decisive signal for subsequent blocks like open and close loop delay search process ,It ultimately overall speech quality performance of the G.729 coder. This coder is implemented in MATLAB with two different values of weight factor and its effect in terms of recovered speech quality of weighted speech has been investigated and studied. Subjective and Objective analysis on weighted speeches have been carried out in order to observe its overall performance. As can be witnessed from obtained results, with increase in the value of weight factor, overall speech quality reduces. If weight factor is made speaker dependent, it may lead to overall better speech quality and can also reduce the computational load of implemented algorithm because off elimination of FLAT algorithm from computation of weighted speech.
Keywords: Weighted speech, speech coding, Conjugate structure-Algebraic Code Excited Linear Prediction.
I. INTRODUCTION
Coder is operating with a digital signal obtained by first performing telephone bandwidth filtering of the analogue input signal, then sampling it at 8000 Hz, followed by conversion to 16-bit linear PCM for the input to the encoder. The output of the decoder should be converted back to an analogue signal in a same manner. speech quality in different conditions include speech output without any distortion and should be able to withstand with channel errors.
Decoder should be able to recover the output speech if frame loss occurs during transmission via channel. The paper is organized as follows: In sect. 2 general description of CS-ACELP speech coder is described.
In sect. 3, pre-processing which involves high pass filtering and down scaling is discussed. Sect. 4 describes LP analysis and quantization of CS-ACELP. Sect.5 touches upon Subjective and Objective performance evaluation of proposed coder for different values of weight factors. Finally the concluding remarks are given in sect. 6.
II. DESCRIPTION OF CS-ACELPSPEECH CODER
Coder is derived from a code-excited linear prediction (CELP) model. At every stage recovered signal is being compared with input signal to that particular stage to minimize the mean square error.
The CS-ACELP coder is designed to operate with an sampling rate of 8000 samples per second [15].
The input and output samples are represented using 16-b PCM. The coder works on algorithmic delay of 15ms with 5 ms look-ahead at encoder stage. The encoding principle is shown in Fig. 1. After pre-processing, tenth-order LP analysis is performed and the LP parameters are quantized in the line spectral pair (LSF) domain with 18 bits. for better analysis of parameter like pitch and gain in particular frame with reduced codebook searches, input frame is divided into two subframes of 5 ms each.excitation of each subframe is indicated by contribution of adaptive-codebook and a fixed codebook. These parameters are transmitted a nd a na l yz ed i n ea c h s ub fra me .
International Journal of Emerging Technology and Advanced Engineering
Website: www.ijetae.com (ISSN 2250-2459, Volume 2, Issue 5, May 2012)16
The adaptive-codebook index is encoded with 8 bit in the first subframe and with 5 bit in the second subframe . Fixed codebook search is done using new target signal in every
[image:2.612.70.530.190.416.2]5 ms of subframe via upgrading the target signal at every 5 ms of subframe. The fixed codebook is a 17-bit algebraic codebook .
Fig. 1 Block Diagram of CS-ACELP Encoder [15]
III. PREPROCESSING
High pass filter serves as a precaution against undesired low-frequency or DC components. To reduce
the possibility of overflow in the fixed-point
implementation, the input values are divided by two .The filtered and scaled signal s(n),is used in t h r o u g h o u t a l l encoder operations.
IV. LPANALYSIS AND QUANTIZATION
LP analysis is performed once per speech frame using the autocorrelation method [15] with a 30 ms window. autocorrelation coefficients of windowed speech are computed and converted to LP coefficients using the Levinson–Durbin algorithm at every 10 ms(80 samples). LP coefficients are converted to line spectral frequencies (LSF) for quantization and interpolation procedure. These LSF coefficients are again converted back to LP coefficients to generate synthesis filter at decoder side.
The LP synthesis filter is defined as [15],
(1) where âi, i = 1,..., 10, are the (quantized) linear
prediction (LP) coefficient.
A. Windowing and Autocorrelation computation
The LP analysis window consists of two parts: the first part is half a Hamming window and the second part is a quarter of a cosine function cycle . The window is given by [5],
International Journal of Emerging Technology and Advanced Engineering
Website: www.ijetae.com (ISSN 2250-2459, Volume 2, Issue 5, May 2012)17
The autocorrelation coefficients are computed from the windowed speech as [15]
(3) The autocorrelation coefficients are used to obtain the LP filter coefficients, by using L e v i n s o n - d u r b i n Algorithm.
B. LP to LSP conversion
The LP filter coefficients ai, i = 0,...,10 are converted to
Line Spectral Pair (LSP) coefficients for quantization and interpolation purposes. For a 10th order LP filter, the LSP coefficients are defined as the roots of the sum and difference polynomials [15]:
(4) and
(5)
respectively. The polynomial F1’(Z) is symmetric, and
F2’(Z) is anti-symmetric [15]. It can be proven that all roots
of these polynomials are on the unit circle and they alternate each other. F1’(Z) has a root z = –1 (ω = ) and
F2’(Z) has a root z = 1 (w = 0). The coefficients ωi are the
line spectral frequencies (LSF) and they satisfy the ordering property 0 < ωi < ω2 < ... < ω10 < , and qi =
cos(ωi). The coefficients qi are referred to as the LSP
coefficients in the cosine domain.
C. Quantization of LSP coefficients
LP filter coefficients are converted to Line Spectrum Frequency (LSF) using chebyshev polynomials.The relation between these two representations is given by [15],
(6)
Where qi are LSP coefficients and i are LSF
coefficients.
Fourth-order MA predictor forms a good compromise
between performance and error propagation. The
difference between the computed and predicted
coefficients is quantized using a two-stage vector quantizer. The first stage is a 10-D VQ using codebook
with 128 entries (7 bit).
The second stage is a 10-bit VQ that has been implemented as a split VQ using two 5-D codebooks, and containing 32 entries (5 bit) each.
To explain quantization process, it is first convenient to describe decoding procedure. Each quantized value is obtained from the sum of two codewords [15],
(7) Where L1, L2 and L3 are codebook indices. Quantized LSF coefficients for current frame m are obtained from weighted sum of previous quantizer output and current quantizer output [15]
(8)
Where
p
ˆ
i,k are the coefficients of the switched MApredictor. Which MA predictor to use is defined by a separate bit L0 [15]. At start up the initial values of ˆ(k)
i l
are given by lˆi i/11 for all k < 0. For each of the two MA predictors the best approximation to the current LSF coefficients has to be found. The best approximation is defined as the one that minimizes the weighted mean-squared error [15]
(9) and the vector to be quantized for the current frame m is obtained from [15],
(10)
D. Interpolation of LSP coefficients
The quantized (and unquantized) LP coefficients are used for the second subframe [15]. For the first subframe, the quantized (and unquantized) LP coefficients are obtained by linear interpolation of the corresponding parameters in the adjacent sub-frames [15]. The interpolation is done on the LSF coefficients in the cosine domain rather than the frequency domain. Let current
i q
be the LSP coefficients computed for the current 10 ms frame, and previous
i
q the LSP coefficients computed in
International Journal of Emerging Technology and Advanced Engineering
Website: www.ijetae.com (ISSN 2250-2459, Volume 2, Issue 5, May 2012)18
The (unquantized) interpolated LSP coefficients in each of the two subframes are given by [15]:
(11)
The same interpolation procedure is used for the interpolation of the quantized LSP coefficients by
substituting qi by
q
ˆ
i in equation (10).E. LSP to LP conversion
Once the LSP coefficients are quantized and interpolated, they are converted back to the LP coefficients
ai.
F. Perceptual weighting
The perceptual weighting filter[15] is based on the quantized LP filter coefficients âi, and is given by:
(12) The values of γ1 and γ2 determine the frequency
response of the filter W(z) [15]. By proper adjustment of these variables it is possible to make the weighting more effective. This is done by making γ1 and γ2 a function of
the spectral shape of the input signal [15]. This adaptation is done once per 10 ms frame, but an interpolation procedure for each first subframe is used to smooth this adaptation process. The spectral shape is obtained from a 2nd order linear prediction filter, obtained as a by-product from the Levinson-Durbin recursion i.e. reflection coefficient. The reflection coefficients ki are converted to
Log Area Ratio (LAR) coefficients oi by [15]:
1,
2
0
1
0
1
i
k
.
k
.
log
o
i i
i
(13) The LAR coefficients corresponding to the current 10 ms frame are used for the second subframe. The LAR coefficients for the first subframe are obtained through linear interpolation with the LAR parameters from the previous frame. The interpolated LAR coefficients in each of the two subframes are given by [15]:
(14)
The spectral envelope is characterized as being either flat (flat = 1) or tilted (flat = 0) [15]. For each subframe this characterization is obtained by applying a threshold function to the LAR coefficients [15]. To avoid rapid changes, a hysteresis is used by taking into account the value of flat in the previous subframe m – 1 [15],
(15)
If the interpolated spectrum for a subframe is classified as flat (flat(m) = 1), the weight factors are set to γ1 = 0.94
and γ2 = 0.6 [15]. If the spectrum is classified as tilted
(
flat(m) = 0), the value of γ1 is set to 0.98, and the value ofγ2 is adapted to the strength of the resonances in the LP
synthesis filter, but is bounded between 0.4 and 0.7 [15]. If a strong resonance is present, the value of γ2 is set closer to
the upper bound [15]. This adaptation is achieved by a criterion based on the minimum distance between two successive LSP coefficients for the current subframe. The minimum distance is given by [15]:
1
1,...,9
min
i
d
min i i(16) The value of γ2 is computed using the linear relationship
given by[15]:
(17)
With fixed value of weight factor () in the range of 0.4 to 0.9 simplifies the combination of synthesis and weighting filters to
/ z Aˆ
z Aˆ z
W
International Journal of Emerging Technology and Advanced Engineering
Website: www.ijetae.com (ISSN 2250-2459, Volume 2, Issue 5, May 2012)19
The weighted speech signal (low-pass filtered) is used to compute the open-loop pitch estimate. The low-pass filtered weighted speech is found by filtering the speech signal s(n) through the filter
Â(z)/[Â(z/)(l – 0.7z–1)]. (19) First, the coefficients of the filter
A'(z) = Â(z/)(l–0.7z–1)
(20) are computed, then the low-pass filtered weighted speech in a subframe is computed by [15],
,
0,...,39
10
1
n
i
n
s
a
n
r
n
S
i w i
w
(21)
V. RESULT ANALYSIS
A. Subjective analysis
Here, in Subjective Analysis Mean Opinion Score rating is carried out for three different clean wave files chosen from wideband corpus [16] as given by rai0010.wav having total no. of samples equal to 73440, rai0008.wav having 82560 samples and rai0014.wav having 109921 samples. MOS analysis is carried out in quiet environment and with high quality headphones. For this analysis twenty un-trained listeners are chosen to participate in MOS rating. Out of which ten listeners are men and ten are women listeners. Each listener is offered with total of 6 decoded wave files( 3 wave files, each with two values of
) . Ratings given by all twenty listeners (for each wave files) are then averaged to produce final MOS ratings. As observed from figure 4, obtain results for MOS scores advocate the performance of developed coder for three wave files. It is evident from the results that MOS scores for all three recovered WB wave files decreases with the increase the value of weight factor() from 0.6 to 0.75.
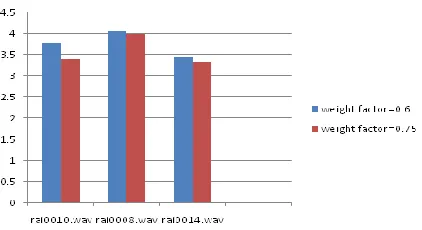
B. Objective Analysis
In this category of analysis, Perceptual Evaluation of Speech Quality (PESQ) has been evaluated as per [14]. As observed in figure 5, with increase in value of weight factor (), PESQ rating reduces for all three wave files.
Also it can be compared from figure 4 & 5 that obtained PESQ scores for all three wave files are quite comparable with respect to MOS ratings computed by listening tests.
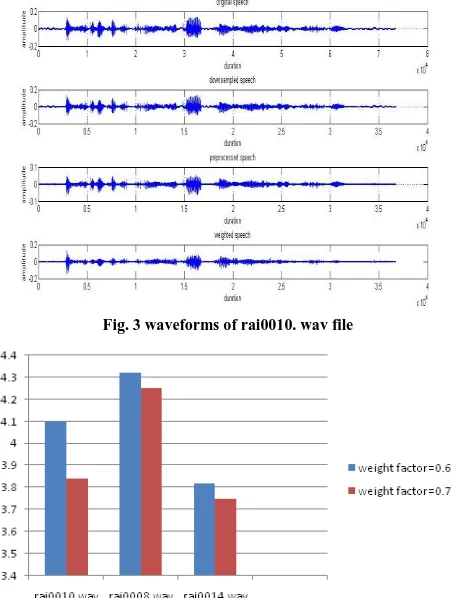
[image:5.612.341.550.135.315.2]1) input=‖rai0010.wav‖ [16] with weight factor ()=0.6
Fig. 2 waveforms of rai0010. wav file
[image:5.612.336.562.356.655.2]2)
input=‖rai0010.wav‖ [16] with weight factor ()=0.75Fig. 3 waveforms of rai0010. wav file
International Journal of Emerging Technology and Advanced Engineering
Website: www.ijetae.com (ISSN 2250-2459, Volume 2, Issue 5, May 2012) [image:6.612.71.282.134.249.2]20
Fig. 5 PESQ scores of different wave files for two different value of weight factors ()
VI.CONCLUSION
This research investigates the role of variation in weight factor for overall performance and recovered speech quality of CS-ACELP based G.729 coder. From the overall analysis conducted in this research (both Subjective and Objective), it is evident that with increase in value of weight factor in the ranges of 0.4 to 0.9, the weighting speech quality keeps on reducing. By selecting the lower bound value of weight factor produces good quality weighted speech. It is also witnessed from the research that overall complexity of implementation of given coder in the case of perceptual adaption of weight factor reduces by fixing the value of weight factor while omitting FLAT algorithm.
REFERENCES
[1] F. Itakura, ―Line spectrum representation of linear predictive coefficients,‖J. Acoust. Soc.Amer., vol. 57, Suppl. no. 1, p. S35, 1975.
[2] M. R. Schroeder, B. S. Atal, and J. L. Hall, ―Optimizing digital speech coders by exploiting masking properties of the human ear,‖ J. Acoust.Soc. Amer., vol. 66, pp. 1647–1652, 1979.
[3] M. R. Schroeder and B. S. Atal, ―Code-excited linear prediction (CELP): High quality speech at very low bit rates,‖ in Proc. IEEE Int. Conf. Acoustics, Speech, Signal Processing, Tampa, FL, 1985, pp. 937–940.
[4] J. D. Markel and A. H. Gray, Linear Prediction of Speech. New York: Springer-Verlag, 1976.D. Florencio, ―Investigating the use of asymmetric windows in CELP vocoders,‖ in Proc. ICASSP, Minneapolis, MN, 1993, pp. II427–II430.P. Kabal and R. P. Ramachandran, ―The computation of line-spectral frequencies using C hebyshev olynomials,‖ IEEE Trans. Acoust., Speech,Signal Processing, vol. ASSP-34, pp. 1419–1426, 1986.
[5] P. Kroon and B. S. Atal, ―On the use of pitch predictors with high temporal resolution,‖ IEEE Trans. Signal Processing, vol. 39,pp. 733–735,1991.
[6] J.H. Chen, R. V. Cox, Y.-C. Lin, N. Jayant, and M. J. Melchner, ―A low-delay CELP coder for the CCITT 16 kb/s speech coding standard,‖IEEE J. Select. Areas Commun., vol. 10 pp.830–849, 1992.
[7] A. Kataoka, T. Moriya, and S. Hayashi, ―An 8 kbit/s speech coder based on conjugate structure CELP,‖ in Proc. IEEE Int. Conf. Acoustics, Speech, Signal Processing, 1993, pp. II- 592–II-595. [8] ―Implementation and performance of an 8 kb/s conjugate structure
CELP speech coder,‖ in Proc. IEEE Int.Conf. Acoustics, Speech SignalProcessing, 1994, pp. II-93–II-96.
[9] R. Salami et al., ―Description of the proposed ITU-T 8 kb/s speech coding standard,‖ in Proc. IEEE Workshop on Speech Coding, 1995, pp. 3–4.
[10] D. Massaloux and S. Proust, ―Spectral shaping in the proposed ITU-T 8 kb/s speech coding standard,‖ in Proc. IEEE Workshop on Speech Coding, 1995, pp. 9–10.
[11] J. H. Chen and A. Gersho, ―Adaptive postfiltering for quality enhancement of coded speech ‖ IEEE Trans. Speech Audio Processing, vol. 3,pp. 59–71, 1995.
[12] R. Salami, C. Laflamme, B. Besette, and J. P. Adoul, ―ITU-T G.729 annex A: Reduced complexity 8 kb/s CS-ACELP codec for digital simultaneous voice and data,‖ IEEE Commun. Mag., vol. 35, pp. 56–63,Sept. 1997
[13] TIA/EIA,―TDMA—Cellular/PCS—Radio interface—Enhanced fullrate speech codec,‖ May 1996
[14] ITU-T 2000, ―Perceptual evaluation of speech quality (PESQ), and objective method for end-to-end speech quality assessment of narrowband telephone networks and speech codecs‖, ITU-T Rec. P. 862, 2001
[15] ITU-T Recommendation, G.729 (01/2007) ―coding of speech at 8 kbps using CS-ACELP‖
[16] http://www.repository.voxforge1.org/downloads/SpeechCorpus/Tru nk/Audio/Original/16kHz_16bit/
![Fig. 1 Block Diagram of CS-ACELP Encoder [15]](https://thumb-us.123doks.com/thumbv2/123dok_us/8736508.888738/2.612.70.530.190.416/fig-block-diagram-cs-acelp-encoder.webp)