http://dx.doi.org/10.4236/wjns.2014.42013
Neurocode-Tracking Based on Quantitative
Fast Dynamic EEG Recording in Combination
with Eye-Tracking
Wilfried Dimpfel1, Hans Carlos Hofmann2
1Justus-Liebig-University Giessen c/o NeuroCode AG, Wetzlar, Germany 2HCH System-Programmierung, Asslar-Berghausen, Germany
Email: [email protected], [email protected]
Received 28 February 2014; revised 30 March 2014; accepted 7 April 2014
Copyright © 2014 by authors and Scientific Research Publishing Inc.
This work is licensed under the Creative Commons Attribution International License (CC BY). http://creativecommons.org/licenses/by/4.0/
Abstract
Information processing within the brain relies on electro-chemical features. Electric events are accessible by recording of the EEG. These electric oscillations might be regarded as a neuronal code carrying information on important motor, cognitive and emotional events. A new approach of quantitative assessment of very short time epochs of 364 ms has been developed on the base of particularly defined frequency ranges and called “Neurocode-Tracking”. The new method was technically validated by the use of a signal generator and was found to correspond to classical quantitative EEG analysis except for some smudging during the transition from one frequency range to the next. Real data from a subject were obtained during relaxation and performance of three mental tasks. Data were time averaged for 180 s using the classical method and compared to data averaging during 16.4 s. Results were nearly identical with respect to spectral signatures showing the expected midline frontal theta increases during performance of three cognitive tests but not during relaxation. Collection of very short time epochs of 728 ms duration confirmed task dependent frontal theta increases, most prominent during calculation performance test (CPT), less during d2-concentration and memory test, none during relaxation. Finally, the new technique was combined with eye-tracking. Capture of the EEG mapping video of Neurocode-Tracking and synchronization with the gaze overlay video by starting recording with an audio signal (gong) al-lowed a match of gazes precisely with the corresponding electric events. Use of this technical com-bination in research will hopefully lead to a new understanding of spectral signatures of electric activity called enkephaloglyphs.
Keywords
1. Introduction
The electroencephalogram, discovered by the German physician Hans Berger, and published in 1931 [1], is re-corded in nearly every hospital of the world. However, interpretation of these electric signals of the brain has remained a major challenge. Subjective evaluation of the raw data is still the dominant method at least with re-spect to neurological ambulances and hospitals. The reason for this is the experience of neurologists, that only short epochs of the EEG in the range of 300 to 800 ms can be interpreted. Most popular ones are so-called “spike and wave” or “steep wave” features, which are very often observed in patients suffering from epilepsy. However, already in 1932 Dietsch and Berger [2] proposed to quantify the signals by frequency analysis in order to obtain objective information for interpretation of the raw signal. With coming up of computers in the 1960s mathematical calculation of the frequency spectra by using the Fast Fourier Transformation (FFT) has put re-searchers into the position to process larger amounts of data within reasonable time. However, a limitation with respect to time resolution consisted, because time epochs of two to four seconds of the raw signal were needed to calculate also the slow frequencies of the power spectrum. Thus, one was dealing with time-averaged infor-mation based on one epoch of two to four seconds in order to include also slow frequencies in the so-called delta range. This is too long, since a “steep wave” or a “spike and wave” as used within the frame of epilepsy diagno-sis only lasts about 300 to 400 milliseconds. Likewise the processing time of the brain in response to an auditory or visual stimulus also amounts to about 300 and 400 milliseconds as learned from evoked potential analysis, where signals are time-locked using a trigger for up to several minutes. The goal was therefore to develop a spe-cial method of quantitative frequency analysis (Neurocode-Tracking) covering very short time epochs of the raw signal lasting less than 400 milliseconds. We now report an entirely new approach of frequency analysis, which under certain preconditions with respect to frequency ranges describes the EEG continuously in steps of 364 milliseconds giving nearly 3 electric brain maps per second. This approach was named “Neurocode-Tracking”, since we believe that we are following the electric neuronal code by our quantitative analysis of brain electricity. Documentation of a single event by our mapping procedure has been called an “Enkephaloglyph” as published earlier [3].
2. Material and Methods
Data from one representative subject were chosen for this paper in order to show the practicability of the ap-proach. Complete study results will be published in separate. The subject was investigated by recording a 16 channel EEG (neo-CATEEM®; MEWICON CATEEM-Tec. GmbH, 4164 Schwarzenberg, Austria:
www.mewicon.at and www.cateem-tec.com) in combination with an eye tracking set up (Interactive Minds
GmbH, Dresden, Germany) using the NYAN2 software package. Basics of classical EEG recording have been described earlier [4]. For the new approach EEG frequency ranges to be analyzed had to be adjusted slightly to give the following exact ranges. Delta: 1.375 - 4.125 Hz; Theta: 4.125 - 6.875 Hz; Alpha1: 6.875 - 9.625 Hz; Alpha2: 9.625 - 12.375 Hz; Beta1: 12.375 - 17.875 Hz; Beta2: 17.875 - 34.375 Hz. This adjustment is a precon-dition for the new fast dynamic frequency analysis (Neurocode-Tracking) because under this conprecon-dition each frequency range from delta up to alpha2 only contains one frequency (middle frequency within the particular frequency band) [5]. Comparison of the classic analysis based on epochs of four seconds (due to frequency resolution of 0.25 Hz) to the new method based on epochs of 364 ms was obtained by testing stepwise all fre-quencies between 1 and 35 Hz using a signal generator (video available on YouTube: No9oGpwY).
For construction of electric maps spectral power was translated into spectral colors followed by additive color mixture to produce a map (RGB mode like used in TV). These maps are produced continuously online real time on the screen of a computer during recording of the EEG. Maps were constructed by calculation of % of the me-dian of power values of the different electrode positions for the corresponding frequency. The method has also been used to describe pathological changes of electric brain activity in dementia [6].
Neurocode-Tracking was performed during performance of a concentration test (so-called d2-test according to literature), a difficult calculation performance test (CPT) and a memory test. Details are described in an ear-lier publication [7]. Data were compared with respect to different moving time windows of 180 s for the classic method and 16.4 s for the new dynamic method. Time lines were constructed using a moving average time win-dow of 728 ms.
the eye-tracker software running on a separate computer. It is called a “gaze overlay” movie depicting the pre-sented picture, task or video film. In this gaze overlay video the momentary gaze of the subject is documented by a colored spot. Since the presentation always starts with an audio signal (gong) and this audio signal also is registered by screen capture of the EEG computer, it is used for synchronization of both videos by means of a video cut software (Adobe Premiere Pro). Due to the processing time of the brain (300 to 400 ms) plus that of the computer (depends individually on the type and number of active processors!) the gaze overlay video is shifted in our case (quad core, 3.4 Giga Hz) for one second in order to obtain synchronized images between gaze and the particular EEG epoch of 364 ms. For detailed offline documentation a movie was exported and analyzed image by image. Single images containing the gaze and corresponding EEG map (called an “Enkephaloglyph”) [3]) were cut from the screen by a software tool available on all computers.
This manuscript is restricted to the introduction and technical validation of the methodology including an example of the combination of “Neurocode-Tracking” (following EEG based patterns of spectral signatures) with Eye-tracking.
3. Results
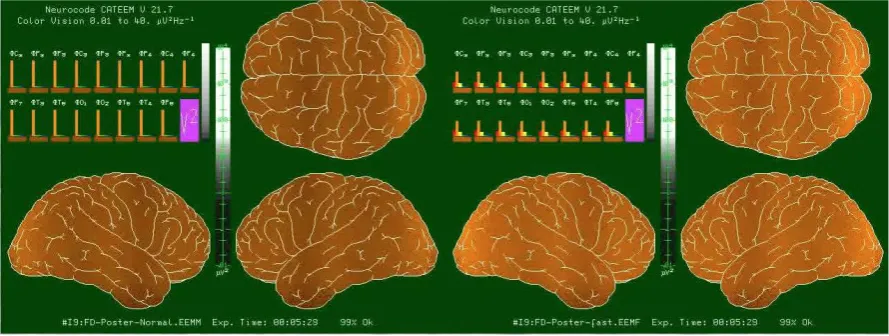
In order to control for potential differences between the new fast dynamic analysis based on epochs of 364 ms in comparison to the classic analysis based on four second epochs, single frequencies were fed into the analysis software. Pictures were cut from a video taken during moving signal administration (16 Hz/min) covering all frequencies between 0 and 35 Hz as mentioned above. Using the classic approach very sharp transitions from one to the next frequency band were documented. Using the new approach identical maps and power density distributions were seen in the middle of a frequency band. A representative comparison between the classic and the new approach with respect to theta frequencies is given in Figure 1. Results are given for each of the 17 electrode positions (vertical bars). The resulting maps are virtually identical. However, transitions between these specially defined frequency ranges turned out to be somewhat smudged (Figure2). This means, that two adja-cent frequency peaks in the new analysis might derive from a broader transition from one to the next frequency range. But according to extensive data mining this seems to occur seldom. Due to the spectral colors used, delta waves produce red bars, theta waves produce orange, alpha1 waves yellow, alpha2 waves green, beta1 waves turquoise and beta2 waves blue bars.
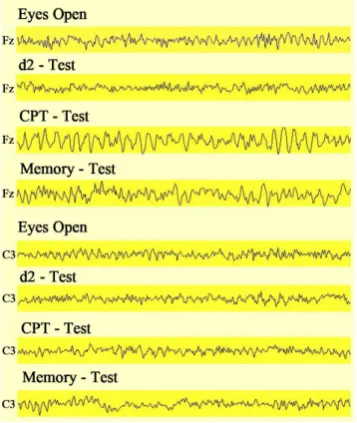
Next step of validation of this approach was accomplished by processing data from a male subject under dif-ferent recording conditions. EEG recording was performed during relaxed state with eyes open, during per-formance of a d2-concentration test, a mathematical calculation task and a memory task. Each period lasted for 5 minutes. Examples of the raw EEG are documented for two electrode positions (Fz and C3) in Figure3. As one can see from these raw data, electric oscillations differ clearly with respect to the recording condition, but dif-ferences are very difficult to describe.
[image:3.595.91.536.515.683.2]Figure 2. Comparison of new fast dynamic analysis (epochs of 364 ms dura-tion) with classical analysis (4 s duradura-tion) with respect to transitions from one frequency range to the next one. Please note smudging of the analysis of short epochs and sharp transitions with classical analysis. Frequency ranges are de-picted as colored bars: red: delta, orange: theta, yellow: alpha1, green: alpha2, turquoise: beta1, blue: beta2.
Figure 3. Documentation of EEG raw signal dur-ing relaxation (eyes open) and performance of 3 mental tests (d2-concentration, calculation per-formance test (CPT) and a memory test) for elec-trode positions Fz (upper part of image) and C3
(lower part of image) of subject DS1.
[image:4.595.210.389.367.579.2]rocode-Tracking). Comparing the pattern of spectral frequencies at each electrode position one can see a great similarity. Especially, frontal midline theta power (at electrode position Fz), which emerged during mental work to a different degree, can be regarded as a robust indicator of congruence. As one can see also from these aver-aged data, mainly frontal areas (electrode positions F7 and F8) produced relative higher delta and beta2 power in comparison to all other regions. Thus, the fast dynamic approach of quantitative EEG data processing leads to nearly identical results when compared with the classical analysis, but allows for analysis of short epochs of 364 ms.
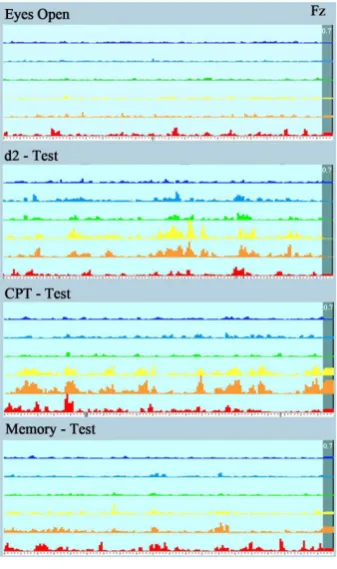
After having proven the validity of the fast dynamic EEG analysis by technical and real life signals a closer look was taken at the newly visible short time epochs provided by the fast dynamic approach of Neurocode- Tracking. Since one cannot recognize from time-averaged data, which frequency did change at what time, fur-ther analysis was undertaken with single epochs of 728 ms duration as so-called moving window calculated every 364 ms. Time lines of single oscillations for the electrode position Fz are given for the different recording conditions in Figure5 with respect to all six frequency ranges. As became obvious from the analysis with this high time resolution, oscillations differ considerably with respect for example to frontal midline theta power
[image:6.595.215.384.266.551.2]under the four different recording conditions: relaxed state (eyes open), concentration d2-test, calculation per- formance test (CPT) and memory test. Largest oscillations were observed during the calculation performance test CPT.
Surprisingly, spectral power values of single epochs in the theta band reached up to 1500% of the median during the calculation test, whereas during the relaxed state of the subject hardly theta power emerges at this re-gion of the brain within a time period of 1 minute.
The question now arose if we could find spectral patterns on the base of 728 ms lasting epochs, which might relate to and could explain the averaged data.
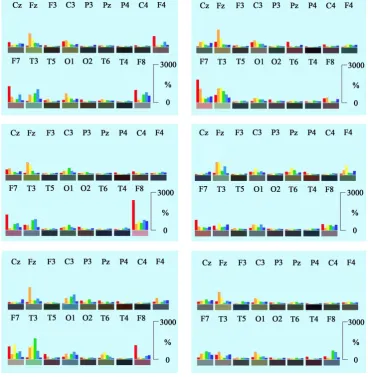
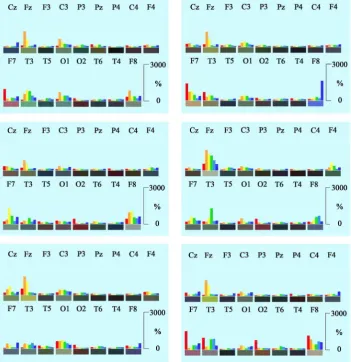
Using the new approach of Neurocode-Tracking as described above, very heterogeneous variable short-term enkephaloglyphs were obtained during the relaxed state with open eyes. A collection is shown in Figure6. The brain produces extremely high focal spectral power in one or several brain regions as one can see from these images. Please note that the scaling on the ordinate of these pictures is threefold higher (up to 3000%!) than in the averaged data presented in Figure4. Single spectral signatures show increases of delta and beta power at left
Figure 6. Collection of regional distributions of spectral frequencies during relaxation (eyes open)
based on single epochs of 728 ms duration. Frequency ranges are depicted as colored bars: red: delta, orange: theta, yellow: alpha1, green: alpha2, turquoise: beta1, blue: beta2. Electrode positions are la-beled according to the 10/20-system. Please note that scaling on the ordinate is threefold higher than in
[image:7.595.111.487.259.645.2]frontal positions and some mixed increases at positions O1 and C3. In general, single spectral signatures of 728 ms duration were contained in the averaged data presented in Figure4. The comparison reveals that mostly those brain regions (electrode positions) changed during short time epoch analysis, which dominated in the av-eraged data. However, not all brain regions were afflicted at the same time! The serial analysis of the short epochs revealed that only three to four areas showed spectral frequency changes at a time. Thus, data show se-rial processing of electric brain activity in steps of 364 ms for 728 ms lasting time epochs.
Single spectral signatures look different in the presence of performance of the d2-concentration test. Under this mental work condition moderate increases of frontal midline theta power (at position Fz) are observed in many epochs, which were lacking during the relaxed state. In many cases they were accompanied by some al-pha1 power increases. A collection of spectral power distributions (epoch duration of 728 ms) is shown in Fig-ure7. This has also been visible in the time line of one minute showing single epochs, which has been shown in
Figure5. Bursts of theta power increases (orange) were mostly accompanied by bursts in alpha1 power (yellow). Remarkable are also bursts of beta1 spectral power (turquoise) during the performance of the d2-test, which are not present to such a degree during the other recording conditions (Figure5).
[image:8.595.114.483.268.646.2]These short increases of theta power were even more pronounced during the performance of the calculation performance test. As observed during the d2-test they were often accompanied by increases in the alpha1 range. In some examples also increases of delta power were observed at the same time at electrode position F7 or F8. A collection of examples of single spectral signatures is documented in Figure 8.
During performance of the memory test again spectral theta increases were seen during the short-term epochs of 728 ms duration at electrode position Fz. At the same time various other regions showed increases of delta or beta2 spectral power. One example showed frontal alpha1 increases at F7 and F8. A collection of examples of these spectral signatures is depicted in Figure 9.
After technical validation of the hard- and software, data from one subject, who underwent quantitative EEG recording in combination with eye tracking, were analyzed image by image with respect to diverse film scener-ies and during performance of mental work. Because of the vast amount of data collected during this pilot trial only one example is given below to demonstrate the practicability and usability of this new approach. Group data will be published separately.
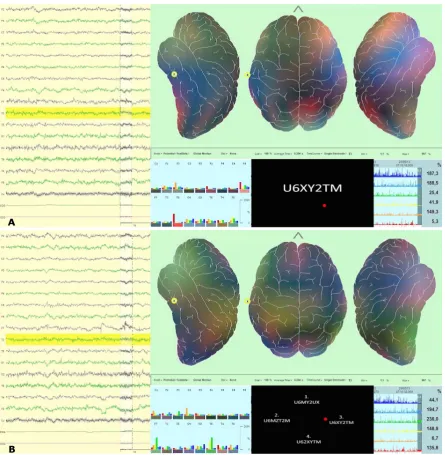
[image:9.595.124.476.277.640.2]Data obtained by the combination of Neurocode-Tracking and Eye Tracking show a frontal increase of theta during the encoding phase and increases of frontal and temporal alpha2 during the retrieval and decision phase
Figure 9.Collection of regional distributions of spectral frequencies during performance of the mem-ory test based on single epochs of 728 ms duration. Frequency ranges are depicted as colored bars: red: delta, orange: theta, yellow: alpha1, green: alpha2, turquoise: beta1, blue: beta2. Electrode positions are labeled according to the 10/20-system. Please note that scaling on the ordinate is threefold higher than in Figure 4. Range of the ordinate for each frequency is from 1% to 3000%. Frequencies are nor- malized for regional distribution (% of the median of power values of the different electrode positions for the corresponding frequency).
of the memory test. In this case, time epochs of 364 ms duration are displayed. Screenshots were taken after combination of the gaze overlay video and the EEG capture (Figure 10).
4. Discussion
Figure 10. (A) and (B) The red spot in the gaze overlay video (between bar graph and time line in the lower middle part of the image) represents the momentary gaze of the subject. Single electric event of 364 ms duration at encoding phase (A) and at decision making (B) is documented during performance of the memory test. The horizontally yellow marked area of the EEG raw signal (left part of the lower image) represents the focal area (electrode position T3) that is tagged in the map and also gives the time line of frequency changes depicted in the lower right side of the picture. Here global median per-centages for each frequency are given for this yellow marked brain region (in this case the electrode position T3). Numbers in the right lower corner document the % median value of actual spectral power for the previous epoch of 364 ms length.
kephaloglyph” [3]. It represents the momentary (single time epoch) or time averaged focal electric activity of the human brain in the presence of different physiological states (relaxed with eyes open, relaxed with eyes closed, during sleep phases and during cognitive and emotional challenges).
quan-titative analysis displays epochs of 364 ms duration continuously and thus can be grabbed by screen capturing software. This puts us into the position to synchronize quantitative EEG data with gaze overlay videos based on eye tracking using a common auditory signal (gong) for synchronization. The results from this combination re-late electric events of the brain to single gazes. Maps—as constructed by using transformation of electric power into spectral colors—are as heterogeneous as one would expect them to be if they were related to activation of different electric circuits. Activation of particular electric circuits might reflect single behavioral events. We now face the problem of interpretation of these very short-term electric brain activities.
One approach consists in using the type of investigation we now started with. Comparison of enkepha- loglyphs induced during different experimental conditions and search for similar brain maps during cognitive and/or emotional challenges. This line is undertaken currently within a second project. The other possibility is to see if time averaged FFT data give hints on the interpretation. In earlier experiments it was shown that quantita-tive EEG data obtained during mental work (5 minutes average) revealed strong transient increases of frontal delta and theta power [8], which could not be produced by demented patients [9] [10]. These early publications related mental work to activities of the frontal brain. This conclusion was also confirmed by functional NMRI studies showing higher blood flow in frontal brain areas during comparable experimental situations. However, the EEG contains much more detailed information, since it represents directly the information processing within the cortex. Here, spectral analysis of the electric activity reveals that mainly delta and theta waves obviously are closely related to performance of mental work. For example, it was reported that oscillatory brain dynamics in the theta frequency range are functionally related to the retrieval of lexical semantic information [11]. Especially, frontal midline theta waves have been related to mental activity [12]. Likewise, theta oscillations during a working memory task were described earlier [13] and brought up evidence for local generators. This was con- firmed now on an individual base by averaging data for 3 minutes during performance of three different mental tests.
According to a recent review [14] the question is still open if frontal midline theta (FMT) is associated to memory or reflects a more general feature of mental work. Our results favor the hypothesis that FMT reflect fo- cused attention since frontal midline theta oscillations hardly occur during relaxation, are frequently observed during the d2-concentration test and are most prominent during the calculation performance test. They are not so much pronounced during performance of the memory test. Preclinical data based on the administration of drugs interacting with the biochemically defined norepinephrine alpha2 receptor revealed that the result of this phar- macological intervention consisted in dominant changes of spectral theta power [15]. If these data can be trans- lated to humans, changing levels of norepinephrine might account for these short-term increases of theta power. On the other side, norepinephrine is known to modulate the signal-to-noise ratio in information processing [16]. Thus, one might speculate that MFT is more related to focused attention than to a memory process. Our data are quite in line with this idea as mentioned above. Earlier work performed in infants and analyzing the 5 - 6 Hz theta band proposed a concept of a “diffuse theta response system” that is active during expectancy and focused attention [17]. This supports our view on the interpretation of frontal theta oscillations to be related to attention.
In addition to theta waves also alpha2 waves (sometimes called upper alpha) have been related to mental work [18]-[20]. Changes of alpha2 waves during performance of mental work were also reported by Jensen [21]. Ac- cording to our experience alpha2 waves dominate in the temporal lobe, mainly at the electrode position T3 and T6 during memory processes. Regarding the relationship between theta and upper alpha it was stated that theta reflects central executive functions whereas upper alpha may be important for the reactivation of long-term memory codes in short-term memory [22]. Increases of spectral beta power as observed during some conditions in our data were for example reported during the cognitive process of optic problem solving [23].
earlier and our data are the first to show quantitation of such short time epochs of electric activity. Obviously, the momentary electric activity of the brain is much more complex than thought earlier. For sure it will take some time to decode these short-term pieces of information representing the “language” of the brain. The com- bination of EEG analysis with eyetracking might help to understand this activity in a better way than describing electric activity alone. It will depend on highly sophisticated designs of experiments to relate these enkepha- loglyphs to single behavioral events. At least the new approach-based now on commercially available software- will lead to a new understanding of brain function.
Conflict of Interest
There was no conflict of interest.Acknowledgements
Mrs. Leonie Schombert and Mrs. Petra Werling are acknowledged for performing and documenting the experi-ments. Mrs. Ingrid Keplinger-Dimpfel is acknowledged for performance of the logistics of the experiments and quality control.
References
[1] Berger, H. (1931) Über das Elektroenzephalogramm des Menschen. Dritte Mitteilung. Archiv für Psychiatrie und Nervenkrankheiten, 94, 16-60. http://dx.doi.org/10.1007/BF01835097
[2] Dietsch, G. and Berger, H. (1932) Fourier Analyse von Elektroenzephalogrammen des Menschen. Pflüger's Archiv für die gesamte Physiologie des Menschen und der Tiere, 230, 106-112. http://dx.doi.org/10.1007/BF01751972
[3] Dimpfel, W. (2011) Enkephaloglyphen. Spektrale Signaturen der elektrischen Hirntätigkeit als Spiegel der Psyche. BoD Verlag, Norderstedt.
[4] Schober, F., Schellenberg, R. and Dimpfel, W. (1994) Neue Wege zur Beurteilung der mentalen Leistungsfähigkeit mittels simultaner topographischer Elektroenzephalometrie und Psychometrie in der Pharmakologie. Arzneimittelfor- schung/Drug Research, 44, 1285-1295.
[5] Dimpfel, W. (2011) Simultaneous Eye Tracking and Fast Dynamic EEG Current Source Density Imaging for Assess- ment of Commercials or Websites. 6th European Conference on Eye Movements ECM 2011, Marseille.
[6] Schellenberg, R., Todorova, A., Dimpfel, W. and Schober, F. (1995) Pathophysiology and Psychopharmacology of Dementia—A New Study Design. Pharmacopsychiatry, 32, 81-97.
[7] Dimpfel, W., Koch, K. and Weiss, G. (2011) Early Effect of NEURAPAS® Balance on Current Source Density (CSD) of Human EEG. BMC Psychiatry, 11, 123-138. http://dx.doi.org/10.1186/1471-244X-11-123
[8] Schober, F., Schellenberg, R. and Dimpfel, W. (1995) Reflection of Mental Exercise in the Dynamic Quantitative Topographical EEG. Neuropsychobiology, 31, 98-112. http://dx.doi.org/10.1159/000119179
[9] Schellenberg, R., Todorova, A., Hofmann, H.C., Dimpfel, W. and Schober, F. (1995) Differentiation of Demented Pa-tients and Healthy Subjects by Means of Quantitative-Topological EEG—A Classification Approach. Alzheimer’s Re-search, 1, 23-28.
[10] Schellenberg, R., Todorova, A., Wedekind, W., Schober, F. and Dimpfel, W. (1997) Pathophysiology and Psychophar- macology of Dementia—A New Study Design. 2. Cyclandelate Treatment—A Placebo-Controlled Double-Blind Clinical Trial. Neuropsychobiology, 35, 132-142. http://dx.doi.org/10.1159/000119334
[11] Bastiaansen, M.C., Oostenfeld, R., Jensen, O. and Hagoort, P. (2008) I See What You Mean: Theta Power Increases Are Involved in the Retrieval of Lexical Semantic Information. Brain and Language, 106, 15-28.
http://dx.doi.org/10.1016/j.bandl.2007.10.006
[12] Inanaga, K. (1998) Frontal Midline Theta Rhythm and Mental Activity. Psychiatry and Clinical Neurosciences, 52, 555-566. http://dx.doi.org/10.1046/j.1440-1819.1998.00452.x
[13] Raghavachari, S., Lisman, J.E., Tully, M., Madsen, J.R. and Bromfield, E.B. (2006) Theta Oscillations in Human Cor-tex during a Working Memory Task: Evidence for Local Generators. Journal of Neurophysiology, 95, 1630-1638. http://dx.doi.org/10.1152/jn.00409.2005
[16] Aston-Jones, G. (1985) Behavioral Functions of Locus Coeruleus Derived from Cellular Attributes. Physiological Psychology, 13, 118-126. http://dx.doi.org/10.3758/BF03326513
[17] Stroganova, T.A., Orekhova, E.V. and Posikera, I.N. (1998) Externally and Internally Controlled Attention in Infants: An EEG Study. International Journal of Psychophysiology, 30, 339-351.
http://dx.doi.org/10.1016/S0167-8760(98)00026-9
[18] Klimesch, W. (1999) EEG Alpha and Theta Oscillations Reflect Cognitive and Memory Performance: A Review and Analysis. Brain Research Reviews, 29, 169-195. http://dx.doi.org/10.1016/S0165-0173(98)00056-3
[19] Klimesch, W., Schack, B. and Sauseng, P. (2005) The Functional Significance of Theta and Upper Alpha Oscillations.
Experimental Psychology, 52, 99-108. http://dx.doi.org/10.1027/1618-3169.52.2.99
[20] Klimesch, W., Doppelmayr, M. and Hanslmayr, S. (2006) Upper Alpha ERD and Absolute Power: Their Meaning for Memory Performance. Progress in Brain Research, 159, 151-165. http://dx.doi.org/10.1016/S0079-6123(06)59010-7 [21] Jensen, O., Gelfand, J., Kounios, J. and Lisman, J.E. (2002) Oscillations in the Alpha Band (9 - 12Hz) Increase with
Memory Load during Retention in a Short-Term Memory Task. Cerebral Cortex, 12, 877-882. http://dx.doi.org/10.1093/cercor/12.8.877
[22] Schack, B., Klimesch, W. and Sauseng, P. (2005) Phase Synchronization between Theta and Upper Alpha Oscillations in a Working Memory Task. International Journal of Psychophysiology, 57, 105-114.
http://dx.doi.org/10.1016/j.ijpsycho.2005.03.016