DWPPT: Data Warehouse Performance Prediction Tool
Madhu Bhan
M.S.Ramaiah Institute of Technology Bangalore-54 IndiaK. Rajanikanth
Visvesvaraya Technological. University, Belgaum IndiaD E Geetha
M.S.Ramaiah Institute of Technology Bangalore-54 India
T.V.S Kumar
M.S.Ramaiah Institute of Technology Bangalore-54 IndiaABSTRACT
The increasing demands for interactive response time from the users makes query performance one of the central problems of Data warehouse systems today. Performance is an important quality aspect of Data warehouse systems. Predicting the performance of Data warehouse systems during early design stages of their development is significant. Software Performance Engineering(SPE) promotes the idea that the integration of performance analysis into the software development process, from the earliest stages to the end, can ensure that the system will meet its performance objectives. This paper describes the features and use of a prototype tool, DWPPT(Data Warehouse Performance Prediction Tool) which is designed to analyze the performance of the Data warehouse in different environmental conditions. The tool supports SPE process for Data warehouse systems. The tool is useful for Data warehouse managers in identifying critical components, diagnosing problems and hence optimizing the overall design. Our objective is to investigate the impact of Data warehouse design factors on OLAP performance for different user populations and hardware configurations. An analytical and simulation modeling approach is used for the tool to predict performance of Data warehouse systems.
Keywords
Software Performance Engineering, Data warehouse, On line Analytical Processing, Simulation.
1.
INTRODUCTION
The behavior of Data warehouse is often unpredictable as the workloads very often cannot be predicted until finally the system is built for the first time and the data is in a production status[1]. As the system goes production for the first time only then may a system administrator discover there are performance problems. Unfortunately many of the decisions made in the building of a Data warehouse are made in ignorance of the performance characteristics of the Data warehouse hardware and software environments. This has resulted in massive differences in expectations between system users and system designers and administrators. The developers of such systems should be able to access and understand performance effects of various design decisions at early stages of development when changes are easy and less expensive. Software Performance Engineering, introduced by Smith in 1990 is a technique that proposes to use quantitative methods and performance models in order to assess the performance effects of different design and implementation alternatives during the development of a system [2],[3]. Predictive Performance models allowthe timely evaluation of performance impact of many different application workloads and alternative configurations. It is important to provide support for early assessment of performance
characteristics of Data warehouse systems. Many processes that can be automated become cost-effective by consuming less hand effort, and consequently less money. If software performance models were to be generated automatically, the designers would not find it difficult to employ them in software development cycle, thus bridging the gap between software development and software performance domains.
2.
RELATED WORK
SPE is important for software engineering and in particular for software quality. Two models satisfy the modeling requirements of software performance engineering approach: Software execution model and System execution model. Predictive Performance modeling environment that enables performance measures for distributed systems is described in[4],[5]. [6] describes the use of SPE-ED, a performance modeling tool that supports SPE process, for early lifecycle performance evaluation of object oriented systems. QUEST, a performance tool that integrates performance evaluation with the SDL method is described in [7]. One more automated tool HIT, for model based performance evaluation of computing systems during all phase of their life cycle is described in [8]. In [9] an approach for performance evaluation of software systems following the layered architecture has been proposed. This approach initially models the system as a Discrete Time Markov Chain and extracts parameters for constructing a closed product from queuing Network model solved using the SHARPE software package. SMTQA is a process-oriented simulation tool, developed for the performance evaluation of software that follows multi-tier architecture [10]. In this paper the features and use of a prototype tool, DWPPT that solves the software execution model and the system execution model to obtain different performance metrics, is discussed.
3.
DWPPT OVERVIEW
3.1. Focus
The tool focuses on evaluation of performance of Data warehouse systems. It is developed to address the following issues in the Data warehouse environment.
1. Simulate the web based Data warehouse architecture with open workload.
2. Consider the Software size, data size and software specification for the simulation process of Data warehouse architecture.
3. Obtain the performance metrics such as server utilization, average response time, average waiting time, average server utilization.
DWPPT produces analytical results for the Software models and an approximate analytic solution of the generated system execution model. The estimated size of the software, the data size which needs to be accessed for various query classes and the hardware resource data is used as the input to the tool. The model is solved and the resulting performance metrics; resource utilization, average response time, average waiting time is obtained. The graphs are generated for the performance metrics against arrival rate of queries. The results are obtained for both Software execution and System execution model.
4. CASE STUDY
To illustrate the use of DWPPT for modeling and evaluating performance of Data warehouse systems a case study based on TPC-H Benchmark [11] is presented. The TPC-H database consists of eight tables. The data set that is used in our experiment is the TPC-H database of size 1GB. TPC-H benchmark workload consists of the execution of twenty-two read only queries. Wasserman et al., after analyzing the TPC-H queries run on DB2 UDB, grouped them into four classes based on their processing time, I/O and n-way table joins characteristics as described by [12].
4.1 Data warehouse Architecture
The Data warehouse architecture based on web which has four levels is given in [13]. The first is client, which provides users functions and convenient browsing of data stored in the Data warehouse. At this level Client application is connected to the web server through the internet; Web Server is the second level, which is the interface between the client and the OLAP server and involves input and output of information
finishes analysis operations and returns the results back to web server, which in turn forwards the results to the clients.
5. Client supports various OLAP operations in order to analyze the data.
5. APPLICATION OF TOOL
5.1 Software Execution Model
The data required for constructing and parameterzing a software model includes Workload specifications, Software execution structure, execution environment and Hardware
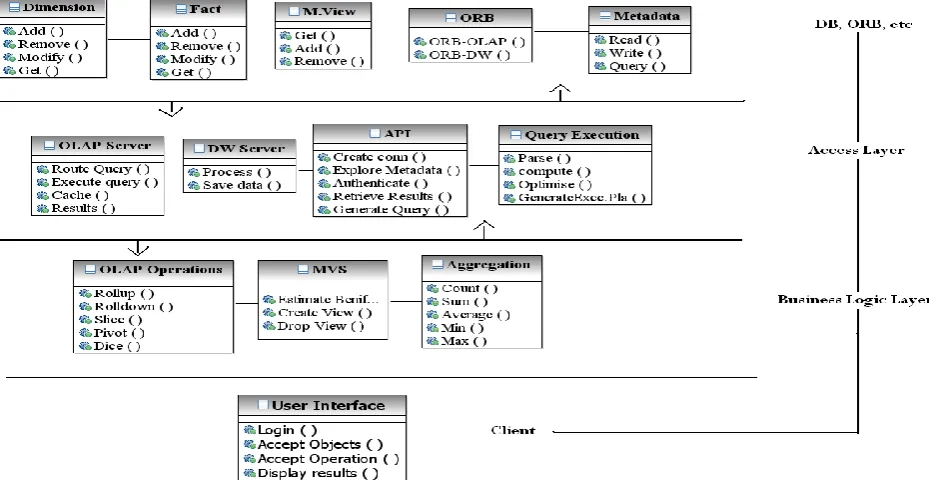
resource requirements. Software execution models are constructed for typical workload scenarios which specify the operations to be executed in response to predefined events. The layers considered for the model are Client, Web server, OLAP server and Data warehouse server. The sequence diagram in Figure 2 represents the most frequent interactions of the user with the Data warehouse system. The architecture and the sequence diagram given in Figure1 and Figure2 is considered for software execution environment and software execution structure respectively. The hardware resource requirements are the time needed for computer resources to access Mainframe Database (Data warehouse), OLAP server etc. The software size is estimated based on Class-point and Class-method approach [14]. The UML Class diagram in Figure 3 shows the statistical structural behavior of the OLAP system, in which operations are designed for the complete system. The class diagram has persistent classes like Dimensions, Facts, Views and control classes like ORB, API, Aggregations, and OLAP operations. These classes are related to each other through associations. Source lines of code and function points are the most often used size measurements.
Figure 2: Sequence Diagram
In a UML project, the appropriate scope metric is either the number of use-case scenarios or the number of objects. Although estimating size using user scenarios is a valuable approach for early phases of a project, once an object design nears completion this object design may be used to update and improve the estimate. It has been found by many organizations building sophisticated systems with UML based iterative processes estimating and measuring classes or objects per iteration is a natural fit. There are five scope inputs for the class-method approach to estimating [15].
These are:
1. The number of Control classes
2. The number of Interface classes
3. The number of other classes
4. The total number of Methods (member functions) within all classes combined
5. The total number of Tables.
[image:3.595.65.530.488.728.2]performance studies start with the environmental factors that have the greatest effect on the software’s own performance such as
The speed of the CPU(processing rate for machine instructions and for higher-level-language instructions
The speed of I/O devices The configuration of memory
Example: Sample Data warehouse Execution environment
CPU speed-1MIPS
I/O Devices-40960KB/sec to 51200 KB/sec Internet spped-2048 KB/sec
LAN Speed-750KB/sec Page size-256KB
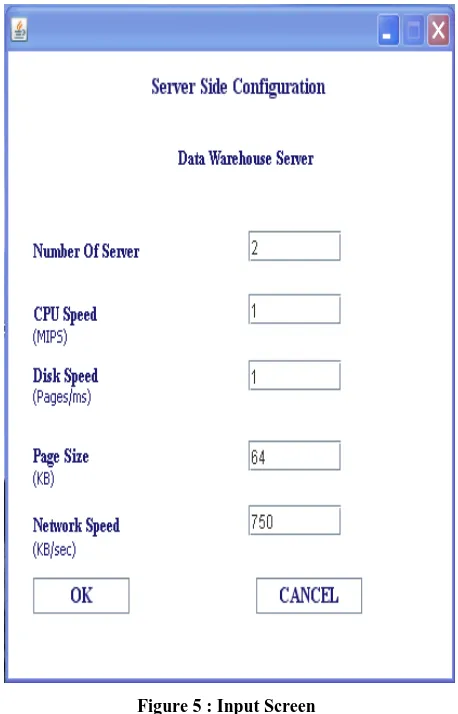
The values to solve the execution model have been taken from example which is typical of hardware/software configuration used in Data warehouse environment. Figure 4 and Figure 5
[image:4.595.315.544.107.464.2]Figure 4: Input Screen
Figure 5 : Input Screen
[image:4.595.55.288.454.724.2]
Figure 6: Input/output Screen
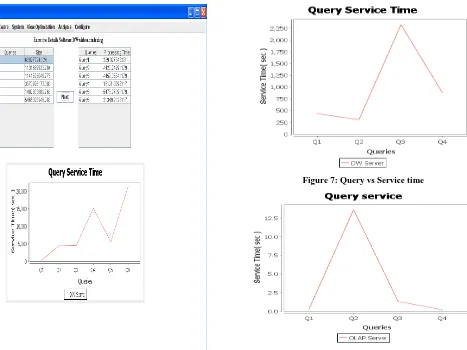
Figure 7: Query vs Service time
[image:5.595.56.287.69.417.2]Figure 8 : Query vs Service time
Table 1. Resource Requirement
Client CPU
Net 1 Web
server CPU
Net 2 OLAP
CPU
OLAP Disk
LAN DW
CPU
DW Disk
Get Query
.0029 .0004
0.0
.0004
-
-
-
-
-
Execute Query
-
-
-
-
.0194
-
.0013 .0118
2.56
Send results
.0030 .0004
0.0
.0004
.0050
-
.0013
-
-
The graph in Figure 7 shows the processing time for the four classes of queries when the queries are run from Data warehouse. The graph in Figure 8 shows the processing time for the four classes of queries when the queries are run from OLAP.
5.2 System Execution Model
The system execution model solution is obtained by solving
queuing network model. System execution models represent the key hardware devices with queue servers. A queuing network model is constructed based on the execution environment of software components and the workload. The estimated size of the software and the data size which needs to
be accessed for various query classes is used in the simulation model as the representative workload. The model is solved and the resulting performance metrics like response time, service time, server utilization, etc. are obtained. For discussion purpose, the governing performance metrics such as arrival rate, system response time server utilization and waiting time, are considered
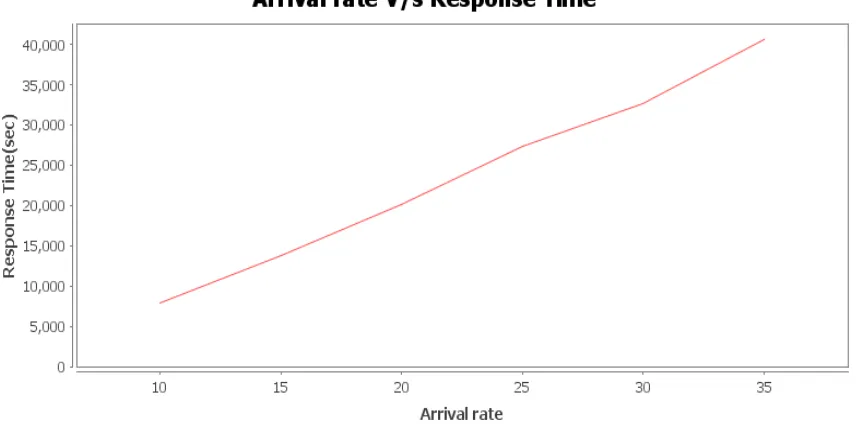
[image:5.595.311.535.71.413.2]Figure 9 : Arrival time vs Response time
Figure 9 shows the behaviour of response time with respect to arrival rate of queries when the queries are run from Data warehouse. The response time shows a linear behavior.
[image:6.595.81.516.373.746.2]Figure 10 shows the server utilizaton when the queries are run from Data warehouse server. Increasing arrival rate increases server utilization till it reaches a specific value and then it remains almost constant.
Figure 10 : Arrival rate vs Sever Utilization
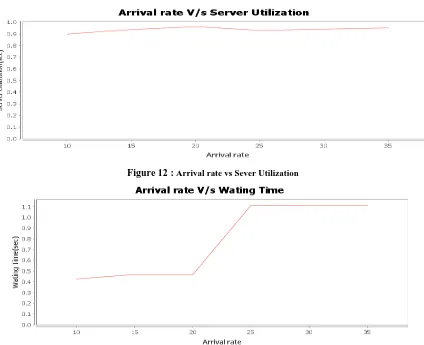
Figure 12 : Arrival rate vs Sever Utilization
Figure 13: Arrival rate vs Waiting time
Figure 11, and 12 shows the response time and Server utilization when most of the results are available in OLAP server for a given workload(queries). Figure 13 shows how the waiting time increases with respect to increasing arrival rates of the queries.
6. CONCLUSION
The features of a prototype tool, DWPPT and its application are illustrated with a case study of TPC-H Benchmark. The results are obtained and reports are provided in the form of graphs. The hardware resource like Data warehouse disk access time is identified as bottleneck resource because of large volumes of data that need to be accessed. This is optimized by having a three-tier architecture where most of the query results are present in the OLAP server. The future development is automating the tool for any distributed system.
7. REFERENCES
[1] Andrew Holdsworth. “ Data Wareho,use Performance Management Techniques”. White paper , Oracle Services Advanced Technologies Data Warehouse,1997.
[2] C.U Smith, Performance Engineering of Software Systems.Addison Wesley,1990.
[3] C.U Smith and L.G Williams, Performance Solutions :A practical Guide to creating Responsive, Scalable Software .Addison Wesley ,2002.
[4] Kahkipuro P, ”UML–Based Performance Modeling Framework for Component Based Distributed Systems” in R.Dumke et al.(Eds): Performance Engineering,LNCS 2047,Springer,pp167-184,2001
[5] Peter Utton and Gino Martin,David Akehurst and Gill Waters, ”Performance Analysis of Object–oriented Designs for Distributed systems” ,Technical Report , University of Kent at Canterbury,1999.
[6] Connie.U.Smith and Lioyd G.Williams,”Performance Engineering Evaluation of Object Oriented Systems with SPE-ED, in LNCS 1997,PP 135-153.
[7] Marc Diefenbruch,Jorg Hintelmann,Axel Hirche and Bruno Muller-Clostermann,”QUEST User Manual”,VERSION 1.3 June 1999 .
[8] HIT and HI-SLANG,An Introduction”, Version 3.1.000.
[9] Vibhu Saujanya Sharma,Pankaj Jalote,Kishore S.Trivedi”Evaluating Performance Attributes of Layered Software Architecture”, CBSE 2005, LNCS 3489,Springer-Verlag.
[10] D.E Geetha, T.V. Suresh Kumar, P. Mayank, K.Rajanikanth, (2010) “A Tool for Simulating Multi-tier Queuing Applications”, Technical Report, Department of MCA, MSRIT, TRMCA 04.