An Algorithm for Accurate Taillight Detection at Night
Noppakun Boonsim
Department of Computer Science and Technology, University of Bedfordshire, Luton, Bedfordshire, UK
Simant Prakoonwit
Department of Computer Science and Technology, University of Bedfordshire, Luton, Bedfordshire, UK
ABSTRACT
Vehicle detection is an important process of many advance driver assistance system (ADAS) such as forward collision avoidance, Time to collision (TTC) and Intelligence headlight control (IHC). This paper presents a new algorithm to detect a vehicle ahead by using taillight pair. First, the proposed method extracts taillight candidate regions by filtering taillight colour regions and applying morphological operations. Second, pairing each candidates and pair symmetry analysis steps are implemented in order to have taillight positions. The aim of this work is to improve the accuracy of taillight detection at night with many bright spot candidates from streetlamps and other factors from complex scenes. Experiments on still images dataset show that the proposed algorithm can improve the taillight detection accuracy rate and robust under limited light images.
General Terms
The general term of this study is image processing and computer vision.
Keywords
Vehicle detection, taillight, night
1.
INTRODUCTION
About one third of road accidents emerge in low lighting conditions [1] such as, raining, driving in tunnels or during night. The advance driver assistance systems (ADAS) or advance warning systems are increasingly employed to help drivers in those hours. ADASs are used to avoid forward collision by detecting vehicle appearances such as size, shape, edges and colour in daytime while at night, features are reduce and can be detected for instance, headlights (HL), taillights (TL) and brake lights.
Many researchers have presented techniques to detect vehicle at night by positioning a TL pair. TL detection can be divided to two main processes: TL candidate extraction and TL verification. First, TL candidate extraction is the process to segment out potential regions from many light sources such as, streetlamps, oncoming HLs and reflections. There are many techniques to filter TL candidates such as TL shape (circular) [2], colour [3, 4, 8] and aspect ratio [2]. Many different colour spaces such as gray, RGB and HSV with various parameters have been used to filter light spots from images. The authors of [9, 10] propose gray value image to segment bright spots within the images. However, there are many bright spots from light sources on roads, for example, streetlamps, signal lights and reflections which demand high computational time to localize TL position alone. RGB colour space is the most commonly used [3]. However with red, green blue channels, it is difficult to define the threshold values for TL colours which display a white colour spot surrounded by red colour pixels. A more suitable, natural and practical for this problem is HSV (Hue-Saturation-Value) colour space [3, 4] which has been employed in this work.
TL verification process can be divided in two methods: rule based and learning based. Although learning based report the higher detection rate than rule based, the method is required training dataset and training time. Therefore, this work adopts the detection process using the symmetry analysis such as size, shape, position [2, 3], cross correlation [4, 5, 6] . TLs are basically placed as pair and symmetry with size shape and position with same vehicle. In [2], a vertical position and similar area of bright spots have been applied as pairing verification. Ronan et al, [3] have been proposed the symmetry of blobs alignment, area and aspect ratio. In addition, aspect ratio of bounding box is applied to discard candidate pairs which too close (near blobs) and too far (other light sources) in urban rural areas or dark scenes. The work in [5] implemented colour cross correlation to verify the TL pair. Symmetry cross-correlation of left and right parts is evaluated and implemented to localize rare lamp in [4]. In addition, Perspective correction is proposed in [6] to solve symmetry problem of yaw angle of camera, blend road and land changing.
This paper, a new TL detection algorithm is proposed. The new algorithm applies connected component analysis (CCA) and the symmetry measurement to increase the accuracy of TL detection. The summary of the algorithm can be viewed in Fig. 1. TL candidate regions are firstly extracted by implementing TL colour filtering. Then each candidate is multi-paired with other regions. Finally, the symmetry analyses are used to verify the TL positions.
The remaining parts are organized as follows: In Section 2, the proposed method is introduced. The experimental results are given in Section 3. Finally, the conclusion is in Section 4.
2.
PROPOSED METHOD
32
TL colour filtering
Candidates extraction
Multi pairing each candidate
Calculating pair symmetry score
Symmetry Score (SS) = 0.8*DS+0.1*AS+0.1*ARS
Maximum Symmetry Score > 80
Yes No
Y-Distance Symmetry (DS)
Area Symmetry (AS)
Aspect Ratio Symmetry
(ARS)
Output TL image Image
Candidates extraction
TL verification
Reject
Fig. 1. Algorithm of TL detection
2.1
Candidates Extraction
[image:2.595.320.541.72.275.2]The aim of this step is to obtain TL candidate regions. Firstly, image is converted to HSV colour space and then two colour thresholds are applied to detect white and red pixels. Next candidate regions are created from extracting red pixel regions containing with white pixels.
Table 1 Colour thresholds [3]
Hue Saturation Value
Red 340˚- 30˚ 0 - 30 80 - 100
White All 0 - 20 99-100
2.1.1
Colour Filtering
First, a colour image is converted to HSV colour space which is illustrated in Fig. 2(b) converting original image in Fig. 2(a). Then red and white colour thresholds which show in Table I are employed to detect TL colours. Fig. 2(c) and 2(d) show binary image from filtering red and white colour pixels with original HSV image in Fig. 2(b).
(a) (b)
(c) (d)
Fig. 2. (a) Original input image, (b) HSV colour image, (c) binary image for red pixels, (d) binary image for
white pixels
2.1.2 Candidates Extraction
From the previous process, a binary image of red and white pixels is obtained. To create the TL candidate regions, first, morphological operations are implemented on each binary image to merge closed pixels in order to have regions which are shown in Fig. 3(a, b). Then, TL candidates are extracted from red regions containing with white regions which is illustrated in Figure 3(c). Last, small regions with less than threshold (50 pixels) are removed as filtering potential regions that displays in Figure 3(d).
(a) (b)
(c) (d)
Fig. 3. (a) morphological operated image of 2(a), (b) morphological operated image of 2(b), (c) intersected
image of 3(a) and 3(b), (d) removed noise image
2.2
TL Verification
[image:2.595.58.280.72.502.2] [image:2.595.319.541.449.670.2] [image:2.595.66.267.616.675.2]2.2.1
Candidate pairing
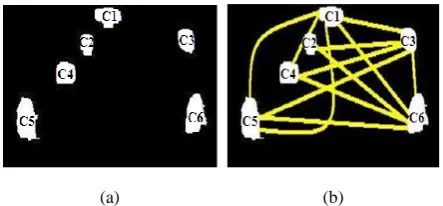
To pair the candidates, connected component analysis (CCA) is firstly applied to label each candidate in order to have their characteristic parameters. Then, regions are named as Ci
where i=1, 2, 3..n which is shown in Fig. 4(a). After that, each candidate is multi-paired with others, Fig. 4(b). Last, a number of pairs, Pk is obtained after pairing in the following
equations:
Pk = (Ci,Cj) (1)
Where k represents the number of pairs and i and j is defined as number of candidate C that i is not equal j (i ≠ j). For Pk =
(Ci,Cj) and Pair Pk+1 =(Cj,Ci), these pairs are defined as the
same pair which can be denoted by Pk = (Ci,Cj) =(Cj,Ci).
[1] [2]
[image:3.595.55.277.241.344.2](a) (b)
Fig. 4. Candidates pairing (a) named candidates (b) multi candidates pairing
2.2.2
Symmetry analysis
To check the symmetry of each pair, the symmetry score functions are implemented to position, size and shape of the pairs. First, the symmetry of position is considered by estimating y-direction distance of each pair. Y-direction distance is the length between border and centre of candidates in Y- axis and symmetry score of pair can be computed by (2).
DS (Pk) = (1- |Hi-Hj|) x 100 (2)
Hi+Hj
Where DS is y-distance symmetry score of pair Pk. Hi and Hj
are the y axis-distance between border and centre of Ci and
Cj, respectively. Next, size symmetry is then checked by
using (3) to justify area characteristic equality.
AS (Pk) = (1-|Ai-Aj|) x 100 (3)
Ai+Aj
Where AS is defined as size (area) symmetry score of pair Pk.
Ai and Aj are the area of candidate Ci and Cj, consecutively.
Then the symmetry of shape is checked by analysing aspect ratio of candidate width and height is implemented by (4).
ARS (Pk) = (1- |ARSi-ARSj|) x 100 (4)
ARSi+ARSj
Where ARS is the aspect ratio symmetry score of pair Pk.
ARi and ARj represent the aspect ratio of candidate Ci and Cj,
respectively. Last, the pair aspect ratio is checked. The aspect ratio of TL pair should have more than 3 and less than 8 [3] as threshold values. If aspect ratio of candidate pairs isn’t within the thresholds, it will be discarded. A pair aspect ratio can be computed by (5).
Pair Aspect Ratio (Pk) = Dist. between Ci and Cj (5)
Avg. width Ci and Cj
2.2.3
TL Verification
Previous stage symmetry scores of each candidate pair are computed, and then a total symmetry score will be calculated by Y-distance, size and a shape symmetry score in (6) with weighting values. Due to some complex scenes, there are many candidates having the high symmetry size and shape that could produce incorrect TL detection. Thus, position symmetry score is experimentally defined as the most significant value following by size and shape symmetry
Symmetry Score (SS)k = 0.8*DSk + 0.1*ASk +0.1*ARSk (6) Finally, the maximum symmetry score will be considered to confirm the position of TLs. The symmetry score of TL should be more than 80. If the score is less than the threshold value, test images will be discarded. In (7) is the equation to verify TL positions.
TL pair = Max (Symmetry Score (Pk)) > 80 (7)
3.
EXPERIMENT RESULTS AND
DISCUSSION
3.1
Experiments and results
To evaluate the performance of the proposed algorithm, 108 various vehicle images captured from mounted camera in an urban street intersection were tested. The images were resized to 300 x 400 pixels and grabbed with distance from camera within 50 meters. The algorithms were implemented in MATLAB and run on an Intel Pentium Dual Core 2.10 GHz, 3 GB memory. The threshold values, for instance, structure element (SE) is defined as ‘diamond’ size 9 for morphological operations and colour thresholds are shown in Table 1 for the colour filtering process. The average runtime for one image was 0.8 second. Fig. 5 illustrates the results of TL detection images. Finally, the proposed algorithm can accurately detect TL for those vehicles where the scene is containing many light sources from oncoming HLs, street lamps and other reflections with 95.37% which is shown in the last row of Table 2.
Table 2. TL detection accuracy Rule-based
works
Detection accuracy
Average Time (ms)
Situations
Chun et al [2] 91.00 23 Night
Yi et al.[7] 84.92 47 Day, night
Ronan et al. [5] 92.97 N/A Night
Ronan et al. [6] 92.56 N/A Night
Ronan et al. [3] 95.30 149 Night
34
[image:4.595.66.530.73.172.2](a) (b) (c) (d)
Fig. 5. Example of TL detection results
3.2
Discussions
A comparison of detection rate and computational speed with others studies is shown in Table 2. First detection rate evaluation, the proposed method obtains a highest accuracy in TL detection than the previous works. The study improves from the method in [3] by employing weighted symmetry parameters. Therefore, the research requires comparing to the algorithm of O’Malley et al. [3], although the work in [3] was published since 2008. Even though the presented algorithm achieves the highest detection rate, it is slightly higher than accuracy rate in [3]. Unlike the technique in [3], weighted symmetry parameters are defined in the verification process in order to have a high accuracy in urban areas. Due to some urban area scenes having many candidate light sources, many spots might have a high symmetry size and shape which rises incorrect detection of the real TL pair. Second the computational speed comparison, the proposed method uses time per image to detection more than the method in [3]. Because the proposed experiment images were captured in an urban area which has many nuisance lights that produce the high processing time for calculating symmetry score for each candidate pair while tested images in [3] were the images in dark rural areas which were displayed a few spots within images shown in [3]. Furthermore, the proposed algorithms were implemented with MATLAB program which is the run time interpretation software. Thus, the computational speed is very high. However, this processing time is still lower than the time specified in the real time processing requirement.
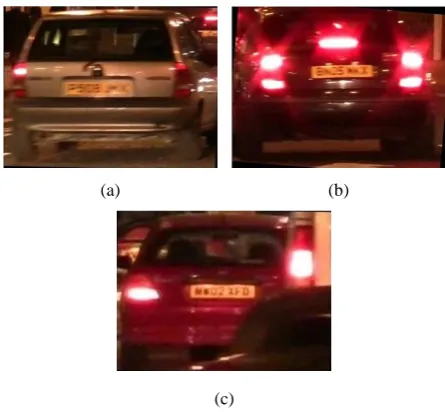
The restriction of the proposed method fails in the cases of TL display only one side in Fig. 6(a), TL displays same time as brake lights in Fig. 6(b), and Symmetry score is less than 80 in Fig. 6(c).
4.
CONCLUSIONS
TL detection is the significant step of vehicle detection process which uses in ADASs. This paper proposes an algorithm to improve the accuracy rate of TL detection. The proposed method uses CCA and symmetry analysis of candidate pairs. The weighted symmetry scores are employed to improve the accurate detection of TL. The experimental results show that the proposed algorithm can detect the location of TL with high accuracy. The limitation of this method is single TL images and images including brake lights.
(a) (b)
(c)
Fig. 6. Example of error TL detection (a) one side TL, (b) TL and brake light in same time, (c) reject case for
symmetry score less than 80
5.
REFERENCES
[1] Traffic Safety Basic Facts 2007-Motorways. EUR. ROAD SAFETY OBSERVATORY.
[2] WANG, C. -C., HUANG, S.-S., and FU, L.-C. 2005. Driver assistance system for lane detection and vehicle recognition with night vision. In Proc. IEEE/RSJ International Conference on Intelligent Robots and System.
[3] O'MALLEY, R., GLAVIN, M., and JONES, E. 2008 Vehicle detection at night based on taillight detection. In Proc. 1st International Symposium on Vehicular Computing System.
[4] LI, Y., and YAO, Q. 2012. Rear lamp based vehicle detection and tracking for complex traffic conditions. In Proc. 9th IEEE International Conference on Networking, Sensing and Control.
[5] O'MALLEY, R., JONES, E., and GLAVIN, M. Rear-lamp vehicle detection and tracking in low-exposure color video for night conditions. IEEE Transactions on Intelligent Transportation Systems. vol. 11, no 2, (June 2010) ,453-462.
[image:4.595.316.539.207.413.2][7] CHAN, Y. -M., HUANG, S. -S., FU, L. -C., and HSIAO, P.-Y. 2007. Vehicle Detection under Various Lighting Conditions by Incorporating Particle Filter. In Proc. IEEE Conference on Intelligent Transportation Systems. [8] MING, Q., and JO, K. –H. 2011. Vehicle detection using
tail light segmentation. In Proc. 6th International Forum on Strategic Technology.
[9] ZHOU, S., LI, J., SHEN, Z., and YING, L. A night time application for a real-time vehicle detection algorithm
based on computer vision. Research Journal of Applied Sciences, Engineering and Technology. vol. 5, no. 10, (March 2013), 3037-3043.
[10] CHEN, Y. L. Nighttime vehicle light detection on a moving vehicle using image segmentation and analysis
techniques, WSEAS TRANSACTIONS on
COMPUTERS, vol. 3, no. 3, (March 2009), 506-515.