Munich Personal RePEc Archive
On the optimality of a GCC Monetary
Union: Structural VAR, Common Trends
and Common Cycles Evidence
Abu-Qarn, Aamer and Abu-Bader, Suleiman
Monaster center for economic research
2006
Online at
https://mpra.ub.uni-muenchen.de/22278/
On the Optimality of a GCC Monetary Union: Structural VAR, Common
Trends, and Common Cycles Evidence
Suleiman Abu-Bader and Aamer S. Abu-Qarn
Department of Economics, Ben-Gurion University of the Negev, Beer-Sheva, Israel
Corresponding author:
Aamer S. Abu-Qarn
Economics Department
Ben-Gurion University of the Negev P.O. Box 653
Beer-Sheva, 84105 Israel
Tel.(Office): +972-8-647-2296 Tel.(Home): +972-8-651-0516 Fax: +972-8-647-2941
On the Optimality of a GCC Monetary Union: Structural VAR, Common
Trends, and Common Cycles Evidence
Abstract
This paper examines the suitability of the proposed monetary union among the members
of the Gulf Cooperation Council (GCC). To do so, we identify the underlying structural shocks
that these economies are subject to and assess the extent to which the shocks are symmetric.
Additionally, we test for common trends and common business cycles among the GCC
economies. We find that while the transitory demand shocks are typically symmetric, the
permanent supply shocks are asymmetric. Furthermore, we do not find synchronous long-run and
short-run movements in output. Despite the progress that has been made in terms of integration,
our findings indicate that the conditions for forming a GCC monetary union have not as yet been
met.
Keywords: Gulf Cooperation Council, GCC, optimal monetary union, cointegration, common
cycles, structural VAR
1. Introduction
In May 1981, six Gulf countries (Bahrain, Kuwait, Oman, Qatar, Saudi Arabia, and UAE)
signed the charter of the GCC. Among various objectives, these states sought “to coordinate their
financial, monetary and banking policies and enhance cooperation between monetary agencies
and central banks, including the endeavor to establish a joint currency.” Progress has been made
towards the implementation of these goals, and many measures have been taken to align their
monetary, financial and economic systems as a prelude for a common currency to be introduced
no later than January 2010. All the GCC members have already pegged their currencies to the US
dollar. Furthermore, a customs union was established in 2003, and plans were set for the
formation of a common market in which all barriers on the movements of goods, services, labor
and capital are to be abolished by 2007. In 2005, the GCC members adopted the EU convergence
criteria with respect to budget deficit, public debt, currency reserves, interest rate, and inflation.
Fulfillment of most of the convergence criteria has been achieved, with inflation being the lone
exception. Despite these impressive advances, many economists and analysts argue that the
progress has been remarkably slow and additional steps are required for the monetary union to be
effective (Dar and Humayon, 2001 and Darrat and Al-Shams, 2005 among others).
The feasibility of a potential monetary union for a block of countries is usually evaluated
by weighing the benefits and costs of joining a currency union (Mundell, 1961 and McKinnon,
1963). Using a single currency leads to the elimination of transaction costs and uncertainties
(monitoring exchange rates and predicting their fluctuations, costs of currency conversion, and
keeping and managing reserves for intra-regional trade). On the other hand, participating in a
monetary union involves losing autonomy over monetary instruments such as interest rates and
in terms of trade and factor mobility, that share harmonized business cycles, and subject to
similar exogenous shocks are more likely to be suitable candidates for a monetary union.
This study investigates the extent to which the member states of the GCC meet the
theoretical criteria for an optimal monetary union. Most previous studies have examined the
feasibility of a currency union based on the observed similarities of the economies and the
degrees of monetary and fiscal convergence that have been achieved. We contribute to these
efforts by exploring the symmetry of the external shocks that the economies are subject to and the
degree of synchronization in long-run economic activity and in short-run business cycles. To do
this, we apply Blanchard and Quah’s (1989) procedure for identifying demand and supply
disturbances across member states. Based on the aggregate demand-aggregate supply (AD-AS)
framework, we assume that demand shocks lead to temporary changes in output and permanent
changes in prices, whereas supply shocks, such as those originating from changes in technology,
result in permanent changes in both output and prices. For the purpose of identification, we
impose the restriction that demand shocks have no long-run effect on output. Once the
exogenous demand and supply shocks are recovered, we compute the correlations of the shocks
across countries. If the underlying disturbances are symmetrically distributed across countries
this means that the costs of a common currency are relatively small and the desirability of a
monetary union is high. The procedure has been applied to several actual and potential currency
unions (for example, Bayoumi and Eichengreen, 1994, Arnon and Spivak, 1996, Horvath and
Ratfai, 2004, and Buigut and Valev, 2005), but has not been applied for the GCC region.
Since the degree of correlation between shocks does not accurately resemble short-run
output co-movements, we complement our analysis by both testing for cointegration (to assess
the existence of long-run movements in real output among countries) and for the existence of
viable it is essential to have both long-run synchronous real output co-movements and short-run
common business cycles. To the best of our knowledge, a similar analysis has not been
conducted for the GCC.
The paper is organized as follows. Section 2 provides a detailed survey of the previous
empirical studies that dealt with the GCC region and outline their shortcomings. Our
methodologies and data sources are presented in section 3. In section 4, we present the results of
our tests of synchronization of shocks, long-run trends and short-run business cycles. A summary
and some concluding remarks are provided in section 5.
2. Previous Empirical Evidence
Most of the earlier studies tackling how ready the GCC region is to establish a common
currency referred to the costs of forming a union based on several economic, social and political
characteristics of the economies. Overall, the vast majority of studies concluded that the region is
not ready to abolish their national currencies and adopt a common currency.
An early attempt to examine the readiness of the GCC to form a currency union was made
by Zaidi (1990). He observed convergence in inflation rates and moderate dispersion in the
growth rates of broad money. Furthermore, he found that the responsiveness of output to
unanticipated money growth, and thus the inflation-unemployment tradeoffs, vary greatly among
GCC members. To avoid serious consequences of the observed variations, Zaidi (1990)
suggested extensive coordination of monetary policies.
In an informal assessment of the potential of a GCC monetary union, Dar and Presley
(2001) pointed out the low level of integration among GCC members as illustrated by the
insignificant volume of intra-regional trade. They attributed this fact to the similarity of oil-based
more flexible rules for intra-regional trade and FDI, enhancing the production diversification
process, accelerating privatization efforts, and increasing Saudi Arabia's trade with GCC
members instead of trading outside the region.
A detailed examination of the progress in integration efforts of GCC members is provided
by Laabas and Limam (2002). They conducted a formal test based on the generalized purchasing
power parity and found the exchange rates to be closely related and to share the same stochastic
trend. By examining various eligibility criteria for currency union including openness, factor
mobility, commodity diversification, production structure, price and wage flexibility, similarity
of inflation rates, degree of policy integration, and political factors, they concluded that not all
the prior conditions are favorable for a currency union. In particular, they referred to a lack of
production diversification, limited intra-regional trade, slow convergence in macroeconomic
fundamentals, and unsynchronized business cycles. On the other hand, the authors maintained
that the failure to meet the prior conditions does not necessarily mean that the region is not ready
for the formation of a monetary union. As in the case of the European Union, the eligibility
criteria are generally fulfilled ex-post rather than ex-ante. Launching a currency union could
result in the alignment of business cycles and an increase in the volume of intra-regional trade.
To boost the odds for a successful union, the authors called for the elimination of restrictions on
free movement of goods and production factors and to a larger degree of political integration.
A similar examination of the readiness of GCC countries for a common currency was
carried out by Jadresic (2002). He weighed the possible benefits and costs incurred as a result of
replacing individual GCC currencies with a common regional currency and concluded that the
success of such a union is conditional on a broader set of measures including the removal of
domestic and cross-border distortions that hamper trade and foreign investments, coordinating
Fasano and Schaechter (2003) had an overall favorable view of the GCC monetary union.
They asserted that such a union when combined with the appropriate macroeconomic and
structural policies can improve efficiency of financial services, lower transactions costs, increase
transparency in prices of goods and services, facilitate proper investment decisions, and promote
the allocation of resources within the region.
Unlike most of the previous studies, Darrat and Al-Shamsi (2005) concluded that the
failure of the GCC members to achieve full economic and financial integration is not the outcome
of economic and financial incompatibility among the region's countries but more likely the
product of sociopolitical differences that may have hindered the progress towards a viable
common block. The authors reached these conclusions by testing for cointegration among the
GCC countries’ GDP, inflation, exchange rate, money stock and monetary base. They found that
the Gulf countries share a common long-run trend linking their economic activity, financial
markets, and monetary policies. The existence of cointegration does not, however, imply that the
short-run business cycles are synchronized. Both synchronous long-run real output trends and
short-run common business cycles are essential for the formation of a successful currency union.
Sturm and Siegfried (2005) carried out a comprehensive study in which they evaluated
the progress that the Gulf countries have made in their quest for a common currency. As in earlier
studies, their results showed a remarkable monetary and structural convergence but a sluggish
fiscal convergence. For the proposed monetary union to be credible and sustainable, they called
upon GCC members to establish a supranational monetary institution that will be responsible for
the design of monetary and exchange rate policies geared to the conditions of the region as whole
rather than coordinating national policies.
A recent study by Hebous (2006) highlighted the significant progress that the GCC
reference. He emphasized the similarities among the GCC countries as the main factor leading to
reduced costs of forming a currency union.
3. Methodology and Data
3.1 Structural VAR
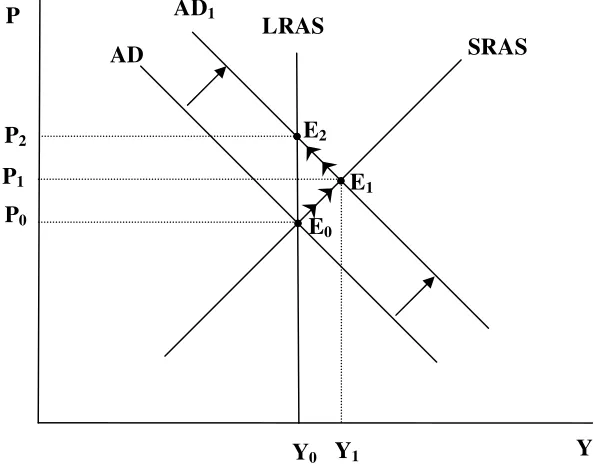
In order to understand the theoretical foundations for the restrictions needed to identify
the underlying structural shocks we use the familiar aggregate demand (AD), short-run aggregate
supply (SRAS) and long-run aggregate supply (LRAS) system. A positive demand disturbance
(Figure 1) causes AD to shift from AD to AD1 thus reaching a new short-run equilibrium at E1 in
which both the output (y) and price level (p) increase. Pressures in the labor market result in
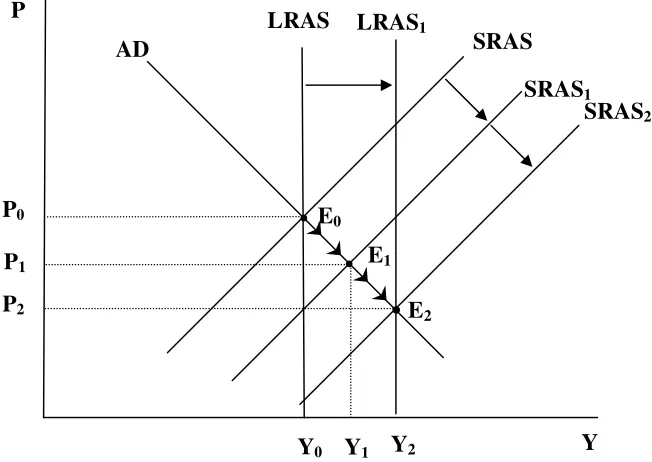
rising wages that in the long-run lead to a new equilibrium along the LRAS at (E2). Thus, the
impact of a permanent demand shock is a temporary rise in output in the short-run followed by
convergence to the initial output level, but with a permanent impact on price levels.
On the other hand, a positive supply shock (Figure 2) causes both SRAS and LRAS to
shift to the right. In the short run a new equilibrium at (E1) in which p falls and y rises is reached.
Eventually, we move to a new long-run equilibrium at (E2) in which p continues to fall and y to
rise. Thus, the impact of a supply shock is permanent on both output and prices.
In order to identify the underlying shocks we apply the Blanchard and Quah (1989)
SVAR identification scheme. Assuming that the logs of output {yt} and the price level {pt} have
unit root but their first difference is stationary, we can represent the vector of the first differences,
of these two variables, Xt, as an infinite moving-average representation:
∑
∑
∞ = ∞ = − − = = + + + = ≡0 21 22
12 11 0 2 2 1 1 0 ... i st dt i i i i i i t i i t t t t t t a a a a L A L A A A p y X ε ε ε ε ε
where L is the lag operator, Ai are 2x2 matrices representing the impulse response functions of
the shocks to the elements of Xt, and εdt and εstare independent white noise demand and supply
shocks.
To enable us to identify the shocks, we assume, based on the AD-AS model, that demand
shocks have no permanent effect on output while supply shocks do have. Thus, the cumulative
effect of demand shocks on yt is zero:
0 0 11 =
∑
∞ = i ia (2)
The model can be estimated using the following finite reduced form VAR:
t k t p t t
t B X B X B X e
X = 1 −1+ 2 −2+...+ − + (3)
which takes the following infinite moving average representation:
(
)
(
)
∑
∞ = − − − = + + + = + + + = − = 0 2 2 1 1 2 1 ... ... ) ( ) ( ) ( i t i i t t t t tt I B L e I B L B L e e De D e LDe
X (4)
where the B's represent the estimated coefficients of regressing yt and pt on lagged values of
both yt and pt, and k is the optimal lag length that ensures white noise residuals, et. Writing
the relation between the reduced form disturbances, et, and the structural shocks, εt, as
t t C
e = ε (5)
four restrictions on the system are needed to identify the four elements of matrix C. The first two
restrictions are normalization of the variances of εdt and εstto unity, the third is the orthogonality
condition E(εdt,εst)=0, and the fourth is the restriction imposed in equation (2). Substituting
equation (5) into equation (4), the restriction imposed in equation (2) takes the following form:
= =
∑
∑
∞ = ∞ = . . . 00 21 22
12 11 22 21 12 11
i i i
i i o i i c c c c d d d d C
The four restrictions allow us to uniquely identify the matrix C, and recover the demand and
supply shocks from the estimated reduced-form disturbances, and the structural impulse
responses. Once the series of shocks are calculated for all the countries in our sample, we
compute the correlation coefficients between the shocks to assess how synchronized they are.
3.2 Common Trends and Common Cycles
To assess whether the GCC countries share synchronous long-run movements in their
economic activity, which would imply the feasibility of forming a monetary union we test for
cointegration among all possible pairs of GCC countries using the Johansen (1988) maximum
likelihood method.
Let us consider the following VAR model of order k:
t k t k t
t A X A X
X = + 1 −1+....+ −1 − +ε (7)
where X is a vector of n endogenous variables. If all the variables are I(1) in their levels, we say
that these variables are cointegrated if a non-trivial stationary linear combination of these
variables exists. For n endogenous variable there can be at most n-1 distinct cointegration
vectors. In case that these variables are cointegrated, then by the Granger representation theorem,
the VAR model can be expressed as the following VECM:
t t k t k t
t X X X
X = +Γ1 −1+....+Γ−1 − +1+Π −1+ε (8)
whereεtis a vector of white noise residuals. If the matrixΠ is of rank1≤r<n−1, then it can be
decomposed into Π =αβ', where α(rxn)and β(rxn), and equation (8) can be reformulated as:
t t k t k t
t X X X
X = +Γ1 −1+....+Γ −1 − +1+α(β' −1)+ε (9)
where the rows of β are interpreted as distinct cointegration vectors, and the α’s are the
us to test and determine the number of cointegrating relationships (the rank of matrix Π) between
the nonstationary variables in the system using the maximum likelihood procedure.
The existence of cointegration implies that countries share synchronous long-run
movements in their economic activity, which indicates a higher likelihood for forming a
monetary union. Nonetheless, even if a long-run relationship exists, short run business cycles in
GDP might be asynchronous and require country specific monetary policies. In this case, the
feasibility of forming a monetary union could be low.
To test for common cycles in the presence of common trends, we use the procedure
developed by Vahid and Engle (1993). This procedure amounts to finding the sample canonical
correlations between Xt and W(k)≡
(
Xt−1, Xt−2,..., Xt−k, Zt−1)
, where k is the lag order of thesystem in differences (one less than the lag order of the VAR in levels) and Zt-1 is the error
correction term. Specifically, the test statistic for the null hypothesis that the number of common
cycle vectors is at least s is:
(
)
∑
(
)
= − − − − = s i i k T s k C 1 2 1 log 1 ) ,( λ (10)
where the 2
i
λ 's are the s smallest squared canonical correlations between Xt and W(k). Under the
null hypothesis, the statistic C(k,s) has a χ2 distribution with s(s + nk + r – n) degrees of freedom,
where n is the dimension of the system and r is the number of cointegration vectors.
3.3 Data
Data on output and prices for member states of the GCC were obtained from the World
Development Indicators website (http://devdata.worldbank.org/dataonline), International
Financial Statistics 2003 CD ROM as well as from the websites of the statistical bureaus and
level is the GDP deflator. All samples terminate in 2003, but start in different years as follows;
Bahrain – 1975, Kuwait – 1962, Oman – 1963, Qatar – 1970, Saudi Arabia – 1968, and United
Arab Emirates – 1973.
4. Empirical Results
Some indications of synchronization or rather a lack of it can be drawn from looking at
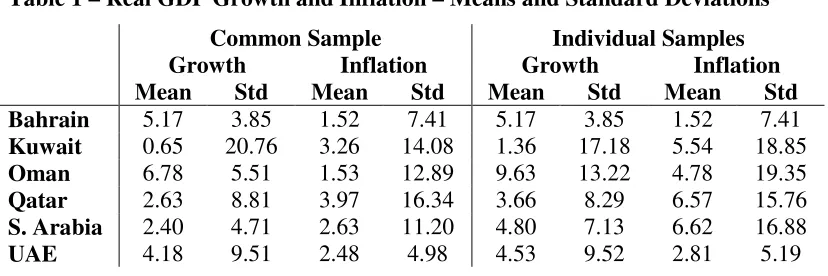
the raw data of real GDP growth and inflation. Table 1 displays the means and standard
deviations for these measures from which it is clear that the long run growth rates vary greatly.
While Kuwait, Qatar, and Saudi Arabia experienced modest annual growth rates ranging from a
mere 0.65% (Kuwait) to 2.63% (Qatar), the rest of the countries displayed impressive
performances. Furthermore, some of the economies (Kuwait, Qatar, and UAE) are characterized
by especially volatile economic activity compared with the rest. From inflation figures we get a
different picture. All GCC members have relatively low rates of inflation, though of a volatile
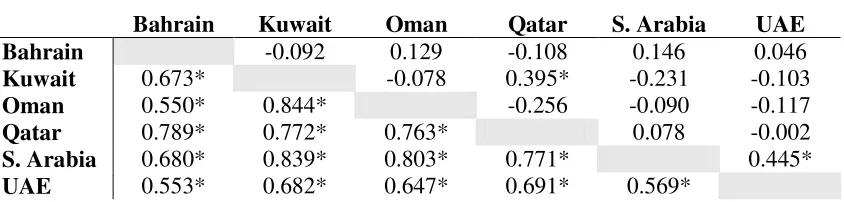
nature. Additional supporting evidence is depicted in Table 2 which presents the correlations of
real GDP growth and inflation. While the GCC countries do not exhibit significant correlations of
GDP growth except for between Qatar and Kuwait and Saudi Arabia and UAE, inflation rates are
highly correlated in all other cases. Hence, we gather that inflation rates exhibit a great deal of
convergence whereas economic activity does not. Now that we have some idea of the nature of
the relationships among the GCC economies we can conduct a rigorous formal assessment of
these relationships based on recovering the correlations of the demand and supply shocks and on
examining the existence of common trends and business cycles.
4.1 Correlation of Shocks
Before recovering the exogenous demand and supply shocks in the VAR system of output
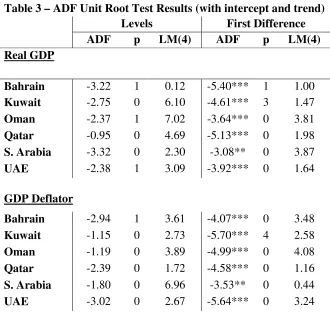
real GDP (y) and the natural logarithm of the GDP deflator (p). The Augmented Dickey-Fuller
(ADF) unit root tests presented in Table 3 reveal that the hypothesis of a unit root cannot be
rejected at conventional significance levels for both y and p for all countries. When taking the
first differences of the variables, our tests show that the null hypothesis of a unit root is rejected
in all cases. Thus, we conclude that y and p are integrated of first order, I(1). The Lagrange
multiplier test for up to fourth order serial correlation in the residuals does not indicate the
presence of serial correlation.
Next, the underlying demand and supply shocks are recovered. Panel (a) of Figures 3 and
4 depict the impulse responses of the price level to demand and supply shocks, their magnitude
and the speed of adjustments to such shocks. The higher the magnitudes of the shocks and the
slower the adjustment, the higher are the costs of maintaining a currency union. We see that the
implicit over-identifying restriction that positive demand shocks lead to permanently higher
prices is fulfilled in all cases (Figure 3). However, the second over-identifying restriction, that
positive supply shocks lead to permanently lower prices is not satisfied in all cases with the
exception of Kuwait (Figure 4). The rise in prices following a supply shock is negligible in four
cases and substantial only in the case of Saudi Arabia. This anomaly has also been reported by
Bayoumi and Eichengreen (1994) for three North American regions that are heavy producers of
raw materials (Western Canada, North West U.S. and South West U.S.). These American regions
are similar in their economic structure to the GCC economies in that they also rely heavily on
production of oil and natural gas. Due to the economic structure of the GCC countries, a positive
supply shock could be accompanied by a positive demand shock that offsets the impact of the
supply shock and consequently leads to higher prices.
It is worth noting that convergence of the price level following demand and supply shocks
the price level to shocks varies greatly across the GCC countries. This observation is clearly
evident in relation to demand shocks—while UAE and Bahrain's price responses to demand
shocks are modest, the responses of the price level are relatively large in the rest of the countries.
The impact of demand and supply shocks on output is presented in panel (b) of Figures 3
and 4, respectively. Our restriction that demand shocks have no permanent effect on output is
fulfilled in all cases (Figure 3). As the AD-AS framework suggests, following a demand shock,
the output of all countries rises temporarily but the effect wanes relatively quickly. On the other
hand, a positive supply shock leads to higher output, however, with varied degrees (Figure 4).
Our next step is to calculate the correlation coefficients between the identified demand
and supply disturbances among the GCC countries. The more symmetric the shocks (positive
correlations), the more feasible for group pf countries to form a currency union. Supply shocks
are likely to reflect exogenous factors such as oil price shocks while demand shocks reflect both
exogenous factors and macroeconomic policies. Bayoumi and Eichengreen (1993) argue that
supply shocks serve as better indicators of the symmetry or asymmetry of the underlying
disturbances following a change in the exchange rate regime. The pairwise and common sample
correlation coefficients are reported in Tables 4 and 5.
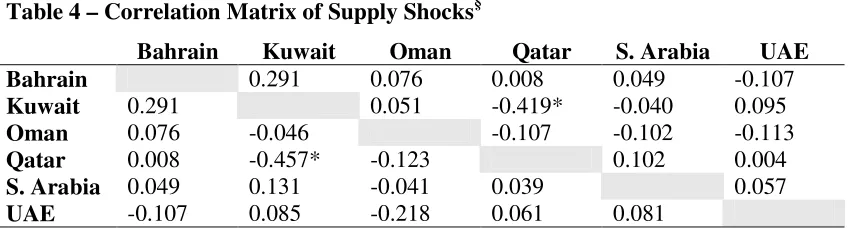
From Table 4 we can see that, generally speaking, the contemporaneous supply shocks are
asymmetric. Among the fifteen pairs of countries the correlation coefficients are either negative
or positive but statistically insignificant in all instances. In fact, the supply shocks of Kuwait and
Qatar are negative and significant (-0.42 and -0.46 using pairwise and common samples,
respectively). Correlations of supply shocks of the leading GCC country, Saudi Arabia, with
those of the other countries are mostly positive correlations though statistically insignificant.
These asymmetric supply disturbances do not lend support to the establishment of a viable
documented among the industrial European Union countries and Southern European members
where currency union is considered to be quite viable. (Bayoumi and Eichengreen, 2003 and
Buigut and Valev, 2005).
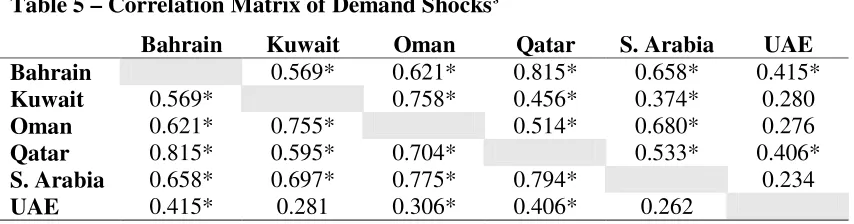
When we turn to the demand shocks (Table 5) we find that, in contrast to supply shocks,
the correlation coefficients among the paired countries are positive and highly significant in most
cases except for UAE with Kuwait, Oman and Saudi Arabia. This finding indicates that
contemporaneous demand shocks faced by the GCC countries, unlike supply shocks, are
generally symmetric. The correlations are generally higher and more significant than those
reported for EU and NAFTA regions by Bayoumi and Eichengreen (1993). This finding can be
explained by the fact that GCC economies are dominated by public sector that boosts demand
during episodes of high oil prices and reduces demand during episodes of low oil prices.
Our tests were conducted also with the inclusion of dummy variables in the VAR system
for some major exogenous events that affected the region, particularly the oil crises of 1973, 1979
and the Gulf War in 1991. However, we did not observe significant changes in our results.
The above findings show that while supply shocks are asymmetric, demand shocks are
symmetric. Since supply shocks are more crucial in gauging the costs of forming a monetary
union we can conclude that the GCC countries are not ready to establish a currency union that
would prove viable. To further reinforce our findings, we examine whether GCC countries share
synchronous long-run and short-run economic activity.
4.2 Common Trends and Common Features
To test whether GCC members share a common long-run trend in their output, we
conducted cointegration tests for fifteen possible pairs of countries. The unit root tests show that
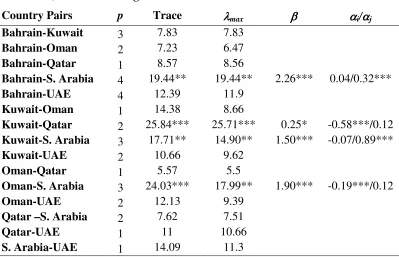
countries (Table 3). The results of the cointegration tests are presented in Table 6. Among the
fifteen combinations of countries we find that a long-run common trend exists in four cases
regardless of the rank determination test. The signs in the cointegration vector (β in Table 6) are
positive as expected. Additionally, the error correction coefficients (the α's in Table 6) are
significant at least in one of the two equations for every pair of countries for which we detected
cointegration. This implies that divergence from a long-run equilibrium is short-lived and real
GDP adjusts to the long-run common trend.
Overall, since only a few long-run relationships were detected among the possible pairs of
economies we may infer that the economic activity of the GCC countries in most cases is not
linked and more efforts are needed to increase the degree of compatibility among these countries.
The only supporting factor for forming a GCC currency union is that three GCC countries share a
long-run trend with Saudi Arabia, which is the largest and most dominant economy in the region.
As mentioned earlier, the existence of a long-run trend is necessary but insufficient when
assessing the degree of synchronization of economic activity. Short-run business cycles, if
idiosyncratic, may require country-specific policies that are infeasible under the regime of
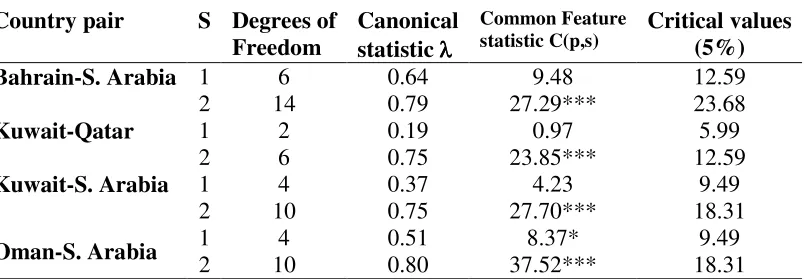
currency union. To account for business cycles synchronization we applied the Vahid and Engle
(1993) procedure to test for common serial correlation of business cycles for the four pairs of
countries in which cointegration was detected. The results reported in Table 7 demonstrate that
the null hypothesis of at least one common cycle vector is not rejected in three cases, while the
null hypothesis of at least two common cycle vectors is rejected in all cases. Thus, we may
conclude that in three out of the four cases the pairs of countries share common business cycles
sharing common long-run trend and short-run cycles, our findings again lend no support for a
establishing a currency union among the GCC members.
5. Summary and Concluding Remarks
We examine whether the six members of the GCC are ready to form a viable currency
union applying three different methods. First, the Structural VAR procedure of Blanchard and
Quah (1989) for identification of demand and supply disturbances. Imposing the restriction of the
demand shocks having no permanent impact on output enables us to identify both demand and
supply shocks. The presence of significant positive shocks correlations among the prospective
economies may indicate a low cost for forming a currency union. We find that while supply
shocks are asymmetric (no significant positive correlations), demand shocks are symmetric. Since
supply shocks are the product of external factors and not domestic policies, they constitute better
indicators of the costs of forming a monetary union. Thus, lack of significant correlations lends
no support for the readiness of the GCC countries to establish a viable currency union.
Second, we test for the existence of long-run relationships of real GDP among all the
possible pairs of countries by conducting the Johansen cointegration tests. Sharing a common
trend signifies lower costs of establishing a currency union. Among the fifteen possible pairs of
countries we find that only four pairs are cointegrated while the rest are not. Hence, it seems that
the economic activities of the GCC members are not linked and more is to be done to enhance
their compatibility.
Third, since sharing a long-run common trend does not necessarily imply a short-run
synchronization we conduct the Vahid and Engle ( 1993) test for common serial correlation of the
business cycles for the four pairs of countries for which cointegration was detected. Common
business cycles is vital for a feasible currency union we conclude on the grounds of our findings
that the requirements for a successful union are not yet met.
Inline with most of the previous studies, the three methods employed here provide no
evidence of the readiness of the GCC members to establish a lasting and well functioning
currency union. Despite the remarkable progress that has been made in aligning monetary
policies and adopting the European convergence criteria, significant efforts are needed to align
the fiscal, financial, and political systems. Undoubtedly, the firm commitment of the leaders of
the GCC countries to further enhance economic integration among member states is considered
References
Abed, George T., Erbas, Nuri, Guerami, Behrouz, 2003. The GCC Monetary Union: Some
Considerations for the Exchange Rate Regime. IMF Working Papers 03/66. International
Monetary Fund.
Arnon, Arie, Spivak, Avia, 1996. Monetary Integration between the Israeli, Jordanian and
Palestinian Economies. Weltwirtschaftliches Archiv 132, 259-277.
Bayoumi, Tamim A., Eichengreen, Barry, 1994. Monetary and Exchange Rate Arrangements for
NAFTA. Journal of Development Economics 43, 125-165.
Blanchard, Olivier J., Quah, Danny, 1989. The Dynamic Effects of Aggregate Demand and
Supply Disturbances. American Economic Review 79, 655-673.
Buigut, Steven K., Valev, Neven T., 2005. Is the Proposed East African Monetary Union an
Optimal Currency Area? A Structural Vector Autoregression Analysis. World
Development 33, 2119-2133.
Dar, Humayon A., Presley, John R., 2001. The Gulf Co-operation Council: A Slow Path to
Integration? World Economy 24, 1161-1178.
Darrat, Ali F., Al Shamsi, Fatima S., 2005. On the Path of Integration in the Gulf Region.
Applied Economics 37, 1055-1062.
Fasano, Ugo, Schaechter, Andrea, 2003. Monetary Union Among Member Countries of the Gulf
Cooperation Council. IMF Occasional Papers 223. International Monetary Fund.
Hebous, Shafik, 2006. On the Monetary Union of the Gulf States. Working Paper 431. Kiel
Institute for the World Economy.
Horvath, Julius, Ratfai, Attila, 2004. Supply and Demand Shocks in Accession Countries to the
Economic and Monetary Union. Journal of Comparative Economics 32, 202-211.
Jadresic, Esteban, 2002. On a Common Currency for the GCC Countries. IMF Policy Discussion
Papers 02/12. International Monetary Fund.
Johansen, Soren, 1988. Statistical Analysis of Cointegration Vectors. Journal of Economic
Dynamics and Control 12, 231-254.
Laabas, Belkacem, Limam, Imed, 2002. Are GCC Countries Ready for Currency Union?
API-Working Paper Series 0203. Arab Planning Institute - Kuwait.
McKinnon, Ronald I., 1963. Optimum Currency Areas. The American Economic Review 53,
717-725.
Mundell, Robert A., 1961. A Theory of Optimum Currency Areas. The American Economic
Review 51, 657-665.
Sato, Kiyotaka, Zhang, Zhaoyong. (2005). Real Output Co-movements in East Asia: A
Cointegration Approach. Paper presented at the MODSIM 2005 International Congress
on Modelling and Simulation, Melbourne.
Sturm, Michael , Siegfried, Nikolaus, 2005. Regional monetary integration in the member states
of the Gulf Cooperation Council. Occasional Paper Series 31. European Central Bank.
Vahid, Farshid , Engle, Robert F., 1993. Common Trends and Common Cycles. Journal of
Applied Econometrics 8, 341-360.
World Bank, 2006. World Development Indicators. Available at
http://devdata.worldbank.org/dataonline. Washington, DC.
Zaidi, Iqbal, 1990. Monetary Coordination among the Gulf Cooperation Council Countries.
World Development 18, 759-768.
Table 1 – Real GDP Growth and Inflation – Means and Standard Deviations
Common Sample Individual Samples
Growth Inflation Growth Inflation
Mean Std Mean Std Mean Std Mean Std
Bahrain 5.17 3.85 1.52 7.41 5.17 3.85 1.52 7.41
Kuwait 0.65 20.76 3.26 14.08 1.36 17.18 5.54 18.85
Oman 6.78 5.51 1.53 12.89 9.63 13.22 4.78 19.35
Qatar 2.63 8.81 3.97 16.34 3.66 8.29 6.57 15.76
S. Arabia 2.40 4.71 2.63 11.20 4.80 7.13 6.62 16.88
Table 2 – Correlations of Real GDP Growth and Inflation
Bahrain Kuwait Oman Qatar S. Arabia UAE
Bahrain -0.092 0.129 -0.108 0.146 0.046
Kuwait 0.673* -0.078 0.395* -0.231 -0.103
Oman 0.550* 0.844* -0.256 -0.090 -0.117
Qatar 0.789* 0.772* 0.763* 0.078 -0.002
S. Arabia 0.680* 0.839* 0.803* 0.771* 0.445*
UAE 0.553* 0.682* 0.647* 0.691* 0.569*
Correlation coefficients for real GDP growth are on the upper triangle and inflation correlation coefficients are on the lower triangle.
Table 3 – ADF Unit Root Test Results (with intercept and trend) Levels First Difference
ADF p LM(4) ADF p LM(4)
Real GDP
Bahrain -3.22 1 0.12 -5.40*** 1 1.00
Kuwait -2.75 0 6.10 -4.61*** 3 1.47
Oman -2.37 1 7.02 -3.64*** 0 3.81
Qatar -0.95 0 4.69 -5.13*** 0 1.98
S. Arabia -3.32 0 2.30 -3.08** 0 3.87
UAE -2.38 1 3.09 -3.92*** 0 1.64
GDP Deflator
Bahrain -2.94 1 3.61 -4.07*** 0 3.48
Kuwait -1.15 0 2.73 -5.70*** 4 2.58
Oman -1.19 0 3.89 -4.99*** 0 4.08
Qatar -2.39 0 1.72 -4.58*** 0 1.16
S. Arabia -1.80 0 6.96 -3.53** 0 0.44
UAE -3.02 0 2.67 -5.64*** 0 3.24
Notes:
p is the optimal lag chosen by the SIC. Maximum lag allowed is 4. *, **, *** indicate significance at 10%, 5%, 1%, respectively.
Table 4 – Correlation Matrix of Supply Shocks§
Bahrain Kuwait Oman Qatar S. Arabia UAE
Bahrain 0.291 0.076 0.008 0.049 -0.107
Kuwait 0.291 0.051 -0.419* -0.040 0.095
Oman 0.076 -0.046 -0.107 -0.102 -0.113
Qatar 0.008 -0.457* -0.123 0.102 0.004
S. Arabia 0.049 0.131 -0.041 0.039 0.057
UAE -0.107 0.085 -0.218 0.061 0.081
§ Pairwise correlations are on the upper triangle and common sample correlations are on the lower triangle.
Table 5 – Correlation Matrix of Demand Shocks§
Bahrain Kuwait Oman Qatar S. Arabia UAE
Bahrain 0.569* 0.621* 0.815* 0.658* 0.415*
Kuwait 0.569* 0.758* 0.456* 0.374* 0.280
Oman 0.621* 0.755* 0.514* 0.680* 0.276
Qatar 0.815* 0.595* 0.704* 0.533* 0.406*
S. Arabia 0.658* 0.697* 0.775* 0.794* 0.234
UAE 0.415* 0.281 0.306* 0.406* 0.262
§ Pairwise correlations are on the upper triangle and common sample correlations are on the lower triangle.
Table 6 – Johansen Cointegration Tests
Country Pairs p Trace λλλλmax ββββ ααααi/ααααj
Bahrain-Kuwait 3 7.83 7.83
Bahrain-Oman 2 7.23 6.47
Bahrain-Qatar 1 8.57 8.56
Bahrain-S. Arabia 4 19.44** 19.44** 2.26*** 0.04/0.32***
Bahrain-UAE 4 12.39 11.9
Kuwait-Oman 1 14.38 8.66
Kuwait-Qatar 2 25.84*** 25.71*** 0.25* -0.58***/0.12
Kuwait-S. Arabia 3 17.71** 14.90** 1.50*** -0.07/0.89***
Kuwait-UAE 2 10.66 9.62
Oman-Qatar 1 5.57 5.5
Oman-S. Arabia 3 24.03*** 17.99** 1.90*** -0.19***/0.12
Oman-UAE 2 12.13 9.39
Qatar –S. Arabia 2 7.62 7.51
Qatar-UAE 1 11 10.66
S. Arabia-UAE 1 14.09 11.3
Notes:
The hypotheses for the trace tests are: H0: r=0 H1: r>0 while for the maximal eigenvalue test the hypotheses
are: H0: r=0 H1: r=1, where r denotes the number of cointegration vectors.
Table 7 – Test Results for Common Feature
Country pair S Degrees of Freedom
Canonical statistic λλλλ
Common Feature statistic C(p,s)
Critical values (5%)
1 6 0.64 9.48 12.59
Bahrain-S. Arabia
2 14 0.79 27.29*** 23.68
1 2 0.19 0.97 5.99
Kuwait-Qatar
2 6 0.75 23.85*** 12.59
1 4 0.37 4.23 9.49
Kuwait-S. Arabia
2 10 0.75 27.70*** 18.31
1 4 0.51 8.37* 9.49
Oman-S. Arabia
2 10 0.80 37.52*** 18.31
Notes:
S denotes the number of common features.
*, **, *** indicate significance at 10%, 5%, 1%, respectively.
Figure 1 – A positive demand shock in the AD-AS model
Y P
AD SRAS
LRAS
P0
Y0
AD1
P1
P2
Y1
E0
E1
Figure 2 – A positive supply shock in the AD-AS model
Y P
AD SRAS
LRAS
P0
Y0
E0
LRAS1
SRAS1
Y2
Y1
P1
P2
SRAS2
E1
Figure 3 –Price Level and Real GDP Cumulative Response to Demand Shocks
(a) Price Level
0 0.05 0.1 0.15 0.2 0.25 0.3
1 2 3 4 5 6 7 8 9 10 11 12 13 14 15
Year
BAH KUW OMAN QAT SAU UAE
(b) Real GDP
-0.03 -0.02 -0.01 0 0.01 0.02 0.03 0.04 0.05 0.06
1 2 3 4 5 6 7 8 9 10 11 12 13 14 15
Years
Figure 4 – Real GDP and Price Level Cumulative Response to Supply Shocks
(a) Price Level
-0.15 -0.1 -0.05 0 0.05 0.1 0.15 0.2 0.25
1 2 3 4 5 6 7 8 9 10 11 12 13 14 15
Years
BAH KUW OMAN QAT SAU UAE
(b) Real GDP
0 0.05 0.1 0.15 0.2 0.25
1 2 3 4 5 6 7 8 9 10 11 12 13 14 15
Years