Volume 71– No.9, May 2013
Performance Evaluation of Various Thresholding
Methods using Canny Edge Detector
Poonamdeep Kaur
Research Scholar
University college of Engineering, Punjabi University, Patiala
Raman Maini, PhD.
Professor
University college of Engineering, Punjabi University, Patiala
ABSTRACT
Edge detection is one of the most important and commonly used operations performed in image processing. Edges characterize object boundaries and are therefore useful for segmentation, registration, and identification of objects. In the thresholding method of edge detection, the gradient values of pixels exceeding a certain threshold are considered as edge pixels. In this paper different thresholding methods are used for determining a reasonable threshold value for canny edge detection algorithm and then results obtained are compared on the basis of visual inspection and quantitative parameters i.e. Mean Square Error (MSE) and peak Signal-to-Noise Ratio (PSNR). From experimental results it has been concluded that entropy based method achieves better performance than Otsu and Iterative threshold selection methods. So the results obtained by entropy-based thresholding approach are quite promising.
General Terms
Thresholding MethodsKeywords
Thresholding, MSE, PSNR, Entropy
1.
INTRODUCTION
Edge detection is very important field in image processing. It plays a fundamental role in higher level processing. Edge detection algorithm detects the presence and location of edges constituted by sharp discontinuities in images such as changes in color, intensity (or brightness) of an image. Edges are detected on the basis of relationship a pixel has with its neighbour pixel’s. Any pixel is said to be an edge if its surrounding gray values are rapidly changing. The main objective of edge detecting process is to extract the accurate edge line without changing the structural properties of the image. There is no universal edge detection method which works well under all situations. So a large numbers of edge detection operators available, each designed to be sensitive to certain type of edges and hence detection nature of different algorithms varies depending upon different situations. Many of edge detection algorithms such as Sobel, Prewitt and Robert are used for detecting edges which are based on gradient value and are called first order derivative based
methods. These methods are very sensitive to noise and miss some edges during edge detection procedure [7]. Edges can also be detected using second order derivative methods such as Laplacian, Laplacian of Gaussian methods. LoG requires large computation for a large edge detector mask. Laplacian method is also very sensitive to noise so probability of false and missing edges remain. Because of noise, low contrast, and some other factor edge detection methods that have been mentioned cannot give satisfactory results. Another important edge detector is canny algorithm which solves an optimization problem to detect the edges and also called optimal edge detector. This method is not easily disturbed by noise and can keep the good balance between noise and edge detection so it can detect the true weak edges as compared to other edge detectors [8]. Canny is assumed one of the best edge detectors so in this paper different thresholding techniques are compared using this optimal edge detector [2].
2.
THRESHOLDING
Thresholding is a non-linear operation that is used for image segmentation. It converts a gray-scale image into a binary image where the two levels are assigned to pixels that are below or above the specified threshold value T. So in thresholding pixels that are alike in gray scale (or some other feature) are grouped together.A thresholded image is given by the expression:
0 f(x, y) <T
g(x ,y) =
1 f(x, y)>=T
Volume 71– No.9, May 2013
2.1
Iterative Threshold Selection Algorithm
The iterative technique used for choosing a reasonable threshold value was developed by Ridler and Calvard. It is a very simple method used for automatic image thresholding. Like otsu’s thresholding method this is also a histogram based thresholding selection method. This approach assumes that the image is divided in two main classes such as background and foreground.
Threshold selection by iterative method is done in following steps [15]:
1. Initially a threshold value T is estimated and Average intensity of image is assumed as a good initial threshold value.
2. By using this threshold value T image is partitioned into two groups named G1 and G2 (i.e. foreground and background).
3. Calculate the sample mean 𝜇1 𝑎𝑛𝑑 𝜇2of grey values associated with the foreground and background pixels or groups G1 and G2.
4. Now select a new threshold value T such that value of T is the average of these two sample means 𝜇1 𝑎𝑛𝑑 𝜇2:
𝑇 = 1
2 (𝜇1+ 𝜇2)
Repeat the steps 2 to 4 until sample mean values 𝜇1 𝑎𝑛𝑑 𝜇2 do not change in successive iterations [11].
2.2
Otsu’s Thresholding Method
Otsu is a binarization algorithm named after its inventor Nobuyuki Otsu. Otsu’s method selects the threshold by minimizing the within-class variance of the two groups of pixels or in other words optimal threshold is selected by maximizing the between-class variance. It is histogram based thresholding method such that a threshold value is selected from gray- level histogram which results in reduction to binary image from gray-level image. It assumes a bimodal distribution of gray-level values such that image to be thresholded contain two classes of pixels (i.e., foreground and background).
Otsu's thresholding method iterates through all the possible threshold values and calculates a spread for the pixel levels on each side of the threshold, i.e. the pixels that either belongs to foreground or background. The basic idea is to find the threshold value where the sum of foreground and background spreads ((intra-class variance) is at its minimum [1].
An image is a 2D gray scale intensity function, and contains N pixels with gray levels from 1 to L. The number of pixels with gray level i is denoted fi, giving a probability of gray level i in an image of
P𝒊= fi N ... . . (1)
Let M × N is an image histogram with L intensity level, i.e. [0. . . L-1]. The number of pixels with gray level i is denoted 𝑛𝑖, such that
MN = L−1i=0ni … . . (2)
So probability of gray level i in an image is:
𝑃𝑖 = 𝑀𝑁𝑛𝑖 … . . . (3)
𝐿−1𝑖=0𝑃𝑖 = 1 , 𝑃𝑖 ≥ 0 … . (4)
Using a threshold say k pixels of image are partitioned into two classes say 𝐶1 and 𝐶2 (e.g., object and background) such that 0 < k < L-1, as threshold, T = k. The gray level probability distributions for two classes 𝐶1 (pixels in [0, k]) and 𝐶2 (pixels in [k+1, L-1]) are:
𝑃1 = 𝑃(𝐶1) = 𝑘𝑖=0𝑃𝑖 ,
Probability of class 𝐶1 .… . . (5) 𝑃2 = 𝑃(𝐶2) = 𝐿−1𝑖=𝑘+1𝑃𝑖 = 1 − 𝑃1
Probability of class 𝐶2 … . (6)
Means 𝑚1 and 𝑚2 for classes 𝐶1 and 𝐶2 respectively are given by following equations:
𝑚1= 𝑘𝑖=0𝑖 . P ( 𝑖 𝐶1) = 𝑖 𝑃 𝐶𝑃(𝐶1 𝑃(𝑖)𝑖
1) 𝑘
𝑖=0 = 𝑃1
1 𝑖 . 𝑃𝑖 𝑘
𝑖=0 … . . (7)
Where 𝑃 𝐶1 𝑖
= 1 , 𝑃 𝑖 = 𝑃𝑖 e 𝑃 𝐶1 = 𝑃1
𝑚2= = 𝑃1
2 𝑖 . 𝑃𝑖 𝐿−1
𝑖=𝑘+1 … . . (8)
Mean global intensity, 𝑚𝐺 :
𝑚𝐺 = 𝐿−1𝑖=0𝑖 . 𝑃𝑖 … . . (9)
While the mean intensity up to the k level, m:
𝑚 = 𝑘𝑖=0𝑖 . 𝑃𝑖 … . . (10)
Hence:
𝑃1𝑚1+ 𝑃2𝑚2 = 𝑚𝐺 … . . (11) 𝑃1 + 𝑃2 = 1
The global variance, 𝜎𝐺2 is given b :
𝜎𝐺2 = 𝐿−1𝑖=0(𝑖 − 𝑚𝐺)2 . 𝑃𝑖 … . (12)
Hence Between class variance of the thresholded image is defined by Otsu as:
𝜎𝐵2 = 𝑃1(𝑚1 − 𝑚𝐺)2+ 𝑃2(𝑚2 − 𝑚𝐺)2 = 𝑃1𝑃2(𝑚1 − 𝑚2)2
= (𝑚𝐺𝑃1 − 𝑚)2
𝑃1(1 − 𝑃1) … . . (13) The goodness of the choice T = k can be estimated by
following expression:
𝜂 = 𝜎𝐵2
Volume 71– No.9, May 2013 𝜂(𝑘) = 𝜎𝐵2(𝑘)
𝜎𝐺2 … . . (15) Where
𝜎𝐵2(𝑘) = (𝑚𝐺𝑃1 (𝑘)− 𝑚 (𝑘)) 2
𝑃1(𝑘)(1 − 𝑃1(𝑘)) . . (16)
Otsu stated that the optimal threshold t* is selected as [13]-[14]:
𝜎𝐵2(𝑘 ∗) = max0<𝑘<𝐿−1𝜎𝐵2(𝑘) . . (17)
2.3
Entropy Based Image Thresholding
Entropy is the basic concept used in information theory. It is the key measure of amount of information contained in a digit from the information source. It is defined in the context of a probabilistic model, Such that
𝐼 𝑋 = log [ 1/P(X)] = − log[𝑃(𝑋)] . . . . . (18)
Where I(X) is the self-information of event X which occurs with the probability P(X). Thus it is clear from above equation that amount of self information is inversely related to its probability. So If an event has probability P(X) = 1, we get no information from the occurrence of the event, i.e. I(X) = 0. Shannon entropy is the measure of mean information of information source and is denoted by S(X). Let set of source symbols with values in the set of integers {i =0 · · · k} where k=255
And probabilities is denoted by p where p = {p
1, p2, p3... pk }
such that 𝑘𝑖=0𝑝𝑖= 1 , 0 ≤ 𝑝𝑖 ≤ 1 condition must satisfied by this set of probabilities. Thus Shanon entropy is given by:
𝑆 𝑍 = − 𝑘𝑖=1 𝑝 ln( 𝑝𝑖) … . (19)
where pi is the probability that the observation at any site s = (x, y) 𝜖 S and k the total no of states. Shannon entropy has an additive property such that if a system can decomposed into two independent systems A and B then S(A + B) = S(A) +S(B) exists ,so it has been shown to be restricted to the Boltzmann-Gibbs-Shannon (BGS) statistics.
The Tsallis entropy is a generalization of the standard Boltzmann–Gibbs entropy and is a very useful extension for non-extensive physical systems. For set of all source probabilities 𝑃𝑖
With condition 𝑘𝑖=0𝑝𝑖= 1 Tsallis entropy is given by:
𝑆𝑞 𝑝𝑖 = 𝑞−11 (1 − 𝑘𝑖=1𝑝𝑖𝑞) … . (20)
Where real parameter q is called the entropic index that describes the degree of non-extensibility. In the limit a q → 1, the usual Boltzmann-Gibbs entropy is recovered, such that
𝑆𝐵𝐺 = 𝑆1 𝑝 = −𝑘 𝑘𝑖=1𝑝𝑖ln 𝑝𝑖 .. (21)
Tsallis entropy has a non-extensive property for statistical independent systems, defined by the following rule
𝑆𝑞 𝐴 + 𝐵 = 𝑆𝑞 𝐴 + 𝑆𝑞 𝐵 + 1 − 𝑞 . 𝑆𝑞 𝐴 . 𝑆𝑞 𝐵 … . . (22)
Consider a digital image f(x, y) such that x 𝜖{1,2,………M} and y 𝜖{1,2,………N} of size M×N histogram be h(i) with f as the amplitude (brightness) of the image at the real coordinate position (x, y). Let f(x,y) represents gray value of
the pixel located at the point (x, y). For the sake of convenience, we denote the set of all gray levels {0,1,2,3,4,5,……. ,255} as G(global threshold). Such threshold value is selected by using gray level histogram of the image method. The optimal threshold value denoted by t
*
is obtained by optimizing the function results from gray level distribution of the image.
Let t be the threshold value and B = {b0, b1} be a pair of binary gray levels such that b belongs to G and with value 0 and 1 respectively. if otherwise, . The result of thresholding an image function f(x, y) at gray level t is a binary function f
t(x,
y) such that 𝑓𝑡 𝑥, 𝑦 = 𝑏0 if 𝑓𝑡 𝑥, 𝑦 ≤ 𝑡 otherwise, 𝑓𝑡 𝑥, 𝑦 = 𝑏1
As we have observed, we have defined information strictly in terms of the probabilities of events. Therefore, let us suppose that we have a set of probabilities (a probability distribution) P = {𝑝1, 𝑝2, … … … . . 𝑝𝑘} for image with k gray-levels. From this we derive two probability distributions, one for the object (class A) and the other for the background (class B), given by: 𝑝𝐴∶ 𝑝𝑝1
𝐴 , 𝑝2 𝑝𝐴 , … … . . ,
𝑝𝑡 𝑝𝐴 , 𝑝𝐵 ∶ 𝑝𝑝𝑡+1
𝐵 , 𝑝𝑡+2
𝑝𝐵 , … … . . , 𝑝𝑘 𝑝𝐵 And Where
𝑝𝐴 = 𝑡𝑖=1𝑝𝑖 , 𝑝𝐵 = 𝑘𝑖=𝑡+1𝑝𝑖 ... (23)
The Tsallis entropy of order q for each distribution is defined as:
𝑆𝑞𝐴 𝑡 = 𝑞−11 (1 − 𝑡𝑖=1𝑝𝐴𝑞 ) And
𝑆𝑞𝐵 𝑡 = 𝑞−11 (1 − 𝑘𝑖=𝑡+1𝑝𝐵𝑞) … (24)
Allowing the pseudo – additive property as defined in equation (2), Tsallis entropy is formulated as the sum each entropy. Thus Tsallis entropy is dependent upon the threshold value t for both background and foreground We try to maximize the sum of entropies of two classes i.e., background class and object class. The luminance level t that maximizes the function is considered to be the optimum threshold value, when Tsallis entropy S
q(t) is maximized. Hence optimum
threshold value is
t* = Arg max𝑡=𝐺[𝑆𝑞𝐴 𝑡 + 𝑆𝑞𝐵 𝑡 + 1 − 𝑞 . 𝑆𝑞𝐴(𝑡). 𝑆𝑞𝐵(𝑡)] … . . (25)
The threshold value equals to the same value found by Shannon’s method when q→1. Thus this proposed method includes Shannon’s method as a special case[3]-[5].
3.
Canny Edge Detector
Volume 71– No.9, May 2013 once means single response to existing edge in an image such
that image noise should not create false edges[6]. Different steps of edge detection are given below.
1) First of all it suppress as much noise as possible which is a high frequency information that overlaps the original signal and introduces false edges. Hence smoothes the image by using Gaussian filter before detecting edges.
2) After removing noise and smoothing the next step is to calculate the gradient and direction at each point of the image. Generally Sobel operator is used for calculating approximate gradient and direction. The Sobel edge detector uses a pair of 3x3 convolution masks, one estimating the gradient in the x-direction (columns) and the other estimating the gradient in the y-direction (rows).Two 3x3 convolution masks are used such that one estimates the gradient in x-direction (columns) and other estimating the gradient in y-direction (rows). The magnitude of the gradient is then calculated using the formula:
G = Gx2+ Gy2 . (26)
An approximate magnitude can be calculated using:
G = Gx + |Gy| . . (27)
3) In the next step canny iterate through each pixel and their gradient value as well as the orientation of gradient at each point is checked. Such that the point at which gradient is not maximum are removed and not considered as a part of edge. So canny suppress the non-maxima pixels of edge in this step.
4) The last step of this algorithm is to threshold the candidate edges in order to keep only the significant ones. This detector uses the “hysteresis” method of thresholding instead of global thresholding. So two threshold values are applied on the suppressed image and hence edge pixels are detected[12].
4.
Experimental Results
This paper presents three threshold selection methods such as Otsu, Iterative and Entropy based technique for detecting edges efficiently. So Fig1, 2, 3, 4 and 5 shows the results obtained after implementing all the above methods on different test images in MATLAB environment.
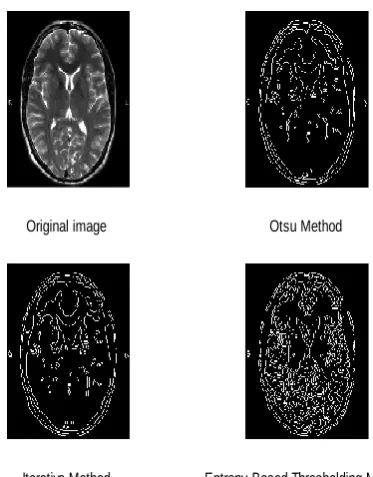
Fig 1: edge detection results by Otsu, Iterative and Entropy
based methods on brain image
Fig 2: edge detection results by Otsu, Iterative and Entropy based methods on hand image
Original image Otsu Method
Iterative Method Entropy Based Thresholding Method
Original image Otsu Method
[image:4.595.362.549.87.326.2] [image:4.595.312.545.90.648.2]Volume 71– No.9, May 2013
Fig 3: edge detection results by Otsu, Iterative and Entropy based methods on human spine image
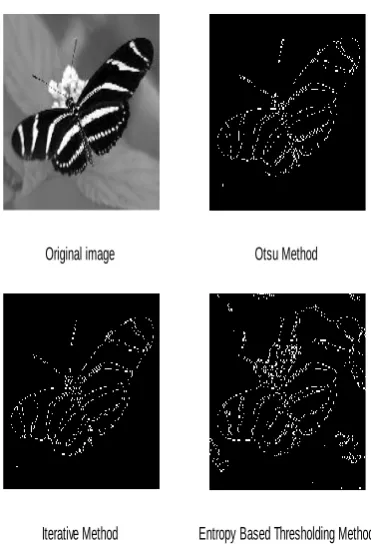
Fig 4: edge detection results by Otsu, Iterative and Entropy
based methods on butfly image
Fig 5: edge detection results by Otsu, Iterative and Entropy based methods on lung image
Original image Otsu Method
Iterative Method Entropy Based Thresholding Method
Original image Otsu Method
Iterative Method Entropy Based Thresholding Method
Original image Otsu Method
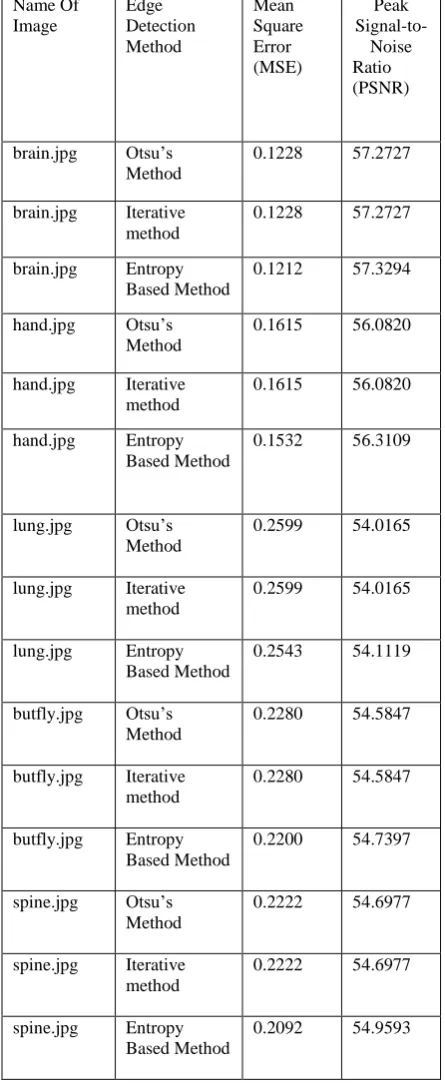
[image:5.595.339.559.70.374.2] [image:5.595.84.269.90.345.2] [image:5.595.83.269.424.697.2]Volume 71– No.9, May 2013 Table 1. MSE and PSNRvalues after implementing different
thresholding methods using canny edge detector on different images Name Of Image Edge Detection Method Mean Square Error (MSE) Peak Signal-to-Noise Ratio (PSNR)
brain.jpg Otsu’s Method
0.1228 57.2727
brain.jpg Iterative method
0.1228 57.2727
brain.jpg Entropy Based Method
0.1212 57.3294
hand.jpg Otsu’s Method
0.1615 56.0820
hand.jpg Iterative method
0.1615 56.0820
hand.jpg Entropy Based Method
0.1532 56.3109
lung.jpg Otsu’s Method
0.2599 54.0165
lung.jpg Iterative method
0.2599 54.0165
lung.jpg Entropy Based Method
0.2543 54.1119
butfly.jpg Otsu’s Method
0.2280 54.5847
butfly.jpg Iterative method
0.2280 54.5847
butfly.jpg Entropy Based Method
0.2200 54.7397
spine.jpg Otsu’s Method
0.2222 54.6977
spine.jpg Iterative method
0.2222 54.6977
spine.jpg Entropy Based Method
0.2092 54.9593
5.
Results and Discussion
First, in order to evaluate the performance of different thresholding methods, a test image of brain was taken for simulation purpose and different edge images of brain using Canny Edge Detection are generated corresponding to different threshold values obtained by implementing Otsu, Iterative and entropy based thresholding methods in MATLAB 7.0 as shown in Fig1. Table1 shows the
corresponding values of quantitative parameters (PSNR and MSE) after implementing these thresholding techniques in canny edge detector. The qualitative analysis and quantitative parameters are used as a reference for the purpose of comparison. From visual inspection, it has been observed that edges are clearly detected by Otsu’s method than iterative method which do not link all the regions of detected edges properly but these two methods are almost similar in their performance as shown in Table1, the MSE and PSNR values corresponding to these two methods are same for each image. This is so because when the sum of within-class variances is a unimodal function, the threshold of the iterative method is equal to Otsu threshold. Iterative thresholding method assumes an initial value of threshold while in the Otsu’s method we determine a global threshold that lies in the range [0,1]. Further from experimental results, it has been concluded that out of these three thresholding techniques, the performance of entropy based method is much superior as firstly in it we have divided the image into different regions and then optimal threshold value is calculated for each region instead of using only one threshold value. Secondly it also uses both Shannon and Tsallis entropy together to select optimal threshold value for edge detection. So in order to validate our results about the performance of the above thresholding methods, five different test images are considered. The performance of these thesholding methods is again examined. The results are shown in Fig 2-5. It has been observed from Table1 that Entropy based method produces less MSE (mean square error) and more PSNR (Peak Signal-to-Noise Ratio) as compared to Otsu’s and Iterative Methods. So from the experimental results, it has again been observed that the performance of the entropy based thresholding method is found to be more satisfactory for all the six test images than Otsu’s and iterative threshold selection methods.
6.
Conclusion
In this paper an attempt is made to evaluate the performance of different thresholding methods for detecting edges using optimal edge detector i.e. canny edge detector and also an effort is made to compare the results of these thresholding methods by implementing them in MATLAB environment using different test images. Comparison is done on the basis of visual inspection and quantitative parameters i.e. Mean Square Error (MSE) and peak Signal-to-Noise Ratio (PSNR). So Experimental results have demonstrated that Otsu and iterative are almost similar in their performance but the entropy based threshold selection method is superior in performance than these two thresholding methods as it is multithresholding based method. So it has been concluded from qualitative as well as quantitative parameters that entropy based method selects best threshold value for canny edge detector to achieve better edge detection results than other two methods.
7.
References
[1]Ping-Sung Liao, Tse-Sheng Chen and Pau-ChooChung “A Fast Algorithm for Multilevel Thresholding” Journel of Information Science And Engineering 17(5), pp. 713-727 (2001)
[2]N.Senthilkumaram, R.Rajesh, “Edge detection technique for image segmentation-A survey of soft computing approach” International journel of recent trends in engineering,Vol.1,No.2, pp. 250-254,May 2009
Volume 71– No.9, May 2013 Science and Engineering (IJCSE) Vol. 3 No. 6, pp
2224-2232, June 2011
[4]Mohamed. A. El-Sayed, S. Abdel-Khalek, and Eman Abdel-Aziz “Study of Efficient Technique Based On 2D Tsallis Entropy For Image Thresholding” International Journal on Computer Science and Engineering (IJCSE)
Vol. 3 Issue 9, p3125 ,September 2011
[5]Mohamed A.EI-Sayed “A New Algorithm Based Entropic Threshold for Edge Detection in Images ” IJCSI International Journal of Computer Science Issues, Vol. 8, Issue 5, No 1, pp 71-78 September 2011
[6] Parvinder Singh Sandhu, Mamta Juneja and Ekta Walia “Comparative Analysis of Edge Detection Techniques for extracting Refined Boundaries” International Conference on Machine Learning and Computing IPCSIT vol.3 ,2011
[7]Muthukrishnan.R and M.Radha “Edge Detection Techniques For Image Segmentation “International Journal of Computer Science & Information Technology (IJCSIT) Vol 3, No 6, 2011
[8] Sushil Kumar Singh, Aruna Kathane “Various Methods for Edge Detection in Digital Image Processing” International Journal of Computer Science and Technology (IJCST) Vol. 2, Issue 2, June 2011
[9]Jaskirat Kaur, Sunil Agrawal, Renu Vig “A Comparative Analysis of Thresholding and Edge Detection Segmentation Techniques” International Journal of Computer Applications Volume 39– No.15, pp. 29-34 February 2012 Web References
[10]http://itee.uq.edu.au/~elec4600/elec4600_lectures/1perpag e/lectanal4.pdf
[11]http://www.google.co.in/url?sa=t&rct=j&q=&esrc=s&sou rce=web&cd=6&cad=rja&ved=0CFgQFjAF&url=http% 3A%2F%2Fwww.heppenstall.ca%2Facademics%2Fdoc %2F472%2FCIS472.Seminar03.Slides.1.ppt&ei=wbJhU eCJFMvqrQe5j4HgCg&usg=AFQjCNGDyqJ47tfj71CU 8T80s24bGr1mWQ&bvm=bv.44770516,d.bmk [12]http://users.utcluj.ro/~tmarita/IPL/IPLab/PI-L11e.pdf [13]http://www.cse.unr.edu/~bebis/CS791E/Notes/Thresholdi
ng.pdf
[14]http://homes.di.unimi.it/ferrari/ElabImm2011_12/EI2011_ 12_16_segmentation_double.pdf