http://dx.doi.org/10.4236/msce.2015.39004
How to cite this paper: Adham, B.I., El-Khair, H.M. and Siddig, M.A. (2015) Frequency Dependence of Atomic Diffusivity and Electrical Properties of Gum Arabic/Graphite Composite. Journal of Materials Science and Chemical Engineering, 3, 30-36. http://dx.doi.org/10.4236/msce.2015.39004
Frequency Dependence of Atomic
Diffusivity and Electrical Properties of
Gum Arabic/Graphite Composite
Bilquis Ibrahim Adham
1, Hatim Mohamed El-Khair
1,2, Mohamed Ahmed Siddig
1,3*1Department of Physics, Faculty of Science and Technology, Alneelain University, Khartoum, Sudan 2Department of Physics, Imam Mohamed Bin Saud, Riyadh, KSA
3Department of Medical Physics, National University, Khartoum, Sudan
Email: *[email protected]
Received 4 August 2015; accepted 5 September 2015; published 8 September 2015 Copyright © 2015 by authors and Scientific Research Publishing Inc.
This work is licensed under the Creative Commons Attribution International License (CC BY).
http://creativecommons.org/licenses/by/4.0/
Abstract
In this study, Gum Arabic (GA)/Graphite (Gr) composite material was prepared using solid state reaction method. The FTIR peaks obtained were referred to the binding of Gr with the active groups in GA, such as NH2, COOH, CHO, CNC (alkyl amine) and C=CH (aromatic monosubstitution). Atomic diffusivity of Gr in GA was calculated using simple model and was found to varied random-ly. This randomness might be due to the attachment of Gr with different active groups of GA. The addition of Gr results in improvement of the conductivity of GA to a far extend as it reaches the semiconductor range. The random variation in conductivities of the samples can be attributed to the effect of high frequency range, where the effect of phonon-electron is dominant. The samples subjected to the impedance spectroscopy (IS) for second and third time were acquired different diffusivities as well as conductivities. Such variations might indicate that IS was a processing tech-nique similar to thermal treatment since it boosted the Gr atomic diffusion.
Keywords
Composite, Electrical Properties, FTIR, Spectroscopy
1. Introduction
The composite material is made of two or more constituents with significantly different physical and chemical properties, which remain separate and distinct within the final structure [1] [2]. The conducting polymer
site material is desired to have a high dielectric constant and high dissipation factor in low and high frequency ranges, so that it can be used in charge storing devices [3]-[5].
The study of grain boundary diffusion is important for understanding of many metamorphic processes includ-ing the problems of mass transport, fluid-rock interactions, thermal history and crystal growth [6] [7]. The diffu-sion in graphite is most likely mediated by vacancies with an activation energy which is lower than that of infe-rential and the direct exchange mechanisms [8]. The exchange mechanism may appear to be advantageous since it does not depends on the creation of defects which is an energetically cost process. It has been found, however, that the activation energy of atomic exchange is very high in most cases. This is because during an exchange event large distortions are induced in the lattice. Defects on the other hand, can move through the lattice at a considerably smaller energy cost and thus defect mechanisms are believed to dominate the diffusion process in most solids. The single exception among covalent solids for which anon-defect mechanism is generally accepted to dominate diffusion is the case of graphite. This is based on comparison of diffusion data with theoretical cal-culations for graphite. However, these theoretical calcal-culations are empirical and subject to numerous uncertain-ties [8].
Polymers/graphite composites had been extensively investigated and it is being reported that their electrical properties are strongly influenced by the graphite particle size and structures as well as the polymer type [9].
In this work, samples of Gum Arabic (GA) with different amount of graphite (Gr) were prepared in order to study the effect of high frequency domain on the graphite electrical conductivity and atomic diffusivity of Gum Arabic (GA)/graphite (Gr) composite. In addition, Fourier Transformation Infrared Spectroscopy (FTIR) was performed for three time repeated impedance measurement.
2. Experimental
Solid state chemical reaction method had been adopted for preparing Gum Arabic (GA)/graphite (Gr) composite material. High grade graphite powder and high grade Gum Arabic supplied by Sudanese Gum Arabic Company. Bulky bullets were made using hydraulic manual compressor. Group of samples were contained 1 gram of GA and different wt% of graphite. Five different samples of GA with different concentration of Gr were prepared (see Table 1). The samples undergo electrical characterization using impedance spectroscopy (IS) and FTIR. The LCR and FTIR measurements were repeated several times in order to detect the effect of the high frequency electromagnetic fields on the atomic diffusivity and electrical conductivity of the samples. The experiments were performed at room temperature. To prepare a sample for FTIR, small amount of potassium bromide powd-er was added and compressed to a thin laypowd-er.
The IS measurements were performed using Quad Tech (1920) LCR meter impedance analyzer with fre-quency range 20 Hz to 1 MHz, while the FTIR results were obtained using the instrument of type Satellite FTIR serial No. 20010102.
3. Results and Discussion
3.1. Conductivity
[image:2.595.144.481.605.721.2]Impedance spectroscopy is a powerful method of characterizing many of the electrical properties of materials and their interfaces with electronically conducting materials. It may be used to investigate the dynamics of bound or mobile charge in the bulk or interfacial regions of any kind of solid or liquid material: ionic, semiconducting,
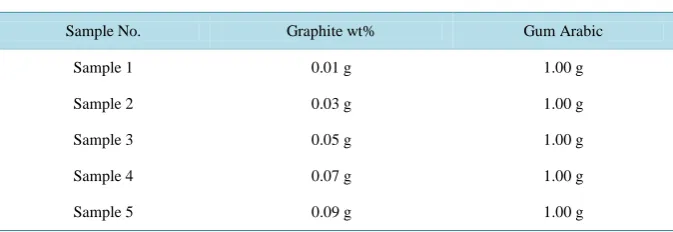
Table 1. The composition of Gum Arabic/Graphite composite samples.
Sample No. Graphite wt% Gum Arabic
Sample 1 0.01 g 1.00 g
Sample 2 0.03 g 1.00 g
Sample 3 0.05 g 1.00 g
Sample 4 0.07 g 1.00 g
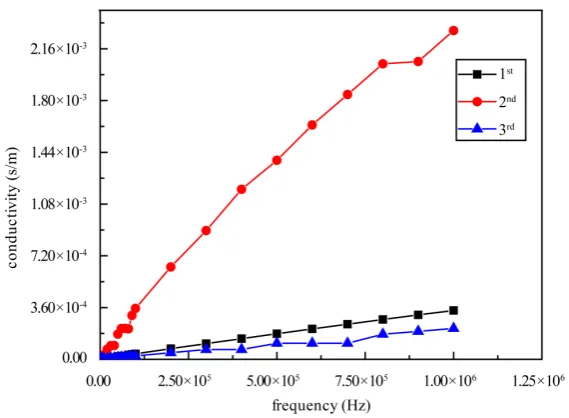
mixed electronic-ionic and even insulators [10].Figure 1andFigure 2 represent the conductivity variation with frequency for Samples 3 and 5, respectively. The samples were subjected to repeat IS measurements for first, second and third time. Significant shift is observed at high frequency range and such shifts were occurred in a random manner, which are concentration independent. At high frequency range thermal effect might be dominated and swing of Graphen sheets might occurred, such swing may cause random variation in conductivity [3]. On the other hand, thermal energy may generate lattice vibration in solid and hence creating thermal phonons and their interactions with free electrons give rise to polaron excitations, which are forming scattering center for conduct-ing electrons and hence resultconduct-ing in a random variation in conductivity. These effects had been observed in the conductivity of Sample 5 after being subjected to the third time impedance measurements which is correspond-ing with the decrease in conductivity. Whereas, the same sample subjected to second time impedance measure-ment had showed tremendous increase in conductivity [3] [11]. The IS measurements for the Samples 1, 2 and 4
Figure 1. Conductivity as a function of frequency at three steps of IS for Sample 3.
[image:3.595.171.456.486.695.2]had exhibited a significant conductivity shift at high frequency range (figures not shown). Concerning the shift order, it is clearly observed that the curve representing the first time impedance measurement of Sample 2 had acquired a highest conductivity compared with pure Gum. Whereas, the conductivity of other Samples 1, 3, 4 and 5 were lie below the conductivity of pure Gum. This result indicated that the increase and decrease in elec-trical conductivity is independent on graphite concentration gradients. Hence the variation of conductivity range might be due to the effect of electromagnetic field generated by LCR meter. Therefore, it seems to be an inter-ested attribution for considering the impedance characterization as a processing technique by which the conduc-tivity can be tuned [12]. These results may be supported by the fact that Graphene sheets might change from flat to flake like shape when it subjected to an external forces such as thermal or high frequency variations. These variations might lead to the flickering in geometrical orientation such that the plane is parallel or perpendicular to the electromagnetic field and hence suppressing or enhancing the electrical conductivity, respectively [11]. It is important to mention that the conductivity shifts depicted in Figure 2 had covered the range between 102 - 10−6 S/cm, which are corresponding with that of semiconductors [13].
3.2. Atomic Diffusivity
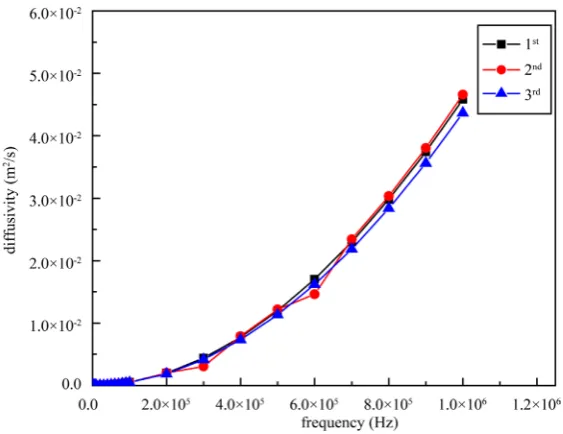
Direct access to diffusion of charged particles were obtained by IS, i.e. measurements of dc conductivities. The Nernst-Einstein equation
2 B
D=σK T Nq (1)
where N, particle density of charge carriers and q2, charge number. Equation one gives a direct relationship be-tween dc conductivity σ dc and the diffusion coefficient D[14]. Figure 3 and Figure 4 show the diffusivity as a function of frequency for Samples 3 and 5, respectively. It can be observed that the diffusivity demonstrated a wide variation with frequency. Such variations can be attributed to the random atomic distributions which lead to open vacancy and jump frequency. In Sample 3, see Figure 3, there is no significant shift observed and this might be due to the steady state diffusion or atomic diffusivity equilibrium obtained [7]. The steady state atomic diffusion occurred in the Sample 5 is found to be concentration independent even during the impedance mea-surement.
3.3. FTIR Spectroscopy
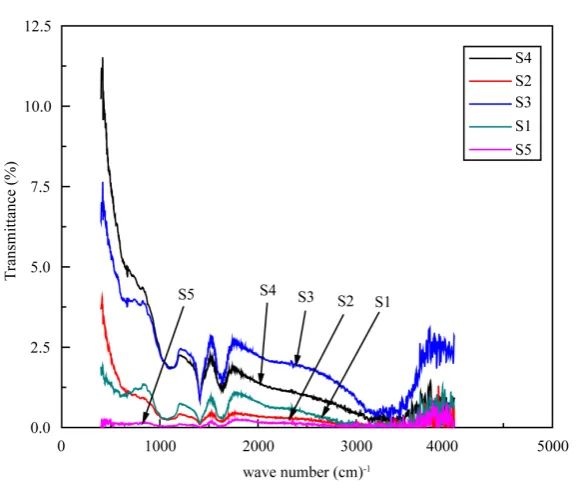
[image:4.595.174.456.478.695.2]To investigate the chemical functional groups on the GA/Gr, FTIR spectra were performed. Figure 5 shows transmittance as a function of wave number for all samples after the first step of IS. Graphite diffusion can be
Figure 4. Diffusivity as a function of frequency at three steeps of IS for Sam-ple 5.
Figure 5. The FTIR spectra of Gum Arabic/graphite composite at first step of IS for all Samples.
[image:5.595.170.459.333.577.2]for all samples except Sample 5, this type of bond might link graphite with carboxilic side of GA. The bond lo-cated at 1523 cm−1, which appears for Sample 5 only, can be referred to the strong bond =NH (CONH open chains), such bond might indicate graphite diffusion at the active amine group. Another peak had been detected at 1775 cm−1 for all samples but is slightly shifted to 1773 cm−1 for Sample 5, which is found to be correspond-ing with substitution of weak CHO, Aromatic CH, COOH and OH bonds, defincorrespond-ing the active groups in GA. This substitution may prove the graphite diffusion and the formation of these bonds.
FTIR data measurements that were subjected to IS measurement for the second time showed a significant chemical shifts (figure not shown). Newly detected peaks were found at 1036 cm−1 for Samples 1, 2 and 3 while was not observed in Sample 4 and 5. This peak indicates the strong C2HOH bond. Generally, significant chemi-cal shifts have been detected concerning most of the samples. These shifts had indicated an expectable chemichemi-cal bond stretching. Hence, the chemical shifts can be attributed to the thermal effect caused by the electromagnetic field, which is causing molecular swinging and further structural rearrangement. From the above results the im-pedance spectroscopy seems to be a processing technique especially at high frequency domain [12]. After the third step of IS, the chemical shifts were, also, observed and can be explained by that the peak located at 1614.8 cm−1 which appears for all samples are indicates to the Aromatic CH, COOH and NH2 which are medium bond. Another peak had been detected at 2365.61 cm−1 for Samples 1, 2 and 5, and this peak indicates the strong C≡N and C≡O medium bound.
4. Conclusion
The frequency dependence of atomic diffusivity and electrical properties of Gum Arabic/Graphite composite were studied using FTIR for three times repeated Impedance Spectroscopy (IS) measurement and indicated an expectable chemical bound stretching. The chemical shifts observed may be attributed to the thermal effect caused by the electromagnetic field, which in turn caused molecular swinging and further structural rearrange-ment. This could be due to IS processing techniques especially at high frequency domain. The conductivity was covered the range between 102 - 10−6 S/cm which was closed to that of semiconductor.
Acknowledgements
This work is supported by Materials Laboratory of Alneelain University, Khartoum, Sudan.
References
[1] Campbell, F.C. (2010) Structural Composite Materials. ASM International, USA, 1-29.
[2] Vasiliev, V.V. and Morozov, E. (2013) Advanced Mechanics of Composite Materials. 3rd Edition, Elsevier, Amster-dam, 1-27. http://dx.doi.org/10.1016/B978-0-08-098231-1.00001-7
[3] Panwar, V., Park, J.-O., Park, S.-H., Kumar, S. and Mehra, R.M. (2010) Electrical, Dielectric, and Electro-Magnetic Shielding Properties of Polypropylene-Graphite Composites. Journal of Applied Polymer Science, 115, 1306-1314. http://dx.doi.org/10.1002/app.29702
[4] Kim, B., Koncar, V. and Devaux, E. (2004) Electrical Properties of Conductive Polymers: Pet-Nanocomposites Fibres.
AUTEX Research Journal, 4, 9-13.
[5] Pieta, P., Obraztsov, I., D’Souza, F. and Kutner, W. (2013) Composites of Conducting Polymers and Various Carbon Nanostructures for Electrochemical Supercapacitors. ECS Journal of Solid State Science and Technology, 2, M3120- M3134. http://dx.doi.org/10.1149/2.015310jss
[6] Ganguly, J. (2002) Diffusion Kinetics in Minerals, Principles and Applications to Tectono-Metamorphic Processes.
EMU Notes in Mineralogy, 4, 271-309.
[7] Suzuki, A. and Mishi, Y. (2005) Atomic Mechanisms of Grain Boundary Diffusion Low versus High Temperatures.
Journal of Materials Science, 40, 3155-3161. http://dx.doi.org/10.1007/s10853-005-2678-0
[8] Kaxiras, E. and Pandey, K.C. (1988) Energetics of Defects and Diffusion Mechanisms in Graphite. Physical Review Letters, 61, 2693-2696. http://dx.doi.org/10.1103/PhysRevLett.61.2693
[9] Wang, W.P. and Pan, C.Y. (2005) Electrical Properties of Expanded Graphite/Poly (Styrene-Co-Acrylonitrile) Compo-sites. Journal of Physics and Chemistry of Solids, 66, 1695-1700. http://dx.doi.org/10.1016/j.jpcs.2005.07.003
[11] Kim, S.R., Poostforush, M., Kim, J.H. and Lee, S.G. (2012) Thermal Diffusivity of In-Situ Exfoliated Graphite Inter-calated Compound/Polyamide and Graphite/Polyamide Composites. Polymer Letters, 6, 476-484.
http://dx.doi.org/10.3144/expresspolymlett.2012.50
[12] Warlock Engineering (2004) Dielectric “Loss Factor” (e'') Measurement over RF Frequencies between 0.1 - 40.0 GHz for Common Organic Chemicals, 2-12. http://warlock.com.au
[13] Dhawan, S.K., Ohlan, A. and Singh, K. (2011) Designing of Nano Composites of Conducting Polymers for EMI Shielding. In: Reddy, B., Ed., Advances in Nanocomposites—Synthesis, Characterization and Industrial Applications, InTech, 319-381. http://dx.doi.org/10.5772/14752
[14] Heitjans, P. and Indris, S. (2003) Diffusion and Ionic Conduction in Nanocrystalline Ceramics. Journal of Physics: