Noise Removal using Empirical Mode Decomposition
and Wavelet Transform in Microarray Images
D.RamaKrishna
Assistant Professor, GIT,GITAM University, Visakhapatnam
J.Harikiran
Assistant Professor, GIT,GITAM University, Visakhapatnam
P.V.Lakshmi,
PhD. Professor, GITAMUniversity, Visakhapatnam
K.V.Ramesh,
PhD.Professor, GITAM University, Visakhapatnam
ABSTRACT
A Deoxyribonucleic Acid (DNA) microarray is a collection of microscopic DNA spots attached to a solid surface, such as glass, plastic or silicon chip forming an array. The analysis of DNA microarray images allows the identification of gene expressions to draw biological conclusions for applications ranging from genetic profiling to diagnosis of cancer. The DNA microarray image analysis includes three tasks: gridding, segmentation and intensity extraction. In this paper, a method for noise removal in microarray image using Bi-dimensional Empirical Mode Decomposition (BEMD) is presented. The BEMD decomposes the image into IMFs and residual components. Then, the selected high frequency IMFs are de-noised with wavelet model and finally the BEMD reconstruction gives the de-noised image. The experimental results show the proposed algorithm can perform significantly better in terms of noise suppression and detail preservation in microarray images.
Keywords:
Bi-dimensional Empirical Mode Decomposition, Image processing, Microarray.1.
INTRODUCTION
Microarrays, widely recognized as the next revolution in molecular biology, enable scientists to analyze genes, proteins and other biological molecules on a genomic scale [1]. A microarray is a collection of spots containing DNA deposited on the solid surface of glass slide. Each of the spot contains multiple copies of single DNA sequence [2].
Microarray expression technology helps in the monitoring of gene expression for tens and thousands of genes in parallel. During the biological experiment, the mRNA of two biological tissues of interest is extracted and purified. Each of the mRNA samples are reverse transcribed into complementary DNA (cDNA) copy and labeled with two different fluorescent dyes resulting in two fluorescence-tagged cDNA (red Cy5 and green Cy3). The tagged cDNA copies, called the sample probe, are hybridized with the slide’s DNA spots. The hybridized glass slides are fluorescently scanned at different wavelengths (corresponding to the different dyes used), and two digital images are produced, one for each population of mRNA. Each digital image contains a number of spots of various fluorescence intensities. The intensity of each spot is proportional to the hybridization level of the cDNAs and the DNA dots, the gene expression information is obtained by analyzing the digital images [3][4].
The processing of the microarray images usually consists of the following three steps: (i) gridding, which is the process of assigning the location of each spot in the image. (ii) Segmentation, which is the process of grouping the pixels with similar features and (iii) Intensity extraction, which calculates red and green foreground intensity pairs and background intensities.
The evaluation of microarray images is a difficult task as the fluorescence of the glass slide adds noise floor to the microarray image. The processing of the microarray image requires noise suppression with minimal reduction of spot edge information that derives the segmentation process. Thus the task of microarray image enhancement is of paramount importance.
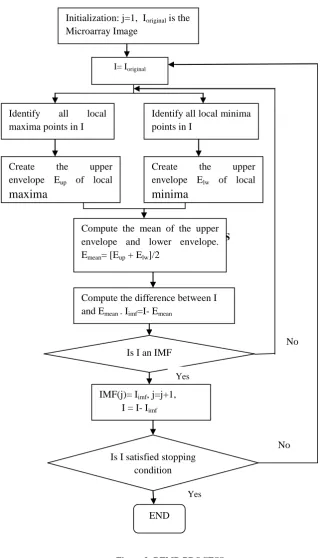
In this paper, we present noise removal method using Bi-dimensional Empirical Mode Decomposition Method. This method is used to deal with noise images which join a Gaussian White Noise. Then we use peak signal to noise ratio as a standard evaluation of the results of the de-noised images, Experimental results show that the proposed method has a better de-noising effect. The flow diagram of proposed method is shown in figure 1.
The rest of the paper is organized as follows. Section II presents Bi-Dimensional Empirical Mode Decomposition, Section III presents filtering Method using BEMD, Section IV presents experimental results and finally Section V reports conclusion.
2.
BI
-DIMENSIONAL
EMPIRICAL
MODE
DECOMPOSITION
The EMD proposed by Dr. Norden Huang [5], was a technique for analyzing nonlinear and non-stationary signals. It serves as an alternative to methods such as wavelet analysis and short-time Fourier transform. It decomposes any complicated signal into a finite and often small number of Bi-dimensional Intrinsic Mode Functions (IMF). The IMF is symmetric with respect to local zero mean and satisfies the following two conditions.
1.
The number of extrema and the number of zero crossings must either be equal or differ by one.The decomposition method in EMD is called Shifting Process. The shifting process of the two- dimensional signal such as image can be adapted from the one-dimensional signal as follows.
1. Let Ioriginal is defined as an image to be decomposed. Let j=1 (index number of IMF), I= Ioriginal (the residue).
2. Identify the local maxima and local minima points in I.
3. By using interpolation, create the upper envelope Eup of local maxima and the lower envelope Elw of local minima.
4. Compute the mean of the upper envelope and lower envelope.
Emean= [Eup + Elw]/2 5. Iimf = I- Emean.
6. Repeat steps 2-5 until Iimf can be considered as an IMF.
7. IMF(j)= Iimf, j=j+1, I = I- Iimf ,
8. Repeat steps 2-7 until all the standard deviation of two consecutive IMFs is less than a predefined threshold or the number of extrema in I is less than two.
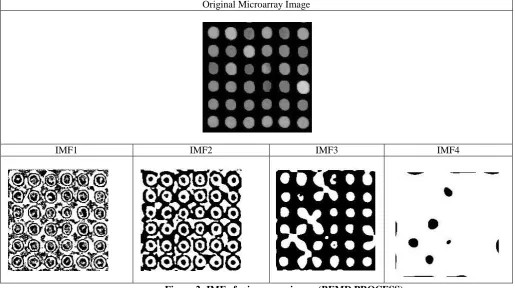
The first few IMFs obtained from BEMD contain the high frequency components which correspond to salient features in original image and the residue represents low frequency component in the image. The original image can be recovered by inverse BEMD as follows:
I = RES+
j
j
IMF
(
)
(1)
The BEMD process and IMFs of the microarray image are shown in figure 3 and figure 2.
3.
FILTERING
USING
BEMD
The filtering process using BEMD is summarized as follows: 1. The noisy image is firstly decomposed into IMFs
and residue components using BEMD.
2. After decomposition, we can see that the first few IMFs contain the large amount of noise (High Frequency Components).
3. The wavelet transform [6] is applied to filter these first few IMFs, to improve the visual quality of the image. To reduce noise, we just reject all values lower than a specified threshold in the extrema points of the IMFs.
Thereafter wavelet reconstruction algorithm is applied to obtain the IMF image.
TYPES
OF
THRESHOLDS
: 1.Universal
Threshold
:The universal threshold can be defined as:
T = σ√(2logn) (2)
Where N is the size of the image and σ being the noise variance. It is the optimal threshold in the asymptotic sense and minimizes the cost function of the difference between the function. The universal threshold may give a better estimate for the soft threshold if the number of samples is large [7].
2. SURE Shrink:
A threshold based on Steins Unbiased Rise Estimator (SURE) is called a SURE shrink [8]. The method specifies a threshold value T for each resolution level 'j' in the wavelet transform which is referred to as level dependent thresholding.
The goal of SURE shrink is to minimize the mean squared error defined as
(3)
Where Z( x , y ) is the estimate of the image, whileS( x , y ) is the original image without noise and 'n' is the size of the image.
The SURE shrink threshold is defined as: T = min ( t , σ√(2logn) ) (4)
Where 't' denotes the value that minimizes Steins Unbiased Risk Estimator, σ is noise variance computed from equation (12) and 'n' is the size of the image.
3.
Bayes
Shrink
:In Bayes shrink [9], an adaptive data driven threshold is used for Image Denoising. The wavelet coefficients in a sub-band of a natural image can be represented effectively by a generalized Gaussian distribution.
The Bayes threshold (T) is defined as: T = σ2/σs (5) Where 'σ2' is the noise variable and 'σ
s' is the Image variance without noise.
The noise variance σ2
With σ2 and σ
s2, we calculate the Bayes threshold T.
4.
Normal
Shrink
This section describes the method for computing the various parameters, which are used to calculate the threshold value (T). The Normal Shrink Threshold (T) [10] is adaptive to different sub-band characteristics.
T = ( βσ2/σ y ) (10)
Where β = √log( Lk/J ), 'Lk' is the length of the sub-band at 'k 'th scale.
σ2 is the noise variance, which is estimated from the sub-band HH, using the formula:
(12) Where 'yij' is the sub-band HH.
4. EXPERIMENTAL
RESULTS
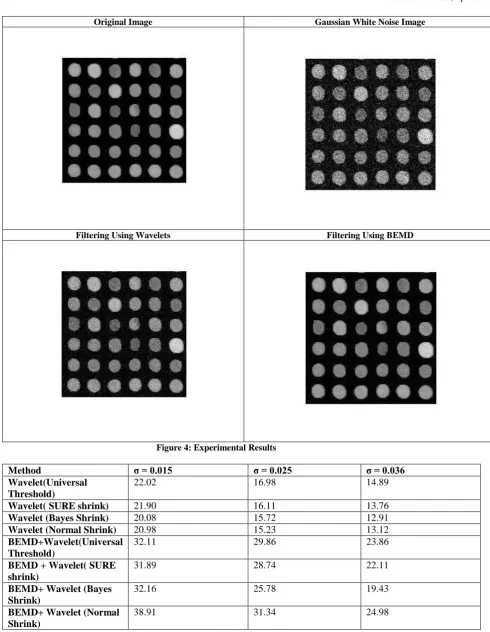
In this section, the proposed filtering method using is performed on a sample microarray slide that has 48 blocks,
each block consisting of 110 spots. A sample block has been chosen and 36 spots of the block have been cropped for simplicity. The sample image is a 198*196 pixel image that consists of a total of 38808 pixels. The RGB colored image microarray image have been converted to grayscale image to specify a single intensity value that varies from the darkest (0) to the brightest (255) for each pixel shown in figure 4. Experimental results are evaluated using PSNR value are shown in table 1 and figure 4 show that the proposed method has a better de-noising effect.
5. CONCLUSION
In this paper, a method for noise removal in microarray image using Bi-dimensional Empirical Mode Decomposition (BEMD) is presented. The BEMD decomposes the image into IMFs and residual component. Then, the selected high frequency IMFs are de-noised with wavelet model by using different thresholds and finally the BEMD reconstruction gives the de-noised image. The experimental results show the proposed algorithm can perform significantly better in terms of noise suppression and detail preservation in microarray images.
Figure 1: Flow Diagram of Filtering using BEMD
Noisy Image
B
E
M
D
(HF) IMF
(LF) IMF
Wavelet De-noising
Original Microarray Image
[image:4.595.40.556.74.362.2]IMF1 IMF2 IMF3 IMF4
Figure 3: BEMD PROCESS
Figure 3: BEMD PROCESS
No Identify all local
maxima points in I
Identify all local minima points in I
Create the upper envelope Eup of local
maxima
Compute the mean of the upper envelope and lower envelope. Emean= [Eup + Elw]/2
Create the upper envelope Elw of local
minima
Compute the difference between I and Emean . Iimf=I- Emean
IMF(j)= Iimf, j=j+1,
I = I- Iimf
Is I an IMF
Is I satisfied stopping condition
Initialization: j=1, Ioriginal is the
Microarray Image
END
I= Ioriginal
No
Yes
Original Image Gaussian White Noise Image
Filtering Using Wavelets Filtering Using BEMD
Figure 4: Experimental Results
Method σ = 0.015 σ = 0.025 σ = 0.036
Wavelet(Universal Threshold)
22.02 16.98 14.89
Wavelet( SURE shrink) 21.90 16.11 13.76
Wavelet (Bayes Shrink) 20.08 15.72 12.91 Wavelet (Normal Shrink) 20.98 15.23 13.12 BEMD+Wavelet(Universal
Threshold)
32.11 29.86 23.86
BEMD + Wavelet( SURE shrink)
31.89 28.74 22.11
[image:6.595.46.537.56.689.2]6. REFERENCES
[1] M.Schena, D.Shalon, Ronald W.davis and Patrick O.Brown, “ Quantitative Monitoring of gene expression patterns with a complementary DNA microarray”, Science, 270,199,pp:467-470.
[2] Wei-Bang Chen, Chengcui Zhang and Wen-Lin Liu, “An Automated Gridding and Segmentation method for cDNA Microarray Image Analysis”, 19th
IEEE Symposium on Computer-Based Medical Systems.
[3] Tsung-Han Tsai Chein-Po Yang, Wei-ChiTsai, Pin-Hua Chen, “Error Reduction on Automatic Segmentation in Microarray Image”, IEEE 2007.
[4] Eleni Zacharia and Dimitirs Maroulis, “Microarray Image Analysis based on an Evolutionary Approach” 2008 IEEE.
[5] N.E.Huang, Z.Shen, S.R.Long, “The empirical mode decomposition and the Hilbert Spectrum for non-linear and non-stationary time series analysis”. Proc. Roy. Soc, London.A, Vol.454, pp.903-995, 1998.
[6] Liu Xin-xia, Hau Fu-lian, Wang Jin-gui”, Wavelet Extended EMD Noise Reduction Model for Signal Trend Extraction”, 2009 IEEE.
[7] x.-P. Zhang and M. D. Desai, "Adaptive denoising based on SURE risk," IEEE Signal Process. Lett., vol. 5, no. 10, pp. 265-267, Oct. 1998.
[8] D. L. Donoho and I. M. Johnstone, "Denoising by soft thresholding", IEEE Trans. on Iriform. Theory, Vol. 41, pp. 613-627, 1995.
[9] T. D. Bui and G. Y. Chen, "Translation-invariant denoising using multiwavelets", IEEE Transactions on Signal Processing, Vo1.46, No.l2, pp.3414-3420, 1998.