Performance Analysis based Optimization with the Abet
of ANN and Genetic Algorithm
Girish Mohan Desai
PhD Scholar, Mech Dept. JJTU University
R.S.Jahagirdar,
PhD. Principal, IOK CollegeShikrapur, Pune
ABSTRACT
Currently many countries facing the one decisive problem, forces companies to look for appropriate approaches to optimize energy utilization and demand administration in increasing demand of electrical energy and the expenses which it imposes on the organization. Accordingly all the organizations are intended to start the centralized air conditioner method for maximum consumption for buildings like organizations, companies and colleges etc. All the electronic companies are invented to occurrence of both operations at a time in development of science technology. For detecting the environment temperature; as the scientists are formerly installed temperature sensor, this method is called automatic control. Existing techniques are given that the room required (cool and heat) temperature with only obtainable sources on particular environment, hence in our technique we use value engineering technique for the procedure of successful development. To offer increasing profitability all along with getting better product presentation and performing works in shorter durations is our final goal. Several environment sources are used, like natural water, natural gas and sea water for both operations. For generating data set and Genetic algorithm for optimization, I propose to use the Artificial Neural Network. At this point I expect to discover wherever possibility of available source is far above at that time that bulk of source is used for separate plan operation.
Keywords
Value engineering, Artificial Neural Network, Scheme specification, room temperature load, Scheme selection, Genetic Algorithm
1. INTRODUCTION
Value Engineering is a function oriented, systematic application of recognized techniques which identify the function of the product or service, establish a monitory value for that function and provide the necessary function reliability at the lowest overall cost [1]. Value engineering is another named in “Value management” and “Value control”. In general value engineering is applied to any product process procedure system or service in any kind of business or economic activity including health care, governance, construction, industry and in the service sector. Particularly added cost does not improve quality or the ability to perform the necessary functions, then value is decreased. [2].
The value engineering process consists of several phases, including the information phase, function analysis phase, creativity phase, evaluation phase, presentation phase and implementation phase. Creativity depends on the human brain and cannot be computerized easily by conventional Programming [3] [20]. In the stage of the function Evaluation, one of the most significant stages of the VE job plan, either the absolute evaluation by amount of money or the relative evaluation by rating is employed, to
evaluate the function of items and to determine the priority of improvement in the value [4].It has become a standard practice for many government agencies and private engineering firms and contractors since its first adoption in the 1950s [5]. It is applied in construction industry from 1960s Value engineering studies on a number of facilities were carried out, and more useful VE proposals (VEPs) were produced and applied. VEPs refer to the highly refined experts' knowledge, including the creative and innovative ideas produced by experts from a wide variety of fields [6].
The value analysis technique was subsequently introduced into construction by the US Navy and the Army Corps of Engineers circa 1963 through the adoption of incentive provisions and sharing clauses in construction contracts [7].Value engineering is to improve the performance outputs and Inputs, by having a conceptual approach to value engineering studies along with project management, project analysis, value analysis, and value management [8].The sustainable development of all the sources, development that fulfills the needs of the present generation without compromising the ability of the future generation to meet their own needs, regardless of setting aims because the continuation of the development is the most important aim[9].
With the growing increase in competition, in the most recent decades, companies sought to create higher value in their products for customers. Japanese companies, like Toyota, succeeded in doing so, with products of higher quality at a lower cost [10]. The VE application was only a decision of the project management. There was not the engagement of the Company Management. Although many of these applications were successful and the Company had good savings in this projects [19]. The application of Value Engineering (VE) in the construction industry has been observed in a number of countries around the world, and is recognized as one of the
most effective methodologies for achieving
‘best‐value‐for‐money’. [18].
A responsible allocation of the required resources is therefore essential and the cost efficiency needs to be optimized. The “Value” of a plant can be defined as the reliable performance of “functions” to meet customer needs at the lowest overall “costs”. [21]. It is mainly used for saving time, saving money, build teamwork and satisfy customer. It is help to learn improve your career skills and to get knowledge for comparing the process between organizations to other organizations. Its final result is improving quality along with eliminating unnecessary cost and without damages the essential functions and increasing efficiency.
and analysed regarding the proposed technique of the optimized solution. We improve the Genetic algorithm by neural network optimization presented in Section 3.
2. LITERATURE REVIEW BASED ON
EXISTING WORK
In 2010, Wei Tong Chen et al. [11] have discussed the Success of a value engineering workshop (VEW) depends on numerous interrelated factors. Unfortunately, some of these factors were overlooked by VEW teams. The proposed study applied factor analysis and the Analytic Hierarchy Process (AHP) to analyze a questionnaire survey distributed to experienced VE practitioners. A VEW performance assessment model was designed based on the data collected. The proposed model was used to assess two VEWs of a construction project to demonstrate its usefulness in performance assessment. Assessment results were analyzed, and suggestions were provided to improve VEW performance. Performance could be enhanced by using the proposed model for self-diagnosis, process improvement, and team motivation.
Value engineering (VE) programs are implemented to enhance the value received over the life-cycle of constructed assets. It was defined as the process of relating the functions, quality, and costs of the project in the determination of optimum solutions for the project. In 2011, Marzouk [12] has proposed the application of the ELECTRE III model in the context of value engineering. The steps of the ELECTRE III model include; estimation of concordance indices, estimation of discordance indices, estimation of credibility scores, performing distillation procedure, and performing complete ranking. The proposed methodology was intended to support the decision making on alternatives with an increase in the efficiency of the resolution process. A numerical example was presented to demonstrate the use of the proposed methodology.
In 2011, Fazel Zarandi et al. [13] have intended to assist the experts during the creativity phase of value engineering through utilizing the past experiences and avoid them in a specific domain from repeating the same experience. To the purpose, a general fuzzy case based reasoning (CBR) system was developed. Our system benefits from a fuzzy clustering model for fuzzy data to facilitate case retrieval and reduce the time complexity. The inherent analogical nature of a case-based reasoning (CBR) model and its integration with fuzzy theory would facilitate access to more precise and systematically classified information during a VE workshop. In order to test the performance of the proposed system, it was applied to suburban highway design data extracted from National Cooperative Highway Research Program (NCHRP).
In 2010,Haiwen Shu et al.[14] have described the district cooling and heating (DCH) system can provide both cooling and heating for blocks of buildings in cold climate areas, however, different thermal source schemes of a DCH project always differ in their first cost, operating cost, maintenance cost, regulation performance, control performance, energy-saving and environment protection performance, etc. It then elaborates on how the proposed model was applied in the first seawater source heat pump DCH project in Chinad Dalian Xinghai Bay project. The calculation results shows that even though the scheme of seawater source heat pump system was not economical under commercial electricity price mainly because of its relatively high initial cost, yet it has the highest value coefficient under civil electricity price. The proposed technique also implies that privileges of policy for renewable energy utilization system are necessary to help promote the
energy-saving and environment-friendly scheme of seawater source heat pump system.
The increasing demand of electrical energy and the overheads which it imposes on the organization, forces companies to search for suitable approaches to optimize energy consumption and demand management. Application of value engineering techniques was among these approaches. Value engineering was considered a powerful tool for improving profitability. These tools are used for reduction of expenses, increasing profits, quality improvement, increasing market share, performing works in shorter durations, more efficient utilization of sources and etc. In 2011,Habibollah Najafi et al.[15] proposed technique, they should review the subject of value engineering and its capabilities for creating effective transformations in industrial organizations, in order to reduce energy costs and the results have been investigated and described during a case study in Mazandaran wood and paper industries, the biggest consumer of energy in north of Iran, for the purpose of presenting the effects of performed tasks in optimization of energy consumption by utilizing value engineering techniques in one case study.
In 2006, Nader Naderpajouh et al. [16] have persented a fuzzy decision support system (DSS) to be employed in evaluation phase of VE. The proposed multi alternative decision model may be recommended where alternatives’ preferences ratios are different, and scores assigned to each alternative idea are uncertain. It utilized a VE has greater payoffs at the earlier stages of the construction projects, in which most of the criteria are still vague and not precisely defined, exploiting this DSS may result in more tangible model of decision making process and satisfactory outlook of VE studies in construction projects. A ranking methodology in a spreadsheet template was also provided to facilitate the ranking process.
In 2011, LI Lingyan et al. [17] have introduced a evaluation index system of value distribution is constructed. The value distribution calculation model was built, which was named Entropy-Fuzzy comprehensive evaluation model by utilize entropy and fuzzy comprehensive evaluation method. Furthermore, according to the market research data, the reasonable value distribution was discussed in order to provide a reference of comparative study on the value distribution of residential engineering for each city. The result implicates that the order of the reasonable value distribution was the construction value, the marketing value, the planning and design value, the investment analysis value, the service value, and the fund value, the land value.
In 2008, F. Jariri et al. [22] have proposed a need to incorporate three famous design cost management methods, called: Quality Function Deployment (QFD), Value Engineering (VE) and Target Costing (TC) into a single model had been addressed. Each method performs very well in cost management procedures as design activities. These methods had been incorporated into a mathematical programming model, in order to achieve the maximum benefit of each method. The model, essentially, optimizes customer satisfaction subject to target cost. The tool was a mixed integer zero-one nonlinear programming. The unified model has been proposed to prevent a non-optimal solution when methods interact with each other.
Also, to get the optimum set of activities, alternatives for cost saving and maximize the utilization of the available funds for new construction and maintenance works. The value engineering technique application is based on data collected from GAEB.
In 2011, Palanivel Subramaniyam et al. [24] have introduced trend emerging in the New Product Development (NPD) was the development of lean and six sigma activities. Material cost and design time had to be optimized in order to make the system effective and deliver the design at the shortest time of market with good quality. This proposed technique deals with the approach associated to optimization of above mentioned problems. It was done with the strategy of Six Sigma and philosophy of Lean by using Topology optimization.
3. METHODOLOGY BASED ON OUR
PROPOSED TECHNIQUE
3.1 Optimization for Proposed Technique
3.1.1 Artificial Neural Network
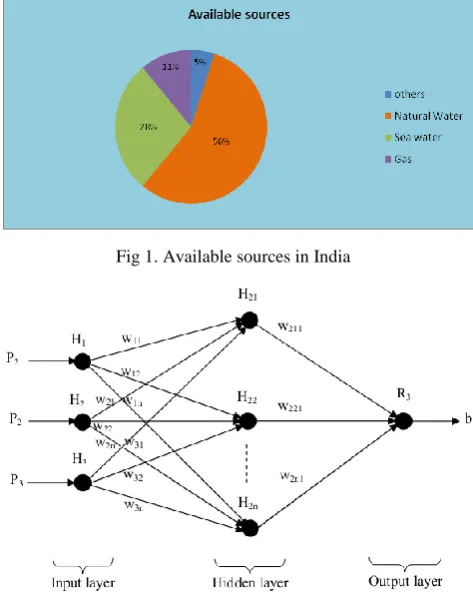
In Artificial Neural Network is made up of many artificial neurons and each of its input has the own weight associated with it. An artificial neuron is a device with many inputs and one output. The neuron has two modes of operation; the training mode and the testing mode. In the training mode, the neuron can be trained to fire (or not), for particular input patterns. In the testing mode, when a taught input pattern is detected at the input, its associated output becomes the current output. The available sources of the India environment mention below, [25], [26]
[image:3.595.309.547.157.241.2]Fig 1. Available sources in India
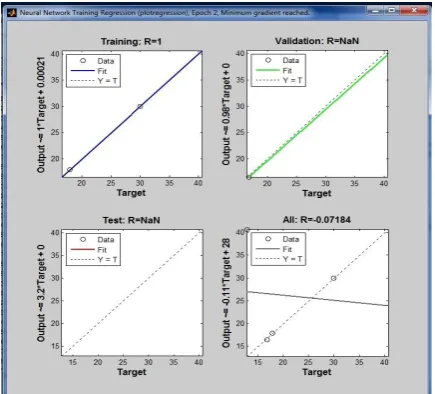
Fig 2 Artificial Neural Network
So here we have utilize many input one output model ANN. The inputs are environmental source, Area size and load (heating and cooling) applied to ANN, the output of the system is load corresponding cost.
[image:3.595.53.290.408.709.2]3.1.2 Artificial Neural Network_ In simulation
Setup
Fig 3. Artificial Neural Network for cooling and heating
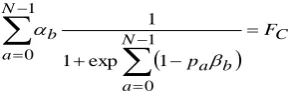
In Neural Network, the variable inputs are applied to the hidden layer. Many of the researchers to utilize the many input and many outputs model Neural Network. It is having two nodes they are training node and testing node. During the process happen the hidden layer output is fed to the output layer. This diagram is utilized for general operation for cooling and heating. In this, output is mainly based on the input parameters. This figure shows that basic function of the Neural Network. Cooling condition, initially utilize the algorithm parameters like Data division, Training, Performance and derivative are random, Levenberg-Marquardt, mean squared error and default. Then to set all the parameters like Time, gradient value, Mu and Validation checks, once after this setup process then click on the process performance. It will produce the best validation performance graph.
These are the images taken from the Matlab.
[image:3.595.314.535.466.611.2]3.1.2.1 Cooling Condition
Fig 4. Cooling performance
Fig 5. Cooling regression
Fig 6. Cooling Training state
This cooling process is done by the ANN, in this operation some initial setup to complete the process. Here some of the settings are Gradient, Mu and validation checks. In normal ANN techniques having some value on this parameter but our testing parameters value are exactly closes to all the parameters.
[image:4.595.315.536.67.460.2]3.1.2.2 Heating Condition
[image:4.595.317.535.71.268.2]Fig 7. Heating Performance
Fig 8. Heating regression
Fig 9. Heating Training state
Heating performance of the ANN having the training setup is exactly closes to the best validation performance of the Heating process. It is shows that our testing solution is approximately equal to the normal operation of the ANN. Heating Training state of the ANN having some initial setup for providing the proposed technique desired output.
Scheme Selection
Here ANN having the ten input parameters and two outputs. It is mainly on the selecting the best utilized scheme.
[image:4.595.56.279.539.719.2] [image:4.595.311.549.585.667.2]Fig 11. Scheme performance
Fig 12. Scheme regression
Fig 13. Scheme Training state
In this scheme section also having some initial setup for provides the best validation performance of Scheme selection. Here best validation performance is somewhat variant training performance. This is significant for selecting the scheme. If we achieve on this all the parameter value then only our system to be providing the original output.
[image:5.595.323.510.77.371.2]3.2 Genetic Algorithm
Fig 14. Flowchart for Genetic Algorithm
Generation of Chromosome
In generation of chromosomes is the function of the randomly generated set of chromosomes (set of genes). In our proposed technology we have to utilize the ANN output is fed to the GA. In this outputs are scheme selections, cost and loading factor of the adequate buildings.
Fitness Computation
Fitness computation is best way to finding the optimization solution on the chromosomes. In our proposed technology to applied all the information about Value engineering data. Here the output FC is based on the initial input of the GA.
C N
a
b a N
a
b F
p
1
0 1
0 1 exp 1
1
Selection
In all the chromosomes are producing the different fitness value. We have to select the minimum value of the fitness value chromosomes. They are called parent chromosomes. In our proposed technology to use the angle, the fitness value of the different angle is noted. We have to select the only minimum fitness value for fix the robotic arm.
Select the optimized chromosome = F C / 2
F C --- Count of total cost
Crossover
[image:5.595.353.498.527.573.2]Two point Crossover
[image:6.595.315.539.69.437.2]A crossover operates that randomly selects a crossover point within a chromosome then interchanges the two parent chromosomes between these points to produce two new offspring. When recombined the chromosomes avoids genes at the head and genes at the tail of a chromosome are always split.
Fig 15. Two point crossover
Mutation
Mutation is the function of the generating new offspring from the single parent and maintained the diversity of the each chromosome. There is a chance to get a gene of a child is changed randomly. This gene performance is better than the old parents. Mutation having two methods they are random and alternate method.
Fig 16. Mutation operation
In this technique we have to utilize the two point crossover method, which is producing the effective output for the mutation operation. Scheme selection and Total cost of the launching plants are under the crossover and mutation operation.
Overall layout
In our proposed technique we have to utilize the Artificial Neural Network and Genetic Algorithms for optimizing the launching plant cost along with improving the performance of the product
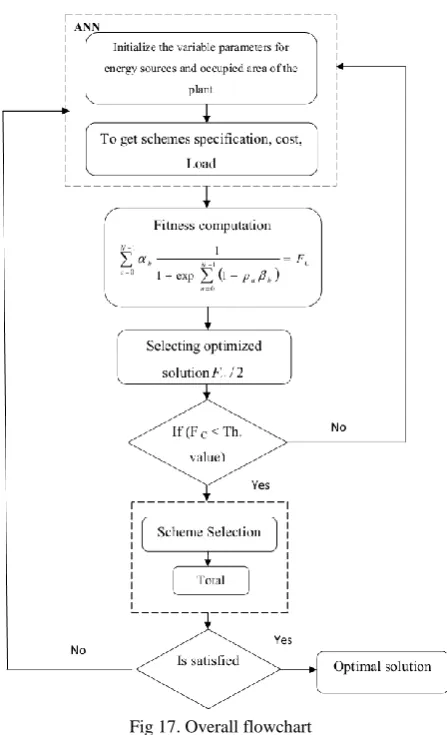
Fig 17. Overall flowchart
Initially, all the sufficient information about the whole buildings has to be collected. After that to be analysed all the needs like what amount of temperature in particular area and how much power load to be set to the used system. The changeable inputs are environment sources and engaged area of the buildings in this ANN. The overall process of the ANN is injected by these inputs. We have to place target value and finding error value before coming to the output side. Afterwards output side we have to collect the schemes specification under the function factor, total cost of the environment sources and sufficient cooling and heating load of the needed area of the buildings. This is concluding output for the Artificial Neural Network. All the output is fed to input of the Genetic Algorithms at that time.
[image:6.595.56.292.145.228.2]another is represented by 1, 3, 5, 7 and 9, which can be interpreted as equally important, slightly important, obviously important, strongly important and absolutely important correspondingly. Therefore 2, 4, 6 and 8 are the medium values of each neighboring pair of higher than odd numbers respectively. Within this case the highest characteristic root of the final judgement matrix ( ) is 10.571, the consistency
index (CI) is 0.0634 and the random index (RI) is 1.49, thus the consistency ratio (CR) is 0.0426 (<0.1). Thus the matrix has adequate consistency. The first cost, system operating cost and system maintenance cost produces the total cost. Due to area of the system and related Loading factor, this cost of the system is varied. But the optimize solution is fulfilled for all environment that is the output of our planned technique.
Objective function for output performance
a ab
b P W
R . (1)
b b
th
b F R t
Q (2)
a b ab
ab W LRe P
W * . . (3)
b
b b
b
b
Q
Q
d
Q
e
.
1
.
(4)
b b c bc
b Q Q e W
e 1 . . (5)
* **
* 1 . . .
ab ab b
b ab
ab W M LRe P MW W
W (6)
c a a
C F
V (7)
a u
A P f ab v b b
a 1,2,....,
1
(8)
a a a f fF (9)
DF R DF M DF O C
TC i sum sum (10)
T T sum dr dr dr DF 1 1 1
dr
TDF 1 1 RF TC
EUAC (11)
1
1 1 T T dr dr dr RF
a a EUAC EUACC (12)
System operating cost
R C R E. q /q
(13)
B h B E. q /q
(14)
R R C R T q q
(15)
B B h B T q q
(16)
R R E R . /T
(17)
B B E
B
./
T
(18)
RN
R R
RN
ERR I T I
I
.
. . (19)
p R R R N I P v T II . 1 (20)
CT R R R N CT CT v T II . 1 (21)
v T
I
IB B.N B B 1 B (22)
v T
G
GfB fB.N B B 1 B (23)
S.N
E.B/1000S G
G (24)
CT R R CT R N CT CT W v v T
G . 0.02 . 1 (25)
System maintenance cost
f C
Cd i (26)
r Tf 1 /
(27)
Where
a, b- each of inputs and layers respectively a
P - athinput of network ab
W - established weight b
R - Internal value of the operation
b
t
- established threshold valueb
Q - Resulting output th
F - Activation function LR- Learning Range
b e - Error
M- Momentum factor a
V - Value Coefficient a
F - Function coefficient a
C - Total cost coefficient a
f - Accumulated total function score of scheme a b
P - Weight coefficient ab
A - Score of the function factor b
TC - Total cost
O - Operating cost
sum
DF - Sum of discount factor M - Maintenance cost OPERATION R- Residual value
DF - Discount factor
dr - Discount rate (assumed to be 8%) L – System service life (assumed to be 20 years)
EUAC - Equivalent uniform annual cost of scheme a
RF- Capital recovery factor
R E.
-equivalent full load hours in summer (h) BE.
-equivalent full load hours in winter (h)
C
q -annual cooling load (kJ/a) R
q -maximum cooling output of the chillers (kJ/h)
h
q -annual heating load (kJ/a) B
q -maximum heating output of the boilers (kJ/h)
R
-cooling load factor
R
T -annual accumulated cooling hours (h)
B
B
T -annual accumulated heating hours (h)
R
I
-annual electricity consumption of chillers/heat pumps (kWh)N R
I . -rated electric power of chillers/heat pumps (kW)
P
I -annual electricity consumption of condensing water pumps (kWh)
N I
I
. -rated electric power of condensing water pumps (kW)p
v
-number of condensing water pumpsCT
I
-annual electricity consumption of cooling towers (kWh)N CT
I . -rated electric power of cooling towers (kW) CT
v -numbers of cooling towers
B
I
-annual electricity consumption of auxiliary facilities for boilers or LiBr absorption chillers/heat pumps (kWh)N B
I
. -rated electric power of auxiliary facilities for boilers or LiBr absorption chillers/heat pumps (kWh)v - Number of boilers or direct fired LiBr absorption heat pumps.
fB
G -annual natural gas consumption of boilers or direct-fired LiBr absorption heat pumps (m3/h)
N fB
G . -rated natural gas flow rate of boiler or direct-fired LiBr absorption heat pumps (m3/h)
S
G -annual consumption of pressurized steam (t/h) N
S
G . -rated flow rate of pressurized steam (t/h)
CT W
G . -annual water consumption of cooling towers (m3/a)
N CT.
-rated water flow rate of cooling towers (m3/h)
d
C -annual depreciation cost
r
-residual rate4. RESULTS AND DISCUSSION
In order to give maximum utilizing of the energy sources, this section explained the experimental results of our proposed technique.
Only focussing on the Building size, available sources and adequate cooling and heating load of the entire building is done in our planned technique. Sufficient parameters are not to be considered for optimization based on the existing technique i.e., only focusing on the sufficient cost based on the complete size of the building. When area of the building is low or high the maximum resources are used to provide in this document. Now Table 1 is represents the experimental results and we can see the maximum using sources.
[image:8.595.49.553.380.550.2]Optimization cost between the existing and proposed technique in fixed area of the building
Table 1. Optimization cost between the existing and proposed technique in fixed area of the building
Sources
Existing technique [14] Proposed technique Building area Cooling load Heating load Cooling cost Heating cost Building area Cooling load Heating load Cooling cost Heating cost 0.56
20 105 150
24.26 29.93
20 105 150 24.26 29.93
120 115 70 120 115 70 24.39 29.86
96 127 78 96 127 78 24.123 29.658
90 100 55 90 100 55 23.9986 30.154
0.28
20 105 150
39.3 16.85
20 105 150 39.3 16.85
120 115 70 120 115 70 39.86 16.458
96 127 78 96 127 78 39.758 16.584
90 100 55 90 100 55 39.0256 16.845
0.11
20 105 150
44.24 12.83
20 105 150 44.24 12.83
120 115 70 120 115 70 44.19 12.99
96 127 78 96 127 78 44.39 12.69
90 100 55 90 100 55 44.02 12.7
0.05
20 105 150
58.2 17.85
20 105 150 58.2 17.85
120 115 70 120 115 70 58.37 17.6
96 127 78 96 127 78 58.02 17.73
90 100 55 90 100 55 58.12 17.86
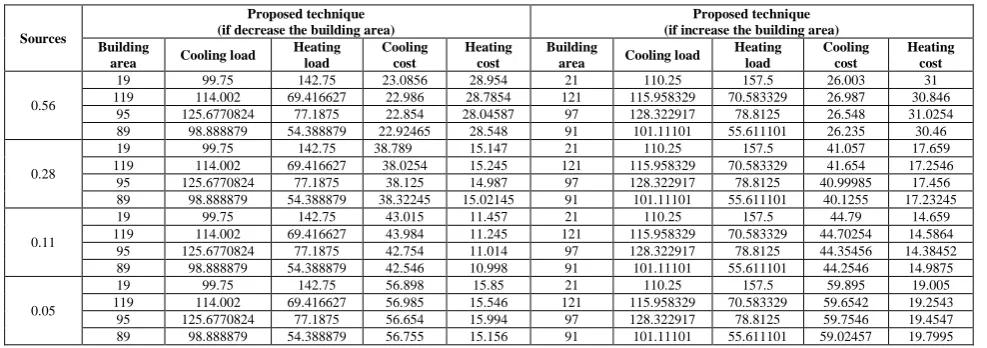
[image:8.595.53.547.589.763.2]Optimization costs for proposed technique in variable area of the building
Table 2. Optimization costs for proposed technique in variable area of the building
Sources
Proposed technique (if decrease the building area)
Proposed technique (if increase the building area) Building
area Cooling load
Heating load Cooling cost Heating cost Building
area Cooling load
Heating load Cooling cost Heating cost 0.56
19 99.75 142.75 23.0856 28.954 21 110.25 157.5 26.003 31 119 114.002 69.416627 22.986 28.7854 121 115.958329 70.583329 26.987 30.846
95 125.6770824 77.1875 22.854 28.04587 97 128.322917 78.8125 26.548 31.0254 89 98.888879 54.388879 22.92465 28.548 91 101.11101 55.611101 26.235 30.46
0.28
19 99.75 142.75 38.789 15.147 21 110.25 157.5 41.057 17.659 119 114.002 69.416627 38.0254 15.245 121 115.958329 70.583329 41.654 17.2546
95 125.6770824 77.1875 38.125 14.987 97 128.322917 78.8125 40.99985 17.456 89 98.888879 54.388879 38.32245 15.02145 91 101.11101 55.611101 40.1255 17.23245
0.11
19 99.75 142.75 43.015 11.457 21 110.25 157.5 44.79 14.659 119 114.002 69.416627 43.984 11.245 121 115.958329 70.583329 44.70254 14.5864
95 125.6770824 77.1875 42.754 11.014 97 128.322917 78.8125 44.35456 14.38452 89 98.888879 54.388879 42.546 10.998 91 101.11101 55.611101 44.2546 14.9875
0.05
19 99.75 142.75 56.898 15.85 21 110.25 157.5 59.895 19.005 119 114.002 69.416627 56.985 15.546 121 115.958329 70.583329 59.6542 19.2543
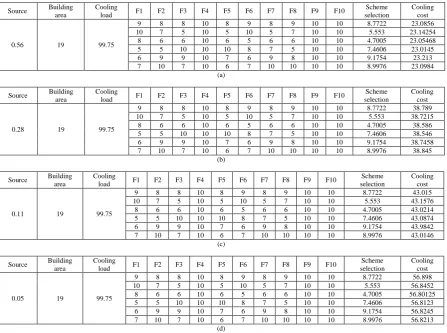
Cooling performance
Table 3. shows that cooling performance of a, b, c and d are Natural water, sea water, natural gas and others respectively
Source Building area
Cooling
load F1 F2 F3 F4 F5 F6 F7 F8 F9 F10
Scheme selection
Cooling cost
0.56 19 99.75
9 8 8 10 8 9 8 9 10 10 8.7722 23.0856 10 7 5 10 5 10 5 7 10 10 5.553 23.14254
8 6 6 10 6 5 6 6 10 10 4.7005 23.05468 5 5 10 10 10 8 7 5 10 10 7.4606 23.0145 6 9 9 10 7 6 9 8 10 10 9.1754 23.213 7 10 7 10 6 7 10 10 10 10 8.9976 23.0984
(a)
Source Building area
Cooling
load F1 F2 F3 F4 F5 F6 F7 F8 F9 F10
Scheme selection
Cooling cost
0.28 19 99.75
9 8 8 10 8 9 8 9 10 10 8.7722 38.789 10 7 5 10 5 10 5 7 10 10 5.553 38.7215
8 6 6 10 6 5 6 6 10 10 4.7005 38.586 5 5 10 10 10 8 7 5 10 10 7.4606 38.546 6 9 9 10 7 6 9 8 10 10 9.1754 38.7458 7 10 7 10 6 7 10 10 10 10 8.9976 38.845
(b)
Source Building area
Cooling
load F1 F2 F3 F4 F5 F6 F7 F8 F9 F10
Scheme selection
Cooling cost
0.11 19 99.75
9 8 8 10 8 9 8 9 10 10 8.7722 43.015 10 7 5 10 5 10 5 7 10 10 5.553 43.1576
8 6 6 10 6 5 6 6 10 10 4.7005 43.0214 5 5 10 10 10 8 7 5 10 10 7.4606 43.0874 6 9 9 10 7 6 9 8 10 10 9.1754 43.9842 7 10 7 10 6 7 10 10 10 10 8.9976 43.0146
(c)
Source Building area
Cooling
load F1 F2 F3 F4 F5 F6 F7 F8 F9 F10
Scheme selection
Cooling cost
0.05 19 99.75
9 8 8 10 8 9 8 9 10 10 8.7722 56.898 10 7 5 10 5 10 5 7 10 10 5.553 56.8452
8 6 6 10 6 5 6 6 10 10 4.7005 56.80125 5 5 10 10 10 8 7 5 10 10 7.4606 56.8123 6 9 9 10 7 6 9 8 10 10 9.1754 56.8245 7 10 7 10 6 7 10 10 10 10 8.9976 56.8213
(d)
[image:9.595.81.520.499.746.2]Heating performance
Table 4. shows that Heating performance of a, b, c and d are Natural water, sea water, natural gas and others respectively
Source Building area
Heating
load F1 F2 F3 F4 F5 F6 F7 F8 F9 F10
Scheme selection
Heating cost
0.56 19 142.75
9 8 8 10 8 9 8 9 10 10 8.7722 28.954 10 7 5 10 5 10 5 7 10 10 5.553 28.9015
8 6 6 10 6 5 6 6 10 10 4.7005 28.9456 5 5 10 10 10 8 7 5 10 10 7.4606 28.9565 6 9 9 10 7 6 9 8 10 10 9.1754 28.9423 7 10 7 10 6 7 10 10 10 10 8.9976 28.94789
(a)
Source Building area
Heating
load F1 F2 F3 F4 F5 F6 F7 F8 F9 F10
Scheme selection
Heating cost
0.28 19 142.75
9 8 8 10 8 9 8 9 10 10 8.7722 15.147 10 7 5 10 5 10 5 7 10 10 5.553 15.128 8 6 6 10 6 5 6 6 10 10 4.7005 15.098 5 5 10 10 10 8 7 5 10 10 7.4606 15.278 6 9 9 10 7 6 9 8 10 10 9.1754 15.013 7 10 7 10 6 7 10 10 10 10 8.9976 15.154
(b)
Source Building area
Heating
load F1 F2 F3 F4 F5 F6 F7 F8 F9 F10
Scheme selection
Heating cost
0.11 19 142.75
9 8 8 10 8 9 8 9 10 10 8.7722 11.457 10 7 5 10 5 10 5 7 10 10 5.553 11.498 8 6 6 10 6 5 6 6 10 10 4.7005 11.423 5 5 10 10 10 8 7 5 10 10 7.4606 11.4354 6 9 9 10 7 6 9 8 10 10 9.1754 11.442 7 10 7 10 6 7 10 10 10 10 8.9976 11.4576
Source Building area
Heating
load F1 F2 F3 F4 F5 F6 F7 F8 F9 F10
Scheme
selection Heating cost
0.05 19 142.75
9 8 8 10 8 9 8 9 10 10 8.7722 15.85 10 7 5 10 5 10 5 7 10 10 5.553 15.8456
8 6 6 10 6 5 6 6 10 10 4.7005 15.8256 5 5 10 10 10 8 7 5 10 10 7.4606 15.8425 6 9 9 10 7 6 9 8 10 10 9.1754 15.8459 7 10 7 10 6 7 10 10 10 10 8.9976 15.83256
(d)
[image:10.595.312.539.229.376.2]In above mentioned tabulation shows that finding the optimized scheme to launching the suitable location by utilizing the function parameters and different sources. Here building area and load are variable for both operations like heating and cooling operation. Function parameter having the ratings up to 10 due to the surrounding situation. During the scheme selection, mainly considered the function parameters of each scheme. Scheme selection also changing, it is depends on the source, area and function parameters. Each scheme having the some ranges up to 10. In this model we separate into the four schemes. The below mentioned diagram shows that the how to changing over scheme selection and corresponding cost due to changing function parameters, and load of the separate operation.
Fig 18. Matlab output
This model of diagram shows that the one part of operation is performed over the above tabulation mentioned. When execution process is happening under the matlab software mentioned on the above diagram. Here we have to put energy source, building area size and desired room temperature whether it is heating and cooling condition. The output of this technique is depending on the function parameters. This is sample model output for our proposed technique.
Desired building size
Fig 19. Existing technique
The aforementioned graph show that the existing technique cooling and heating performance of fixed building area size. Blue colour mentioned the cooling cost and Red colour mentioned the heating cost. Cost of this technique is unit of 106
yuan.
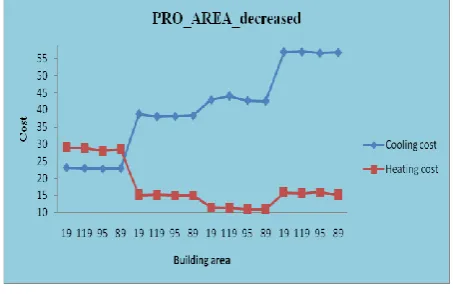
Variable building area
[image:10.595.54.293.309.457.2]Fig 20. Proposed area decrease
Fig 21. Proposed area increased
[image:10.595.56.285.580.725.2]Cost analysis
[image:11.595.55.283.78.213.2]Fig 22. cooling cost
Fig 23. Heating cost
[image:11.595.60.279.448.607.2]This afore mentioned graph, X axis represents the variable source and Y axis represents the adequate cost, it is comparison between existing and proposed techniques cost.
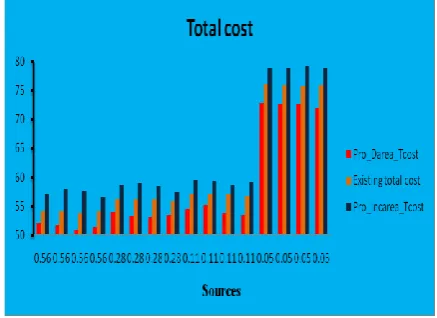
Fig 24. Total cost of existing and proposed technique
This aforementioned graph shows that the total cost of the all the sources utilizing the variable room area. Here the cost is depends on the building area and adequate load of cooling and heating purpose and mainly based on the available sources. In our technique is mainly for reducing the total cost if sources are easily available areas.
5. CONCLUSION
Only the existing sources on particular environment for providing room desired temperature is viewed in earlier techniques normally, i.e., Sea water source heat pump system: In Dalian Xinghai Bay project is launched in the middle-west
part of the seaside city of Dalian, China. Different type of source to use the particular system also uses the available sources in our proposed technique. Providing the needed temperature, it is introduced to launch the system all over in India. To produce more abundance at the same time raising the product performance and also using the existing source fully is the technique’s decisive aim. We have authority for the entire function factor for selecting the major used scheme to be launched to attain this process. Therefore we proved the presentation of the planned technique is tremendously superior to existing technique.
6. REFERENCES
[
1] Chougule Mahadeo Annappa and Kallurkar Shrikant Panditrao, “Application of value engineering for cost reduction – a case study of universal testing machine”, International Journal of Advances in Engineering & Technology,Vol.4, No.1, pp. 618-629, July 2012.[2] Malay Niraj, “Selection of Maintenance Practice through Value Engineering”, International Journal of Scientific & Engineering Research, Vol. 2, No.12, pp. 1-4, December-2011.
[3] M.H. Fazel Zarandi and Zahra S. Razaee, M. Karbasian, “A fuzzy case based reasoning approach to value engineering”, Department of Industrial Engineering, Amirkabir University of Technology, Tehran, Iran, Expert Systems with Applications Vol. 38, pp. 9334–9339, 2011.
[4] Shin'ya Nagasawa, “Application of Fuzzy Theory To Value Engineering”, Computers ind.Engg, Vol. 33, No. 3-4, pp. 565-568, 1997.
[5] Xueqing Zhang, Xiaoming Mao and Simaan M.
AbouRizk, “Developing a knowledge management system for improved value engineering practices in the construction industry”, Automation in Construction, Vol.18, pp. 777–789, 2009
[6] Seunghoon Lee, Changtaek Hyun and Taehoon Hong, “RETRIEVE: Remembering Tool for Reusing the Ideas Evolved in Value Engineering”, Automation in Construction, Vol.18, pp.1123–1134, 2009.
[7] Charles Y.J. Cheah and SengKiong Ting, “Appraisal of value engineering in construction in Southeast Asia”, International Journal of Project Management, Vol. 23, pp. 151–158, 2005.
[8] Hamid Tohidi, “Review the benefits of using Value
Engineering in Information Technology Project Management”, Procedia Computer Science, Vol.3, pp. 917–924, 2011.
[9] Alaa El Dean El-Alfy, “Design of sustainable buildings through Value Engineering”, Journal of Building Appraisal,Vol. 6,pp. 69–79,2011.
[10] UgoI busuki and Paulo Carlos Kaminski, “Product development process with focus on value engineering and target-costing: A case study in an automotive company”, Int. J. Production Economics, Vol. 105, pp. 459–474, 2007.
[12] Marzouk, "ELECTRE III model for value engineering applications”, Automation in Construction, Vol.20, pp.596-600, 2011
[13] Fazel Zarandi, Zahra S. Razaee and Karbasian, "A fuzzy case based reasoning approach to value engineering ", Expert Systems with Applications, Vol.38, pp.9334-9339, 2011
[14] Haiwen Shu , Lin Duanmu , Chaohui Zhang and Yingxin Zhu, "Study on the decision-making of district cooling and heating systems by means of value engineering" ,Renewable Energy,Vol.35,pp.1929-1939,2010
[15] Habibollah Najafi and Amir Abbas Yazdani, "Value Engineering and Its Effect in Reduction of Industrial Organization Energy Expenses”, World Academy of Science, Engineering and Technology, Vol.73, pp.235-241, 2011.
[16] Nader Naderpajouh, Abbas Afshar and Seyed Alireza Mirmohammad sadeghi, "Fuzzy Decision Support System for Application of Value Engineering in Construction Industry", International Journal of Civil Engineerng, Vol. 4 , No. 4,pp. 261-273, December 2006
[17] LI Lingyan, LIU Xiaojun and YAN Weicheng, "Study on the Reasonable Value Distribution of Residential Engineering on the Theory of Industrial Value Chain", Systems Engineering Procedia, Vol.1, pp.181–188, 2011
[18] Rahim Aminzadeha, Amirruddin Ismailb and Ishak Arshad, "Development Value Engineering Modeling in Construction Transportation", Australian Journal of Basic and Applied Sciences, Vol.5, No.12, pp.397-402, 2011
[19] Oscar Felizzola Souza, "Value Engineering In a Great Latin American Oil and Gas Company", Save International Conference Proceedings, pp. 379-378, 1998
[20] Don J. Gerhardt, "Managing Value Engineering in New Product Development", Managing Value Engineering in New Product Development.
[21] Tobias WALK, "Value Engineering Approach to increase Cost Efficiency", 7th Pipeline Technology Conference, Value Engineering Approach, 2012.
[22] F. Jariri and S.H. Zegordi, "Quality Function Deployment, Value Engineering and Target Costing, an Integrated Framework in Design Cost Management: A Mathematical Programming Approach", Scientia Iranica, Vol. 15, No. 3, pp.405-411, 2008
[23] M.A. Youssef, I.A. Mohammed, A.N. Ibraheem and I.M. Husseim, "Value Engineering Analysis for the Educational Buildings in Egypt", International Journal Of Optimization In Civil Engineering, Vol. 2, No. 1, 2012
[24] Palanivel Subramaniyam, Karthick Srinivasan and Muni Prabaharan, "An Innovative Lean Six Sigma Approach for Engineering Design", International Journal of Innovation, Management and Technology, Vol. 2, No. 2, pp. 166-170, April 2011
[25] Natural water availability:
http://cgwb.gov.in/documents/Ground%20Water%20Year %20Book%20-%202011-2.pdf
[26] Natural gas availability: