Performance Evaluation on EZW & SPIH Image
Compression Techniques
Shilpa Jaiswal
*, R.R Sedamkar
***
Electronics and Telecommunication, Thakur College Of Engineering and Technology Kandivali, Mumbai
**
Computer Engineering, Thakur College Of Engineering and Technology Kandivali, Mumbai
Abstract- The wavelet transform is widely used in image processing algorithms. In this paper two different wavelet compression techniques are applied on the image. The compression is performed using EZW and SPIHT wavelet based compression techniques. In compression, wavelets have presented a good flexibility to a wide range of data, while being of reasonable complexity. These techniques are more efficient and provide a better quality in the image. The techniques are compared by using the performance parameters Peak Signal to Noise Ratio (PSNR), Mean Square Error (MSE), Compression Ratio (CR) and Bit rate (BR) at different threshold. In the end the conclusion is observed to know which technique is better for image compression. It is observed that compression ratio for SPIHT is better as compared to compression ratio of EZW.
Index Terms- EZW, MSE, PSNR,SPIHT.
I. INTRODUCTION
mages contain large amount of trivial information and require large storage to store them in their raw form. The main objective of Image compression is to reduce this trivial data and store the image in a more efficient manner. Images can be thought of large array of pixel value, each pixel giving intensity values at that particular point. Therefore images having large and redundancies, and conversely images that have frequent and large changes in color will be less redundant and harder to compress.
Compression is an asset in communication as it reduces the amount of data that is required to be sent. Since the revolution of media mobile phones sending data to different networks on
limited bandwidth has been a concern. Tremendous
improvements in VLSI over the decade have bought smaller Charge Coupled Device (CCD) and hence higher resolution images. This has led the industry to find compression schemes to compress these images and hence we have higher resolution image which does not take much storage space. To achieve good compression ratio the image needs to be first transformed. This transformed image is stored and when we need to recover the image an inverse transform is applied and we can get the original image back. The types of transform are namely Fourier Transform, Discrete Cosine Transform, Hadamard Transform, Wavelet Transform and many more. All these transform have advantages and disadvantages. Out of this Transform wavelet Transform is used in achieving higher compression ratio while maintaining the image quality and mean square error.
II. IDENTIFY,RESEARCHANDCOLLECTIDEA
WAVELET AND IMAGE COMPRESSION
Image compression takes advantage of redundancies and reduces the overall size of the image so that it can be stored and transmitted efficiently. Image Compression techniques can be divided into two techniques namely lossless image Compression and Lossy Image Compression. The amount of information retained by an image after compression and decompression is known as the “energy retained”. If the energy retained is 100% then the compression is known as “lossless”, as the image can be reconstructed exactly. If any values are changed then energy will be lost and known as “lossy” compression. Lossless Compression is used in Medical and Technical images and also for archival data. Whereas, Lossy Compression is used in natural images, images that needs to be sent on a communication network.
Wavelet means “Small Wave” [1]. Wavelet Transform like Fourier Transform converts the time signal to a frequency signal using a set of basic functions. Wavelet unlike Fourier transform which uses trigonometric polynomials uses wavelets which are form from expansions and dilations of the Mother Wavelet. These wavelets have an added advantage in scalability property both in frequency and time domain. This permits a closer connection between the coefficients generated and the functions. Numerical stability and better manipulation is ensured. It can be shown that every Fast Fourier Transform (FFT) coefficients can be formulated using wavelet analysis providing better spatial and frequency information. Wavelet analysis has overcome lot of difficulties which were faced while using Fourier analysis such as how to relate the Fourier coefficients to a local scale. Wavelet is having an average value of zero and it can be defined over a finite interval. The process behind the wavelet transform is any arbitrary function (t) can be defined in the form of a superposition of a set of such wavelets or basis functions. These basis functions are simply called as the baby wavelets. These baby wavelets are obtained from the mother wavelets by scaling (contractions) and shifts (translations). The practical implementation of wavelet schemes Very similar to that of sub band coding schemes [1] [2] [3].
The typical Wavelet Compression and Decompression system as shown in figure 1 and figure 2.
Wavelet analysis can be used to divide the information of an image into approximation and detail sub-signals. The approximation sub-signal shows the vertical, horizontal and details or changes in the image. If these details are very small then they can be set to zero without significantly changing the image.
Wavelet Compression techniques takes advantage of this zeros as they can be eliminated without much loss to the quality of the image
2.1 EZW (Embedded Zero- trees of Wavelet Transform)
EZW proposed by J.M. Shapiro is a first lossy image compression algorithm which shows full power of wavelet based compression. It is simple, effective algorithm, having the property that the bits in the bit stream are generated in order of importance, yielding a fully embedded code [2]. The EZW algorithm is based on four principal concepts that is discrete wavelet transform or hierarchical sub-band de-composition, prediction of the absence of significantinformation across scales, entropy coded successive-approximation quantization, data compression using Arithmetic or Huffman coding.
2.1.1 Terms in EZW:
Embedded -An embedded coding is a process of encoding the transform magnitudes that allows for progressive transmission of the compressed image.
Zero-tree –Zero tree are a concept through which compression is achieved by allowing for a concise encoding of
the positions of significant values that result during the embedded coding process.
A wavelet transform transforms a signal from the time domain to the joint time-scale domain. This means that the wavelet coefficients are two-dimensional. If we want to compress the transformed signal we have to code not only the coefficient values, but also their position in time. When the signal is an image then the position in time is better expressed as the position in space. After wavelet transforming an image we can represent it using trees because of the subsampling that is performed in the transform. A coefficient in a low sub band can be thought of as having four descendants in the next higher sub-band (see figure 1). The four descendants each also have four descendants in the next higher sub-band and we see a quad-tree emerge: every root has four leafs. The EZW encoder is based on two important observations [5]: 1. Progressive encoding is used for compressive wavelet transformed images, since the higher sub-band only add detail. 2. Large wavelet coefficients are more important than small wavelet coefficients.
2.1.2. EZW ALGORITHM
The EZW Algorithm have the following steps. Step 1 (Initialization)
Threshold is initialized by where Cmax is the maximum of
the absolute value of the DWT coefficients. In EZW algorithm entire wavelet coefficient matrix is scanned in order to find out the maximum value of the coefficient [6]. We can infer from the computed coefficients for any image that maximum value of coefficient occurs at the lowest frequency sub band (LL band). We see that two passes are used to code the image. In the first pass, the dominant pass, the image is scanned and a symbol is outputted for every coefficient [7].
Step 2 (Dominant pass)
Coefficients on Dominant List are compared to T0 and their significance map is made.
The significance map can be efficiently represented as a string of symbols from a 4 symbols are used:
1. Zerotree root (t): If its absolute value is lower than threshold but one of its children has an absolute value higher than the threshold.
if (|xWT|< Ti)&& (all descendants of xWT< Ti)
2. Isolated zero (z): if its absolute value is lower than the threshold and all of its children have absolute values lower than the thresho1ld.
if (|xWT|< Ti) & ((some descendants of xWT> Ti) || (xWT is the last
item)).
3. Significant positive (p): if it is positive and has an absolute value higher than the threshold.
if (|xWT|>= Ti)&& (xWT> 0)
4. Significant negative (n): if it is negative and has an absolute value lower than the threshold.
if (|xWT|>= Ti)&& (xWT< 0)
All the values in the subordinate list are refined. This gives rise to some juggling with uncertainty intervals and it outputs next most significant bit of all the coefficients in the subordinate list. If the value is greater than the current threshold then a 1 is sent, if less than the threshold a zero is sent. The current threshold is then divided by two and the process is repeated till the threshold doesn’t reach the minimum bit value or zero. The decoding used is Huffman decoding scheme. The code also involves the decoding of the coded EZW image to prove the validity of the encoding.
Step 4 (New threshold)
We calculate the new threshold .if the minimum threshold or the desired compression ratio is attained, we stop; if not we repeat stages 2, 3 and 4.
III. WRITEDOWNYOURSTUDIESANDFINDINGS
2.1.3 IMPLEMENTATION
The EZW Algorithm was implemented using MATLAB.
2.1.3.1 Initialization
The image is first read in MATLAB and its pixel values are stored. Than a Discrete Wavelet Transform is done on the image of level 4. The following diagram gives an example. Now we have Cmax=1255.
Fig2.1 Morton Scanning.
2.1.3.2 Dominant Pass:
The image is then compared with the threshold. The coefficients are obtained using Morton scanning. The encoded data of the image is shown below.
ppppptppppztztzzzzttztztztztpttpt…..
2.1.3.3 Masking.
For obtaining Zero tree coefficients we have used an algorithm for masking the coefficients to check whether it is a zero tree or an isolatedzero. If during the Morton scan if a value less than threshold is encountered then we place a mask on the daughter trees. The values of the mask are compared with the threshold and if they’re less than the threshold then the pass is a zero tree pass if not then it is an isolated zero.
Fig 2.3
2.1.3.4 Subordinate pass:
The Dominant pass is passed through a refinement pass. This converts the dominant pass values into bit format. The previous values have to be stored to be read again and added to the new values. An example is shown below.
11100011100101011……
2.2 SPIHT (Set partitioning in Hierarchical tress)
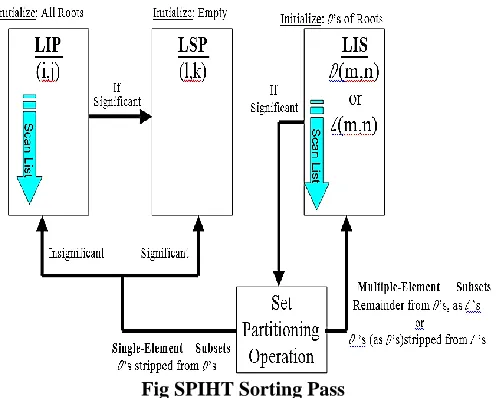
SPIHT algorithm is refined version of EZW algorithm proposed by A. Said, Pearlman [8]. SPIHT stands for set partitioning in Hierarchical tress. Hierarchical tress refer to the quad-tress as defined in in EZW. The SPIHT coding is an improved version of the EZW algorithm that achieves higher Compression and better performance than EZW [9]. Initially we apply wavelet transform on the image and obtain the wavelet coefficient .Then coding is applied on the obtained coefficient. Set partitioning refer to the way these quad-trees divide up, partition and these coefficient at a given threshold. Thus SPIHT provides the best results of PSNR at higher ratios than EZW due to its partitioning property which increases its compressive power. Here the coding algorithm uses three lists called List of Significant Pixels (LSP), List of Insignificant Pixels (LIP) and List of Insignificant Sets (LIS).
LIS (list of insignificant sets): LIS contains set of wavelet coefficient which are defined by tree structures, and which had been found to have magnitude smaller than a threshold (are insignificant). The sets exclude the coefficient to the tree or all sub-tree roots and have at least four elements.
LIP (list of insignificant pixel): LIP contains individual coefficient and have magnitude smaller than the threshold.
LSP (list of significance pixel): pixel found to have magnitude larger than the threshold.
During the sorting pass, the pixels in the LIP, which are insignificant till the previous pass, are tested, and those that become significant are moved to the LSP. Similarly the sets in LIS are examined in order for significance and those which are found to be significant are moved from the list and partitioned. The new subsets with more than one element are added to the LIS and the single pixels are added to LIP or the LSP, depending upon their significance. During the magnitude refinement pass, the pixels in the LSP are encoded for nth MSB.
2.2.1 SPIHT ALGORITHM
Notation used in the algorithm are defined as follows: O(i,j): set of coordinates of all offspring of node (i,j); children only
D (i,j): set of coordinates of all descendants of node (i,j);
children, grandchildren, great-grand, etc.
H (i,j): set of all tree roots (nodes in the highest pyramid level); parents
L (i,j): D (i,j) – O(i,j) (all descendants except the offspring);
grandchildren, great-grand, etc.
Step 1 (Initialization)
n = log2 (max |coeff|) LIP = All elements in H LSP = Empty
LIS = D’s of Roots
Step 2 (Sorting Pass)
Step-2.1: For each entry in LIP, output the significance (“1” if significant “0” if not significant).If found significant remove it from the LIP and add to the LSP.
Step-2.2: For each entry in LIS, output the significance. If found significant output its sign.
Depending upon whether it is the D (n1, n2) set or the L (n1, n2) set perform the partitioning as:
If D ( i, j)is found significant ,partition it into L( i, j)plus four single element sets wih
( i, j) O ( i, j).
If L(i,j)is found significant, partition it into four set of D( i,
j) O( i, j).
According to the significance, update the LIS, LIP and LSP.
Step 3 (Refinement pass)
For each element in LSP-except those just added above output the nth most significant bit of coefficient.
[image:4.612.323.571.55.254.2]End loop over LSP
Fig SPIHT Sorting Pass
Step 4 (Quantization state update) Decremented by 1
Steps 2, 3 and 4 are repeated until n=0
It is the characteristic of SPIHT algorithm that it generally operates on an entire image at once.
Due to this the size of the three lists is often quite big and takes a lot of memory. The whole image is loaded and transformed, and then the algorithm requires repeated access to all lists [10].
2.2.2 Implementation (SPIHT)
Step 1 (Initialization)
The SPIHT parameters are initialized. LIP=[ (2, 3) (4,1) ( 2,3 ) . .]
LIS = [(0, 0) (0, 0) (0, 0) .. .] LSP = [ ]
Step 2 (Sorting Pass)
In the sorting pass each bit is compared with the threshold and stored in the respective list. A bit counter is assigned to stop the process once the limit has reached. The specific bit is removed from LIP and added to LSP.
LIP=[ (2, 4) (3,2) ( 4,2 ) (5, 1) (5, 3) ( 5, 4). .] LIS = [(8, 1) (1, 5) (1, 11) (1, 12) (2, 11) (2, 12).. .] LSP = [(1,2) (1,1)(2,1)(2,2)(1,3) (3,1).. ]
Step 3 (Refinement Pass)
The LSP list is used and for each value is refined. The value of 256, 14, and 7 are headers for the bit stream.
Out = [256 14 7 0 1 0 1 0 1 0 1 1 0 0] Step 4: (Update)
Updating the threshold value
B. Results
The results are found out by performing the compression and decompression on the image using MATLAB.
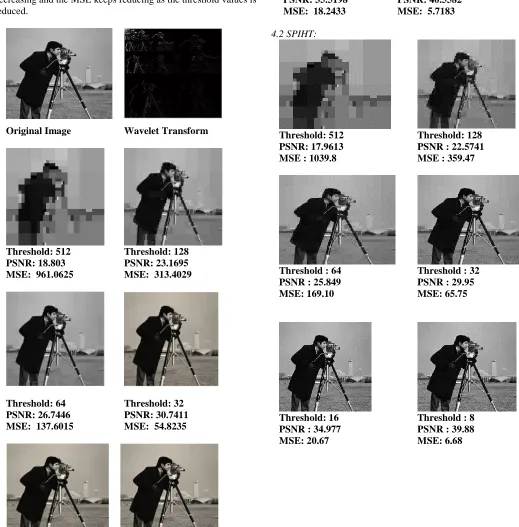
4.1 EZW
decreasing and the MSE keeps reducing as the threshold values is reduced.
Original Image Wavelet Transform
Threshold: 512 PSNR: 18.803 MSE: 961.0625
Threshold: 128 PSNR: 23.1695 MSE: 313.4029
Threshold: 64 PSNR: 26.7446 MSE: 137.6015
Threshold: 32 PSNR: 30.7411 MSE: 54.8235
Threshold: 16 Threshold: 8
PSNR: 35.5198 MSE: 18.2433
PSNR: 40.5582 MSE: 5.7183
4.2 SPIHT:
Threshold: 512 PSNR: 17.9613 MSE : 1039.8
Threshold: 128 PSNR : 22.5741 MSE : 359.47
Threshold : 64 PSNR : 25.849 MSE: 169.10
Threshold : 32 PSNR : 29.95 MSE: 65.75
Threshold: 16 PSNR : 34.977 MSE: 20.67
[image:5.612.42.561.64.591.2]Threshold : 8 PSNR : 39.88 MSE: 6.68
Table no. 1: Comparison of various values for EZW and SPIHT
Threshold EZW SPIHT
PSNR MSE BR CR PSNR MSE BR CR
8 40.56 5.718 0.026 3.46 39.9 6.68 0.089 5.16
16 35.52 18.24 0.016 5.61 35 20.67 0.048 8.089
0 100 200 300 400 500 600 15
20 25 30 35 40 45
Threshold
P
S
N
R
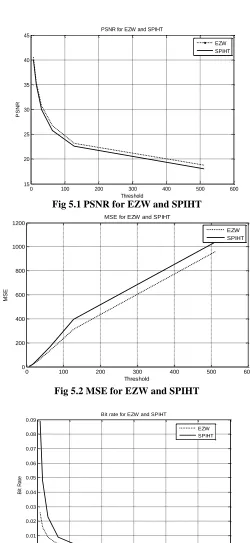
PSNR for EZW and SPIHT
EZW SPIHT
Fig 5.1 PSNR for EZW and SPIHT
0 100 200 300 400 500 600
0 200 400 600 800 1000 1200
Threshold
M
S
E
MSE for EZW and SPIHT
[image:6.612.179.429.114.657.2]EZW SPIHT
Fig 5.2 MSE for EZW and SPIHT
0 100 200 300 400 500 600 0
0.01 0.02 0.03 0.04 0.05 0.06 0.07 0.08 0.09
Threshold
B
it
R
a
te
Bit rate for EZW and SPIHT
EZW SPIHT
Fig 5.3 Bit rate for EZW and SPIHT
64 26.74 137.6 0.004 22 25.8 169.1 0.009 31.87
128 23.17 313.4 0.002 52.6 22.6 359.5 0.003 78.1
0 100 200 300 400 500 600 0
100 200 300 400 500 600 700
Threshold
C
o
m
p
re
s
s
io
n
R
a
ti
o
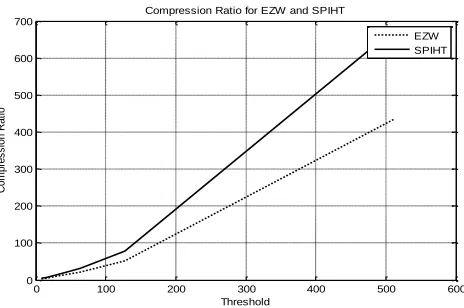
Compression Ratio for EZW and SPIHT
EZW SPIHT
[image:7.612.188.420.59.213.2]Fig 5.4 Compression ratio for EZW and SPIHT
IV. CONCLUSION
In this paper we have implemented two efficient algorithms EZW and SPIHT which have some common strength such as, depending on the requirement of the application, the encoding and decoding can be stopped and the desired output quality of image can be retrieved. Also each algorithm gives a significant data compression.
After implementing EZW & SPIHT algorithms we found following results:
5.1 EZW:
For threshold 8, 16, 32, 64, 128, 512 the respective bit rates are 0.0257, 0.0160, 0.0086, 0.0041, 0.0017, 0.0028 and the PSNR are 40.5582, 35.5198, 30.7411, 26.74, 23.16 and 18.80. We can see as the threshold increases the bit-rate goes on decreasing and the decreases in bit-rate is very significant at the same time the PSNR values also decreases and with Compression Ratio (CR). From the graph plotted in figure no. it can be seen that if the compression ratio increases then PSNR increases and MSE decreases.
5.2 SPIHT:
For threshold 8, 16, 32, 64, 128, 512 the respective bit rates are 0.0887, 0.0483, 0.0225, 0.0092, 0.0031, 0.0010 and the PSNR are 39.88, 34.97, 29.95, 25.84, 22.57 and 17.96. At lower threshold the change in PSNR and bit-rate is not much distinguishable as threshold changes from 8 to 16 PSNR changes 0.00887 to 0.0483.But at higher threshold bit- rates decreases to greater extent and the subjective quality of the image is also degraded.
REFERENCES
[1] KP. Soman & K.I .Ramachandran, "Insight into Wavelets from theory to practice", Prentice Hall India, New Delhi 2002.
[2] Strang, G. and Nguyen, T. Wavelets and Filter Banks, Wellesley-Cambridge Press, Wellesley, MA, 1996.
[3] N. J. Fliege, "Multirate Digital Signal Processing: Multirate Systems Filter Banks- Wavelets", Wiley & sons, Jan., 2000.
[4] Tarun kumar & Deepak Chaudhary, “Comparison Study Between ezw, spiht, stw, wdr, ‘aswdr’ and spiht_3d”, International Journal of Scientific & Engineering Research, Vol 4, pp 710-715, Jan 2009.
[5] Jerome M Shapiro "Embedded Image coding using zerotrees of wavelets coefficients", IEEE transactions on signal processing, Vol 41, no. 1 2, Pp.3445-3462, Dec 1993.1
[6] Tarun kumar, Deepak Chaudhary, “Compression Study Between ‘ezw’, spiht, stw, wdr, aswdr and spiht_3d’’, International Journal of Scientific & Research , Vol 4, pp.710.716,Oct 2013.
[7] C, Valens. “EZW encoding”. Retrieved October 2, 2004 http://perso.wanadoo.fr/polyvalens/clemens/ezw/ezw.html.
[8] A. Said and W. A. Pearlman, “A new, fast and efficient image codec based on set-partitioning in hierarchical trees,” IEEE Trans. Circuits Syst. Video Technol., vol. 6, pp. 243–250, Jun. 1996.
[9] Asad Islam and W. Pearlman, “A. A New, Fast, and Efficient Image Codec Based on Set Partitioning in Hierarchical Trees”, IEEE Trans. on Circuit & Systems for Video Technology, vol. 6, no. 3, pp. 243-250, June 1996. [10] Ritu Chourasiya and Prof. Ajit Shrivastava, “study of image compression
based Transmission algorithm using Spiht for Low bit rate application”, An International Journal Advanced (ACIJ), Vol.3, No.6, November 2012.
AUTHORS
First Author – Shilpa Jaiswal, M.E(EXTC-pursuing)