Geosciences Theses Department of Geosciences
12-12-2018
Paleoenvironmental and Paleoclimatic Changes in
Tropical East Africa Since the LGM: New Record
from the Cherangani Hills Kenya.
Benjamin Atieno Opiyo
Follow this and additional works at:https://scholarworks.gsu.edu/geosciences_theses
This Thesis is brought to you for free and open access by the Department of Geosciences at ScholarWorks @ Georgia State University. It has been accepted for inclusion in Geosciences Theses by an authorized administrator of ScholarWorks @ Georgia State University. For more information, please [email protected].
Recommended Citation
Opiyo, Benjamin Atieno, "Paleoenvironmental and Paleoclimatic Changes in Tropical East Africa Since the LGM: New Record from the Cherangani Hills Kenya.." Thesis, Georgia State University, 2018.
AFRICA SINCE THE LGM: NEW RECORD FROM THE CHERANGANI HILLS KENYA.
by
BENJAMIN OPIYO
Under the Direction of Lawrence M. Kiage, PhD
ABSTRACT
A 3.5 m radiocarbon-dated sediment core was recovered from the Kapkanyar mire, Cherangani
Hills, Kenya, to reconstruct the paleoclimatic and paleoenvironmental variations in Tropical East
Africa since the last glacial maxima. Through a multi-proxy approach of pollen, elemental
geochemistry, and LOI analysis, different deductions were made based on the relationship of the
patterns exhibited by each proxy. Associations of varying pollen type groupings: the arboreal,
herbaceous and shrubs were used to infer the prevailing paleoclimates considering the
vegetation-climate relationship that has been observed and exploited in pioneering palynological studies.
Findings from this study reveal notable climate dynamics of sub-orbital scale global climate
signals including the East African monsoon signals, the African Humid period (16Ka-6Ka) and
Pleistocene aridity events such as the Younger Dryas (14Ka-12Ka). Although anthropogenic
activities are observed to be a principal driver in environmental change, it is evident that they do
not entirely oust natural background climatic changes.
AFRICA SINCE THE LGM: NEW RECORD FROM THE CHERANGANI HILLS KENYA.
by
BENJAMIN OPIYO
A Thesis Submitted in Partial Fulfillment of the Requirements for the Degree of
Master of Science
in the College of Arts and Sciences
Georgia State University
Copyright by Benjamin Atieno Opiyo
AFRICA SINCE THE LGM: NEW RECORD FROM THE CHERANGANI HILLS KENYA
by
BENJAMIN OPIYO
Committee Chair: Lawrence Kiage
Committee: Daniel Deocampo
Brian Meyer
Electronic Version Approved:
Office of Graduate Studies
College of Arts and Sciences
Georgia State University
DEDICATION
I would like to dedicate this work to my dad and mom, Mr. Isaiah Opiyo and Mrs. Catherine Opiyo,
for their never-ending prayers and support and my twin sisters, Brenda Opiyo and Bridgit Opiyo,
ACKNOWLEDGEMENTS
I would like to appreciate the funding from the National Science Foundation (NSF) for the project
and the support and guidance of my advisor Dr. Lawrence Kiage who has always believed that I
can do better as long as I put my nose to the grindstone and work at it. Thanks to my thesis
committee Dr. Deocampo and Dr. Meyer for the help accorded through the whole process and
preparation of this document. Thank you Dr. Gebregiorgis for the immense support and a keen eye
for detail throughout the preparation and combing of this document. A big thank you to the
Geosciences department for the graduate research and teaching assistant positions they offered me;
which enabled me to finance my masters’ education to a successful completion. Great appreciation
too to my colleagues and course mates especially Francis Muchemi who has been a friend, elder
brother and mentor whom we started the journey for our studies abroad in The United States
together and has always supported me in all my academic and life engagements. A big thank you
to Vicky Chelang’at whom we worked in the lab together through the tedious palynological work.
Not to forget Mr. Muchiri, great thanks for driving us through the challenging Cherangani Hills
TABLE OF CONTENTS
ACKNOWLEDGEMENTS ... V
LIST OF TABLES ... VIII
LIST OF FIGURES ... IX
LIST OF ABBREVIATIONS ... XI
1 INTRODUCTION ... 1
1.1 Study Area ... 3
1.2 Research Question ... 6
2 METHODS ... 7
2.1 Coring ... 7
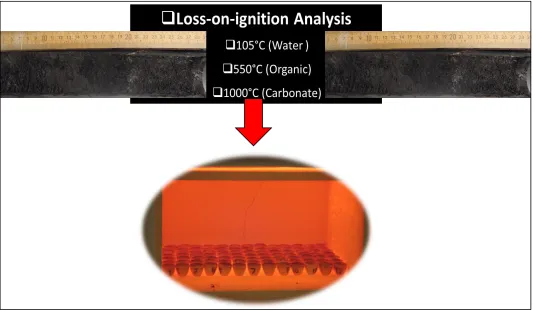
2.2 Loss-On-Ignition Analysis (LOI) ... 8
2.3 X-Ray Fluorescence... 9
2.4 Dating of Core Sediments ... 9
2.5 Palynological analysis ... 9
3 RESULTS. ... 11
3.1 Core Chronology ... 11
3.2 LOI and Lithostratigraphy ... 12
3.3 Pollen ... 15
3.4 Charcoal ... 20
5 CONCLUSIONS ... 35
LIST OF TABLES
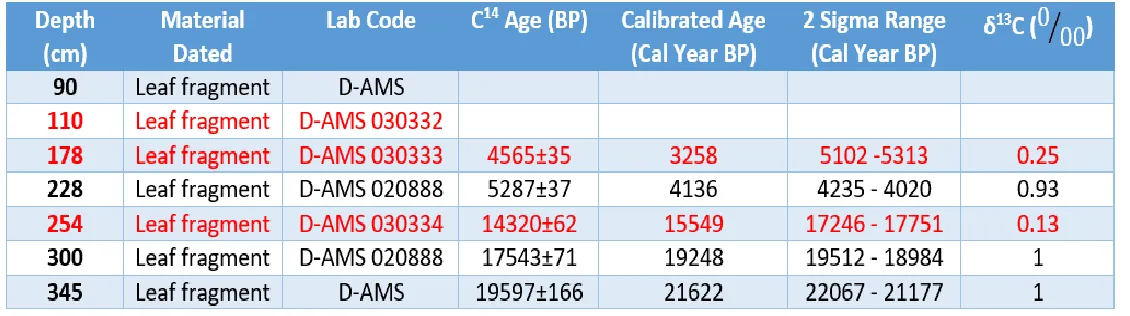
Table 1:Table of the AMS radiocarbon chronology for the Kapkanyar Core used to develop the
age model and the different materials sampled at each level. The calibrated dates were
generated using the Calib 6.0 program (Reimer,2013 ; Stuiver et al., 2005)The ages in red
within the table were not used for the initial generation of the age model. ... 11
Table 2: An exhaustive list of all the pollen types and spores identified in the Kapkanyar Swamp
LIST OF FIGURES
Figure 1: Location of the Cherangani Hills watershed site location in Kenya relative to other
paleolakes where previous works have been conducted along the Gregorian Rift Valley
from subsets of East African region and African continent maps (red outline on the
Kenyan map marks the site). ... 5
Figure 2:Field images showing the Modified Livingstone Corer used to recover sediment. ... 7
Figure 3: Systematic illustration showing the steps involved in Loss on Ignition analysis (LOI). 8
Figure 4:Figure Showing the fume hood used in acid treatment and acetolysis in the Lab. ... 10
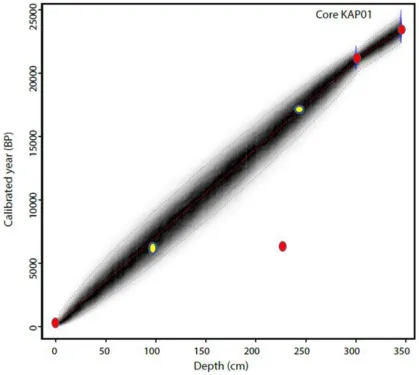
Figure 5:Age Control Model generated using three of the four calibrated radiocarbon ages
marked by red dots with a purple ring, obtained from the AMS. Yellow dots are
affirmative additional dates that line up with the age model. The markers show the depth
and calibrated ages for the dated organic materials.) ... 12
Figure 6: Sediment LOI and Lithostratigraphy data of the Kapkanyar Core Showing percentage
(%)water, organics, carbonates patterns with their relative C14 ages and depth along the
core. ... 15
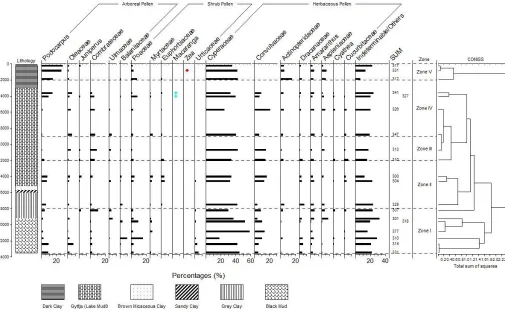
Figure 7:Pollen diagram showing percentage calculations of relative abundance of pollen with
five dendrograms showing distinct pollen assemblage zonation based on the CONNISS
classification. The colored dots represent presence of grains below 3% threshold for
representation as bars. ... 18
Figure 8: Illustration of wetness dynamics as depicted from the proportions of the Cyperaceae to
Poaceae pollen throughout the record.(numbers on bars indicate the pollen counts). ... 19
Figure 9:A figure showing charcoal representation and abundance down the Kapkanyar core
Figure 10:Kapkanyar Core XRF spectrum showing down the core concentrations of selected
elements useful for paleoclimatic interpretations with changing lithology. ... 22
Figure 11: A matrix of correlation showing pair of elements with the highest R2 value (Zr vs. Ti)
LIST OF ABBREVIATIONS
AMS Accelerator Mass Spectrometry
ENSO El Niño-Southern Oscillation
LGM Last Glacial Maxima
XRF X-ray Fluorescence
LOI Loss on ignition
ITCZ Inter-Tropical Convergence Zone
BP Before Present
Ka Thousand Years
Cm3 Cubic Centimeters
1 INTRODUCTION
East Africa is made of an assortment of environments ranging from arid and semiarid to
humid mountainous ranges and tropical forests to Savannah grasslands. Unique vegetation
assemblages also referred to as biomes, accompany each of these environments (Izumi and Lézine,
2016). Cumulative effects of both human influence and natural climatic variations have been a
primary control and sculptor of the dominant type of vegetation in the landscapes. These different
vegetation communities have experienced increased pressure from the exponentially growing
population in the region. Even though human activities have taken precedence in shaping the
current vegetation cover in East Africa, it does not oust the effect of the regional climatic regime
(Marchant et al., 2018).
Vegetation change mirrors change in climate and environmental conditions whether they
owe their source to anthropogenic activities or natural background climatic variations (Bush and
Colinvaux, 1990; Courtney Mustaphi et al., 2017; Ivory and Russell, 2016; Izumi and Lézine,
2016; Kiage and Liu, 2009; Novenko et al., 2018; Sánchez Goñi et al., 2017; Schüler et al., 2012;
Tian et al., 2017). Climatic variations result in alterations in the amount of water inflows, outflows
and storage within a hydrological cycle: which are the essential components of a hydrological
budget and this results in ever-changing hydrological budgets. The hydrological cycle responds
differently to these climatic and environmental variations depending on an areas level of fragility,
which is referred to as the hydrological sensitivity. With the different hydrological budgets that
have been experienced in the East African region through time (Tierney et al., 2011), it is also
expected that the vegetation will mimic their dynamics.
The orography of the East African landscapes, on the other hand, has played a principal
very close geographical proximity and consequently the vegetation cover (Gasse, 2000; Oettli and
Camberlin, 2005). This could lead to erroneous climatic interpretations and correlations over wide
regions. Apart from the three controls mentioned above, a confluence of other processes including
solar activity and changes in insolation, atmospheric composition and circulation, teleconnections
including El Niño-Southern Oscillation (ENSO) events and ocean currents also account for the
climate variations experienced in this region(Marchant et al., 2018). This, therefore, convolutes
the efforts of trying to disentangle the critical controls of the East African climate, hence the need
for a good choice of climate proxy (Kiage and Liu, 2009).
Vegetation is an ideal yardstick for the environmental changes since it is a manifestation
of the prevailing climatic and ecological conditions (Quick et al., 2011). Consequently, pollen
archived in lithological sediment records through sedimentation and deposition processes can
actively aid in shedding light on past environments by providing vegetation histories through time
(Izumi and Lézine, 2016; Tian et al., 2017). The vegetation-climate relationship has proven to be
reliable, given that different vegetation assemblages and their distribution are representative of an
ideal set of conditions of temperature, moisture, solar radiation, soils, carbon dioxide levels, winds,
biotic interactions and forms of disturbances experienced such as fires and other anthropogenic
activities.
We present a new high-resolution record of pollen and elemental geochemistry data that
elucidate the environmental changes from the terminus stage of the latest glacial maxima to the
present. Although a number of studies (Battistel et al., 2017; Berke et al., 2014; Courtney Mustaphi
et al., 2017; Foerster et al., 2012; Foerster et al., 2015; Rucina et al., 2009), have been performed
in different locations throughout the East African region, in some situations the question still
or site-specific either due to microclimates as a result of complex orography (Oettli and Camberlin,
2005) or anthropogenic activities (Wright, 2017). An earlier record (Coetzee, 1967) obtained from
Kaisungor Swamp, near the study area has the challenge of hiatuses but it provides a good
background to build on for this research.
1.1 Study Area
The Cherangani Hills stand as lofty highly folded residual erosional ranges on the
Southeastern part of Pokot County in Western Kenya (Fig 1). The area has a lot of rugged, steep
slopes averaging a height of around 3300 meters (m) above sea level. Its geology is typically a
metamorphic terrain occupied by Precambrian rocks of the basement system mostly granitoid
gneisses and schists, and intercalated with prominent quartzite ridges with occasional marble veins
(Strategic Ecosystem Management Plan 2015-2040). These forests are the primary catchment
areas for the rivers Turkwel, Nzoia and Kerio playing a vital role in maintaining their perennial
flow.
The climate of the area is sub-humid, pigeonholed by relatively high temperatures
(25-30°C) and an annual mean rainfall of about 1300 millimeters (mm) throughout the year with
highest values when the Intertropical Convergence Zone (ITCZ) crosses the equator (Liu et al.,
2017). It has some tropical rainforest characteristics with torrential downpours late in the evenings
and tall trees at least 30m in height.
The location where the cores were collected, is located at approximately 1˚07’07.602” N
latitude and 35˚17’39.03” E longitude, in a high altitude mire in the Kapcherop Forest Reserve
block. This forest block is one of the more consolidated forest blocks alongside the Kapolet and
Kiptaberr forest blocks as compared to the others that are fragmented and interspersed by cropland,
Kapkanyar mire made it an excellent site for pollen preservation. The suitability of this site for the
study is its hydrological sensitivity to climate variability and the fact that there are no
infrastructural developments in the area. Current vegetation cover types and composition on these
hills vary with its aspect. Juniperus-Nuxia-Podocarpus falcatus forests dominate the South-facing
slopes on the Eastern side while the Western facing slopes show the same forest composition
interspersed with Podocarpus falcatus forests which show higher levels of human disturbance.
Aningeria-Strombosia-Drypetes forests ecotoning into mixed Podocarpus latifolius dominate the
West-facing slopes in lower elevations. Steep valleys exhibit material relics of
Juniperus-Maytenus undata-Rapanea-Hagenia forests while stream valleys have stream valley tree ferns
1.2 Research Question
This study is structured around the following questions: What is the interplay of humans
and climate on environmental change in East Africa? Is there an anthropogenic imprint on the
environment ousting natural climatic change trend in the region during the last 3000-4500yrs as
documented in previous literature? At what point do humans start impacting the environment in
2 METHODS
2.1 Coring
Cores from different carefully selected sites in the Cherangani Hills (Kapkanyar and Saiwa
Swamps) were obtained using a modified Livingstone Piston corer used in Kiage and Liu, (2009)
where three overlapping cores with an overlap of approximately 10 cm were warily extruded. All
the core sections were cautiously labeled, described, and preserved in transparent-PVC tubes that
were carefully sealed airtight on both ends on site and shipped to Georgia State University
Department of Geosciences palynology and geochemistry laboratories for processing and analysis.
This coring method was applied since the upper 5 to 10 cm of the mire sediment was invariably
very soft, water-saturated and flocculent which would have made it difficult to raise an undisturbed
core using other methods. In the laboratories, each core was longitudinally split into two halves
using a table saw, photographed, and macroscopically described. The cores were then subjected to
[image:20.612.94.526.432.677.2]high-resolution palynological and sedimentological analysis.
2.2 Loss-On-Ignition Analysis (LOI)
1 cm3 samples were taken consecutively throughout the cores at 1 cm intervals and
subjected to LOI analysis following the techniques described by Beaudoin (2003) and Santisteban
et al. (2004). The samples were heated at 105°C overnight to establish the percentage water and
then combusted for 1 hour at 550°C and then at 1000°C to establish the organics content and
carbonate contents respectively, by sample weight loss.
[image:21.612.73.608.265.575.2]
2.3 X-Ray Fluorescence
Elemental data for the cores were obtained using a handheld Innov-X Alpha-400 energy
dispersive X-ray Fluorescence Spectrometer (XRF). The XRF instrument was set in Soil Analysis
mode and run at 60-second cycles twice at every centimeter along the core. The data obtained were
then graphed using Tillia plots version 1.7.16 software and Microsoft Excel spreadsheet software
(2017). The resulting data were then analyzed and interpreted using chemofacies graphs as shown
in Reotita et al., (2014). This was done focusing on the sections of enrichments and depletions of
certain index elements, whose ratios are vital for interpretation.
2.4 Dating of Core Sediments
To construct a time-scaled stratigraphic sequence, different sections rich in organic debris
along the core were sampled for radiocarbon dating. This was to assist in generating a robust age
model for the study. Organic samples were carefully selected throughout the core and sent for
Accelerator Mass Spectrometry (AMS) 14C dating at the Direct AMS, Inc. Laboratory in Seattle.
The ages established from the dating were then further subjected to an inquiry to inspect for the
occurrence of stratigraphic inversion and discontinuity. Using the Bacon based approach, an age
model was established employing Matlab 2017 software.
2.5 Palynological analysis
Sediment samples for pollen and microscopic charcoal analysis were taken at intervals
ranging from 1-10 cm throughout the core, and a total of 24 samples from the core were prepared
for analysis. These samples were sieved and chemically treated to concentrate the materials
mentioned above following the standard procedure of Faegri and Iversen (1989). This was
accomplished through acid treatment and acid acetolyis, which has proven to be excellent for
the samples were spiked with Lycopodium clavatum spores to aid in the counting and show pollen
concentration (Kiage and Liu, 2009). Pollen slides were then prepared out of the processed
samples, and then pollen count performed to check for the relative abundance of pollen taxa
following the guide in Coetzee (1967) and Faegri and Iversen (1989). Counting of microscopic
charcoal and pollen in each slide ceased when a minimum of 300 pollen grains or 1000
Lycopodium spores (whichever came first) had been reached (Aleman et al., 2013a; Burney,
1987). Microscopic charcoal that were angular and greater than 4μm were considered during
counting and great care was taken not to confuse them with biotite mica particles (Rucina et al.,
[image:23.612.107.507.347.599.2]2009).
3 RESULTS.
3.1 Core Chronology
Table 1 is a summary of the AMS radiocarbon dates of the Kapkanyar Core, the different
types of material sampled for dating and their relative depths that appear to have no signs of strata
inversion or discontinuity. This was very helpful in developing a Bacon-based age control model
for the core (Fig 7). This age control model is ideal since it takes into account the sedimentation
rates. It is used to give a control as to the windows in time for the different events such as the
occurrence and distribution of microscopic charcoal to come up with a probable fire regime. The
radiocarbon samples in the current study were calibrated using CALIB 6.0 software (M. Stuiver
and PJ Reimer, 1993) against the IntCal13 database (Reimer et al. 2013) for terrestrial samples.
The 14C data were initially corrected for fractionation of carbon isotopes (δ13C) by normalizing to
= -25‰ PeeDee Belemnite (PDB). Calibration databases have been constructed using radiocarbon
data and absolute dates from dendrochronology and other independently dated samples. Ages
generated were used as a primary axis in most of the graphs to ensure proper age constraint for
[image:24.612.30.595.568.726.2]lithology in the record.
Table 1:Table of the AMS radiocarbon chronology for the Kapkanyar Core used to develop the age model and the different materials sampled at each level. The calibrated dates were generated using the Calib 6.0 program
Figure 5:Age Control Model generated using three of the four calibrated radiocarbon ages marked by red dots with a purple ring, obtained from the AMS. Yellow dots are affirmative additional dates that line up with the age model. The markers show the depth and calibrated ages for the dated organic materials.)
3.2 LOI and Lithostratigraphy
The lithostratigraphy of the core is shown in (Fig 6) composed of six principal lithologic
units. Similar units such as the different variations of gyttja were grouped as one lithologic unit in
the diagram. The bottom section 350- 272 cm is majorly stiff tar-black mud which transitions into
[image:25.612.74.493.116.491.2]transitions with a sharp change in sediment type from 232-222cm to light brownish-yellow sandy
stiff clay. This is followed by greyish brown clay with high mica inclusions at around 222-214cm
that transitions into greyish black mud with low mica inclusions at 214-198cm. Between 198-100
cm, the core has dark lake mud sediments with no visible organics(198-139cm) that transitions
into reduced greyish black lake mud(139-100cm) which is followed by blackish-light brown lake
mud from 100-56cm, which further transitions to stiff dark clayey lake mud from around 56-40cm.
The top portion between 40 and 0 cm is composed of highly organic dark clayey soil with visible
fibrous rootlets.
The LOI data (Fig 6) has been partitioned into five distinct zones (Zone I-V) using the
Constrained Incremental Sum of Squares (CONISS), a multivariate package in Tilia, for elaborate
description. These zones were also generated considering pollen zonation since it was the major
proxy under investigation. Generally, explicit environmental dynamics are seen from the LOI
spectrum zoned as having five possible significant paleoenvironmental and paleoclimatic changes
throughout the period:
• Zone I (23.5Ka-18Ka), a notable pattern is observed from around 23Ka BP to around 20Ka
BP during the LGM; where the levels of organics and water closely correspond to each
other while that of the carbonates parallels the two. All are observed to rise but at different
stages: water reaches a 40% peak, organics around 10 % and carbonates <5%.
• Zone II (18Ka-12Ka) between approximate ages 19Ka and 16Ka BP there is a relative
increase in the levels of carbonates in the core. From around 16Ka to 12Ka there are
relatively high levels of organics and water content and very low levels of carbonates.
• Zone III (12Ka-9Ka) spanning around 3K years and partly into the early Holocene. Slightly
of carbonates slightly rise. In this early Holocene period at around 9Ka BP there is a sharp
substantial drop in the levels of both water and organics and a spike in the level of
carbonates.
• Zone IV (9ka-2Ka) is characterized by a plateau phase with intermediate substantial drops
in both water and organics and spikes in carbonates at around 6Ka and 3ka.
• Zone V (2Ka-0Ka), which corresponds with the mid-late Holocene period around 2Ka to
present, is represented by high levels (%) of water and organics coupled with low levels
Figure 6: Sediment LOI and Lithostratigraphy data of the Kapkanyar Core Showing percentage (%)water, organics, carbonates patterns with their relative C14 ages and depth along the core.
3.3 Pollen
A total of 82 pollen and spore types were identified. All the pollen types were identified at
least to the family level, and these were manually tallied and entered into a spreadsheet where they
were sorted and transposed before being transferred and plotted on Tillia version 1.7.16 software.
in Zone IV (Figure 8) which showed very low counts of pollen. The sediment type containing these
two levels was primarily clayey-sand. Special treatment was given to the Podocarpus pollen
identified; since it was not easy to differentiate between Podocarpus milanjianus and Podocarpus
gracilior pollen types, one curve was used to represent both of them in the pollen diagram (Fig 8).
The differentiation of the Poaceae family pollen was also done based off grain morphology, exine
thickness, grain diameter, and pore size to avoid confusion. Zea was in a separate curve and grass
and bamboo were taken as one general Poaceae curve. A major challenge involved the
identification of folded pollen grains.
From the pollen diagram, five major zones (Zone I- Zone V) were generated using
CONISS. Closely related zones with small ranges were collapsed and merged which resulted in
these zones that are consistent with the XRF and LOI data. The most important factors in
consideration that are useful can be deduced by the explanation of the pollen diagram (Fig 9) and
these are the temperature and rainfall conditions that are associated with each vegetation
assemblage (Bakker, 1964).
Zone I (23.5Ka-18Ka) displays a dominance balance by the Afromontane pollen such as
Podocarpus and Combrataceae pollen especially from around 23.5Ka to 22Ka while more
herbaceous and shrub vegetation dominate from around 21Ka-18Ka BP. Zone II (18Ka-12Ka) is
characterized by a resurgence of Afromontane vegetation after a drop towards the terminal stages
of Zone I. This is observed to be more pronounced after around 16Ka BP. In Zone III (12ka-9ka),
there is a sharp drop in the Afromontane elements after 12Ka concurrent with a drop in both
herbaceous and shrub pollen types. Despite the drop in herbaceous vegetation such as
Dracanaceae, Actinopteridaceae and Cucurbitaceae, a relatively sizeable amount of their pollen is
arboreal pollen counts. At around 4Ka BP, there is a recovery of Podocarpus and Oleaceae pollen
alongside that of the herbaceous Cyperaceae and Convulvaceae and shrub Poaceae and Myrtaceae
vegetation. At the beginning of Zone V (2ka-0Ka) to present, there are generally higher levels of
both Arboreal and herbaceous vegetation while a significant drop in shrub vegetation is observed.
Table 2: An exhaustive list of all the pollen types and spores identified in the Kapkanyar Swamp Core.
The Taxa represented in the pollen diagram (Fig 8) are in bold. The pollen types not included in the diagram are in normal font while the rest are grouped under intermediate/others.
Classification by code: types(1)arboreal trees, (2)shrubs, (3)herbaceous vegetation, (4) others/ intermediate, (5) spores
Figure 8: Illustration of wetness dynamics as depicted from the proportions of the Cyperaceae to Poaceae pollen throughout the record.(numbers on bars indicate the pollen counts).
Trend lines show a general decrease in both pollen types from the LGM to present.
Cyperaceae pollen is observed to dominate throughout the wetness index spectrum. The two
periods herein showing high counts of Poaceae pollen fall around 6Ka and 22Ka BP calibrated
years while those showing higher values of Cyperaceae pollen are approximately 18Ka, 17Ka,
3.4 Charcoal
Zones I and II are almost devoid of microscopic charcoal except for four levels that
recorded negligible frequencies. Zone III shows two levels rich in microscopic charcoal, especially
tree charcoal centered at ca. 10.5Ka BP. Zone IV displayed the highest microscopic charcoal count
with the highest peaks of both grass and tree microscopic charcoal at around 8Ka that gradually
falls with the proceeding levels and recovers at around 4ka and further drops continuing into Zone
V. Charcoal from woody vegetation is observed to dominate throughout the spectrums. In some
levels, only some negligible quantities (less than ten counts) per level are observed, and these were
disregarded on grounds that they could be a product of contamination during processing. A general
decreasing trend is observable in the charcoal counts along the core albeit with isolated peaks at
two levels at around 10.5Ka and 8Ka BP which are distinctly notable with higher counts of angular
elongated microscopic tree charcoal in the former and both tree charcoal and charred grass cuticles
Figure 10:Kapkanyar Core XRF spectrum showing down the core concentrations of selected elements useful for paleoclimatic interpretations with changing lithology.
From the XRF spectrum plot (Fig 10), special interest is put in elements that would show variations
with alterations in hydrological conditions such as Cl, Mn and K. Also, terrestrial elements such
as Ti, Fe and Zr are observed to give inference to the levels of terrestrial input into the mire. Cl, K
and Ca are observed to display similar trends down the core: that is for the most part parallel to
the trends displayed by the terrestrial elements Ti, Zr and Fe.
Cl, K and Ca are characterized by a medium-high peak followed by a gradual decrease into a low
plateau phase from (345cm-258cm) in Zone I (23.5Ka-18Ka BP) that transitions into Zone
towards the end of the section (258cm -172cm). Zone III (12Ka-9Ka BP) displays smooth gradual
increases in the peaks of elemental concentrations between (172cm-128cm) which is followed by
a plateau phase and relative two high peaks in the last portion of section between 128cm-27cm in
Zone IV (9Ka-2Ka BP). Lastly in Zone V (2Ka-0ka BP) relatively high spikes between
(27cm-0cm) are observed.
Fe, Zr and Ti are generally characterized by:
• From (345cm-258cm) in Zone I (23.5Ka-18Ka BP), a medium-high plateau phase followed
by a lower plateau phase that commences at around 300cm depth aged approximately 21Ka
BP.
• From (258cm -172cm) in Zone II (18Ka-12Ka) relatively medium-high concentrations of
the elements are observed with pulses of drops and rises.
• Between (172cm-128cm) in Zone III (12ka-9ka), the highest concentrations of these
individual elements spectra are observed. This transitions to a sharp drop at 128cm in Zone
IV (9ka-2ka) that is followed by a slight rise and a relatively low plateau phase between
Figure 11: A matrix of correlation showing pair of elements with the highest R2 value (Zr vs. Ti) y = 5.4369x + 1275.1
R² = 0.5587
0 1000 2000 3000 4000 5000 6000 7000 8000 9000
0 200 400 600 800 1000 1200 1400
Zr
4 DISCUSSION
The age model developed to provide timing to the chronological occurrence of events in
the study, omits the 5287+/-37 second 14C age recorded at 228cm in core KAP 01 (Table 1). For
the 5287+/-37 14C at 228 cm to be accepted then we also have to accept extremely low
sedimentation rates between approximately 17.5Ka BP and 5.3Ka BP, which would be inconsistent
with the other dates recorded at 300cm and 345 cm. That would in turn imply anomalously high
sedimentation rate between 5.3Ka-0Ka BP. Between the former mentioned ages, two levels whose
matrix was majorly sandy-clay with coarse grained sand, showed exceptional low levels of pollen
preservation with counts that were too low to surpass the threshold for representation in the pollen
diagram (Fig 7). Although depositional circumstances could be a possible explanation for lack of
preservation (Kiage et al., 2017), it could also be a product of an extreme drought event which
deprived the environment of moisture which plays a decisive role in pollen preservation (Coetzee,
1967). This could invoke more research to check if this was a nonconformity resulting in a period
of no deposition hence a hiatus.
The combination of the paleoenvironmental proxies used greatly complemented each other
and aided to pinpoint hotspot time windows to focus on as periods of significant ecosystem
responses to climatic variability through the LGM, the late glacial transition and the Holocene.
Different expressions of the pluvial and arid periods have been manifested differently in different
papers, but herein, seasonal distribution of precipitation which has been often correlated to wind
system seasonal shifts in the region through the years (Coetzee, 1967; Oettli and Camberlin, 2005)
was the main focus for clear inferences to be surmised. Emplacing the plots of the pollen diagram,
the XRF spectrum and the LOI data adjacent to each other, a reliable climate history is deduced
Zone I of the pollen diagram covers 23.5Ka-18Ka BP that mostly represents the LGM.
This zone is characterized by high levels of dry montane rain forest vegetation such as Podocarpus
and Oleaceae. Zone I also showed relatively high frequencies of Poaceae and Asteraceae pollen
types. The low representation (<3%) of Hagenia pollen in the Cherangani record is somewhat
unusual considering records from most East African mountains such as Mount Kilimanjaro and
Mount Kenya (Coetzee, 1967; Rucina et al., 2009) that have high representations of Hagenia
components. However, it is possible that the low altitudinal location core site for this study meant
that the Cherangani Hills may have failed to effectively record vegetation components of the
altitudinal Bamboo Zone and the montane rain forest vegetation belts represented in Mt.
Kilimanjaro and Kenya. Zone I is also characterized by relatively high organic content while the
carbonate levels are largely unremarkable. The content of the black mud in this basal zone of the
core dated 19.5Ka BP and calibrated to 23.5Ka BP, is interpreted as the first deposits to be mixed
with the glaciers in this record. This level contains a mixture of both Afromontane vegetation
elements and Ericaceae belt elements alongside drought indicator pollen such as Amaranthus
pollen of the Asteraceae family and a high count of aquatic Cyperaceae pollen. It is possible that
the pollen content in the sediment towards the end of the zone (at ca.18Ka) could be a mix of
materials released as the glaciers melted and not the original vegetation at the particular point in
time. However, the patterns exhibited are in tandem with the period of treeless vegetation in the
Kaisungor record (Coetzee, 1967) represented by the increases in Compositae pollen values and
the inferred cold and moist period (Kiage and Liu, 2006) between 30Ka and 21Ka BP and the
period succeeding it which was around 2°C colder. The patterns exhibited are generally common
Zone II (18Ka-12Ka) mainly covers the late glacial transition period. Profound patterns are
exhibited between 19Ka and 16Ka BP. Between 19Ka and 17.5Ka there is a drop in Afromontane
vegetation such as Ulmaceae, Combrataceae and Podocarpus and a relative resurgence in
Asteraceae pollen with a very small representation of Erica pollen. The presence of the Erica pollen
from the Ericaceae family alongside the relative high values in Asteraceae pollen suggests that this
period was cold and dry. This period lines-up with the upsurge in terrestrial elements of Fe, Zr and
Ti in the XRF spectrum (Fig 10). All these patterns are concomitant with a Heinrich stadial event
during the glacial termination (Denton et al., 2010). This period has been noted in (Hamilton,
1982) as the period of world ice volume maximum which greatly reduced the moistness of the air
masses affecting the East African region. Towards 17Ka BP, an appreciable percentage increases
in Afromontane pollen types as depicted in (Fig 7) and a relative increase in wetness from the
wetness index (Fig 8) are noted. This is further supported by an increase in organics and water
percentages in LOI data (Fig 6). The recovery of dry montane rainforest vegetation such as Olea
pollen and Podocarpus at around 17Ka BP following a drop between 19Ka and 17.5Ka can be
considered a response to high humidity and temperatures amelioration at the commencement of
this period that marked the transition stage of the LGM. This could be an indication of a localized
increase in precipitation for which dynamical reasons may not be apparent. A possible explanation
is given for this phenomena as the activity of the East African Monsoon when the compression of
the ITCZ towards the equator by the increase in Antarctic Sea Ice coverage and sizeable Northern
Hemisphere ice sheets that plunged the easternmost part of tropical Africa into a wet period
(Chiang and Bitz, 2005; Tierney et al., 2011). The enlargement of the Antarctic ice-sheet might
have exerted high pressures on the North-West Europe ice-cap that consequently depressed the
rainfall (Bakker and Maley, 1979). However, Coetzee (1967) observed that the ITCZ activities are
quite difficult to detect, particularly the disturbances necessary to activate the convective
processes, which consequently makes it difficult to account for climates during such transitions.
The period spanning 16Ka -12Ka BP show similar proxy patterns as those described towards ca.
17Ka, these patterns indicate a humid and moist period with the former age marking the beginning
of the African Humid period at around 16Ka (Foerster et al., 2012; Liu et al., 2017; Wright, 2017;
Zielhofer et al., 2017). Massive scale world ice melting occurred during this period that released
enormous amounts of water into the oceans.
In Zone III (12Ka-9Ka BP), the relative frequency of the Poaceae pollen is very high. In
deed the period just before 12Ka BP was characterized by a significant drop in the levels of both
water and organics and a slight rise in carbonates. These patterns appear to be synchronous with
the occurrence of the Younger Dryas event that is noted in most literature (Foerster et al., 2015;
Wright, 2017), which is a possible explanation of this phenomenon that is common of an episodic
hot and dry climate. The Younger Dryas aridity event has been marked by a substantial increase
in Graminnae pollen in the Ruwenzori and Kaisungor pollen diagrams by (Coetzee, 1967). This
period was noted as a cold period in North West Europe as the upper Dryas stadial where the
re-advancing of some glaciers hampered the general climatic warming (Hamilton, 1982).
Zone IV (9ka-2Ka BP) covers the early Holocene period into the late Holocene. At ca. 9Ka
BP there is a sharp drop in the levels of both water and organics that are accompanied by a spike
in the level of carbonates which can be interpreted as a major drought event that led to a significant
increase in the level of siliciclastic sediments when the mire might have dried up due to the existing
climate conditions. This is further supported by an influx in terrestrial elements denoted by spikes
experienced during the African humid period could be associated with the cooling event in the
Northern Hemisphere that resulted in the southward shift of the ITCZ. The aridity pulses around
10.5Ka and 8.5Ka BP in the record were accompanied by two significant fires events which are
possibly natural fires given the intensity of the two fires inferred from the higher counts of both
grass and tree charcoal (Fig 9) and the scale inferred from the count, size and shape of the charcoal
particles. Charcoal particles in these two fire events are observed to have a high count, are large,
elongated, and angular in shape, which is characteristic of a widespread fire (Aleman et al., 2013b;
Burney, 1987; February, 2000) that would be common in dry conditions vegetation covering vast
areas of land. Aridity conditions are ideal environments for such types of fires with the availability
of biomass and a spark source that could possibly be lightning. Despite these dry pulses in the
record, the early to the mid-Holocene period in East Africa is depicted as having been confined by
wet conditions which is consistent with the period of maximum insolation in the Northern
Hemisphere (Liu et al., 2017)
Similar trends are observed in three periods in this zone: around 6Ka BP that could be
associated with the termination of the African Humid Period (AHP) that plunged the East African
region into a desiccation pulse. The termination of the AHP can be attributed to the termination of
two fundamental mechanisms that controlled wetness in the AHP, that is, the Northern Hemisphere
insolation that significantly raised the Atlantic Ocean Moistures and the addition of moisture from
the Indian Ocean (Liu, et.al, 2017). The accuracy of termination of the AHP has been seen to vary
in different literature material most likely due to the contrasting resolutions of the various proxies
employed (Liu et al., 2017). This drought event is corroborated by the wetness index diagram (Fig
8) where Poaceae values are observed to be high possibly indicating a period of increased grassland
Another notable drought event occurred around 4Ka-3.5Ka BP as observed and discussed in
several records (Annie et al., 2007; Kiage et al., 2017; Rucina et al., 2009; Sánchez Goñi et al.,
2017). This desiccation event is marked by a high count of the Podocarpus pollen and the Olea
pollen type accompanied by a relative increase in Poaceae and Asteraceae pollen. This desiccation
event is noted in the Kapkanyar core by an increase in siliciclastic sediments in the LOI diagram
(Fig 6) and an increase in terrestrial sediments such as Mn, Ti and Fe (Fig 10).
In different records, this event conforms with the commencement of the imprints of
anthropogenic activities (Wright, 2017). It has been recorded as an increase in Millennial-scale
sub-Saharan dust in Zielhofer et al., (2017) which is also recorded as a peak in atmospheric dust
presumably of Saharan origin in the deep-sea cores from North East Atlantic in Parkin and
Shackleton (1974) and a spike in Olea and Podocarpus gracilior which are both good indicators
of dry conditions (Coetzee, 1967; Garcin et al., 2012; Marchant et al., 2018). Although this event
has also been associated with human impact, the fact that it is on an orbital scale negates the
validity of the argument on the basis that if it was only human induced it would only be limited to
a few pockets of the globe where populations were dense. Hence supporting the argument that the
drought pulse in the record was associated to a combined impact of anthropogenic activities and a
telecommunication event such as the equatorward movement and intensification of the subtropical
anticyclones (Hamilton, 1982).
Considering the occurrence of charcoal and the radiocarbon chronology (Table.1), there is
an increase in the frequency of the fire events especially at around 4Ka BP (Fig 9) and a reduction
in the arboreal vegetation with an increase in Poaceae pollen (Fig 7). The presence of the
Macaranga pollen of the Euphorbiaceae family that is identified as an obligate heliophytic plant
the postulation that the region was mostly made of vast grasslands that could possibly be a product
of forest fires given a hot and dry enabling environment and spark sources which could range from
natural mostly lightning to human-instigated possibly from fire hunting techniques, honey
harvesting or as control of pests such as tsetse flies (Glossina).
The third notable drought period is at 2.5Ka which correlates with the occurrence of the
“Arsi” drought event recorded in a sediment record from Ethiopia (Foerster et al., 2015), which
resulted in substantial drying. Decreases in concentration of elements such as Mn and Cl also could
suggest evidence of hydrological alterations (Liu et.al, 2018) during these aridity events.
Dominance of the Ti signal over the Zr signal is also observed to fall concomitantly with these
aridity periods. This could be indicative of an increase in terrigenous sediments runoff during such
periods (Martinez-Ruiz et al., 2015; Reotita et al., 2014). Generally, the elemental concentrations
(Fig 10) show a trend of increases in terrestrial elemental concentrations (Ti, Fe and Mn) to be
concomitant with transitions from a more mesic phase to these drier phases.
In Zone V (2ka-0KaBp), from the lower boundary of 2Ka BP to ground surface (present),
a general resurgence of both Arboreal and herbaceous vegetation accompanied by a significant
drop in shrub vegetation is observed. Evidence of human imprints in this zone is further supported
by presence of the Zea pollen that shows an introduction of agricultural activities. Specific
keenness was employed as to the diameter of the grains to ensure that the Zea pollen (>45 μm-122
μm) were not confused for grass (37 μm -50 μm) or bamboo (30 μm-40 μm) pollen that are of
similar morphology. The first occurrence of Zea in this record is at approximately 2Ka years BP,
but this is contentious since the introduction of Zea by the Portuguese in Africa was dated in the
16th century around 1502 in the West African coast and later to the interior of the continent and
(Miracle, 1965). This was roughly 500 years from the present. Also, the number of grains counted
in this level was only 3 grains that is very low and thus leading to the deduction that this was
probably a product of contamination during pollen processing or even compaction over time. Zea
grains are rather large and would not easily be transported into the mire: the age/depth relationship
at such a shallow depth may hence also be effected by compaction or lack thereof. Shallow soft
sediments that formed the top portion of the core, are prone to compaction as compared to deeper
more compacted sediments. This was thus not represented in the pollen diagram.
The presence of the human imprints through agriculture explains the resurgence of the
arboreal and herbaceous vegetation that could be possibly as a result of more controlled burning
through policies of forest protection and also from the establishment of firebreaks that are a product
of human activities such as land partitioning in their efforts to fragment land for agriculture and
settlement.
The reduction in forest fires indicated by the observation of low microscopic charcoal
counts in this section of the record at the beginning of Zone V also corroborates the argument of
more controlled fires. This is further complemented by the LOI data that shows an abundance of
organics and water content in the sediments and a very low plateau phase of carbonates. The
elemental XRF data on the other hand shows relatively high levels of elemental Cl, Zr and Mn and
a decrease in all other terrestrial elements such as Fe and Ti within this zone. All these parameters
are indicative of more mesic conditions (Colombaroli et al., 2016). The climate around this time
can be firmly surmised to have been wetter than that between 6Ka BP-3Ka BP.
Profound vegetation shifts consequent of environmental changes are observed to have
taken place in the past from the fossil pollen data. As compared to other records (Courtney
the climatic changes in the fossil pollen record, the Kapkanyar core shows a lower magnitude of
environmental changes in palynology but dynamics of arid and pluvial periods are observed the
other supporting paleoenvironmental proxies.
In the wetness index illustration (Fig 8) Cyperaceae pollen dominates throughout the
spectrum; this can be explained by the fact that it is common in a mesic environment, which is
typical of a swamp or mire. This is described (Coetzee, 1967) as an abundance of aquatic pollen
that is indicative of local edaphic soil moisture. Trend lines in the wetness index show a general
increase in wetness from the LGM to present. This closely supports the record of the millennial
and other sub-orbital scale perturbations in climate as it swung from a reasonably cold and moist
LGM to a humid early Holocene (Berke et al., 2014). Human imprints are strongly confirmed in
Zone V and are observed and exposed as the dominant force driving regime change in the late
Holocene period in general.
The fact that most of the East African region is characterized by variations in topography
of landscapes (Oettli and Camberlin, 2005) generally results in significant heterogeneity due to
differences in microclimates and macroclimates (Coetzee, 1967) that can be created in different
areas depending on the relief settings hence the lack of a monotonous climate trend that can be
representative of the whole region. This phenomenon could explain why some of the observations
in the Kapkanyar core may not fully conform to observations from previous studies (Foerster,
2012; Bakker, 1964; Coetzee, 1967) that show transitions from an arid-glacial Pleistocene into a
humid post-glaciation period compared to an early moist-glacial to a late arid-glacial to a humid
post-glacial Holocene which is depicted in the Kapkanyar record. Such disparities call for more
paleo-weather stations, which could yield a more representative understanding of the different climatic
variations and transitions that have occurred in the whole East African region.
The global climatic signals observed in the Cherangani Hills record can be surmised to be
a precipitate of the climatic temperature changes during the late Pleistocene and the Holocene that
were of global scale (Mustaphi, 2017; Ringard, 2016; Rucina, 2009; Tierney, 2011). This is an
indication that although anthropogenic activities have greatly altered the tropical African climates,
they do not completely supplant the effects of natural background climatic regime changes. Most
of the paleoenvironmental and paleoclimatic deductions made herein are however in broad accord
with most previously published pollen records from the East African region (Courtney Mustaphi
5 CONCLUSIONS
The Kapkanyar core reveals substantial environmental and climatic changes at the site over the
last 23.5Ka BP. The climatic variations in the record are associated with changing energy budgets
of the earth. The dynamics and shifts in the proxies’ relations shed light on the preexisting edaphic
moisture conditions and climates given that soils are a product of climate. The East African climate
is showing transition from a cold and moist LGM in the early Pleistocene, and this is later replaced
by a dry-glacial phase in the late Pleistocene and followed by a wet phase with other intermittent
pulses of desiccation. It is also evident from our late Pleistocene to Holocene record that
anthropogenic fires are a principal periodic source of disturbance. This observation is apparent
especially in the period spanning the late Holocene where fire occurrence frequency is observed
to have increased. The East African Monsoon activity that is resultant of shifts in wind systems is
also noted to be one of the principal controls of the climate of the East African region, which can
be inferred from the precipitation patterns that have been deduced from the fossil pollen patterns
in the Kapkanyar core. Although anthropogenic activities have in recent times greatly altered the
East African Region Climate, they do not completely supplant the effects of natural climatic
regime changes and this is supported by the global climatic temperature changes signals during
REFERENCES
Aleman, J.C., Bentaleb, I., Blarquez, O., Bonte, P., Brossier, B., Carcaillet, C., Gond, V.,
Gourlet-Fleury, S., Kpolita, A., Lefevre, I., Oslisly, R., Power, M.J., Yongo, O., Bremond, L.,
Favier, C., 2013a. Tracking land cover changes with sedimentary charcoal in the
Afrotropics. The Holocene, 1853-1862.
Aleman, J.C., Blarquez, O., Bentaleb, I., Bonté, P., Brossier, B., Carcaillet, C., Gond, V.,
Gourlet-Fleury, S., Kpolita, A., Lefèvre, I., Oslisly, R., Power, M.J., Yongo, O., Bremond, L.,
Favier, C., 2013b. Tracking land-cover changes with sedimentary charcoal in the
Afrotropics. The Holocene 23, 1853-1862.
Annie, V., Yannick, G., Guillaume, B., 2007. Influence of Rainfall Seasonality on African
Lowland Vegetation during the Late Quaternary: Pollen Evidence from Lake Masoko,
Tanzania. Journal of Biogeography 34, 1274-1288.
Bakker, E.M., 1964. A pollen diagram from equatorial Africa,Cherangani Kenya. Geologie en
Mijnbouw, 123-128.
Battistel, D., Argiriadis, E., Kehrwald, N., Spigariol, M., Russell, J.M., Barbante, C., 2017. Fire
and human record at Lake Victoria, East Africa, during the Early Iron Age: Did humans or
climate cause massive ecosystem changes? The Holocene 27, 997-1007.
Beaudoin, A., 2003. A comparison of two methods for estimating the organic content of sediments.
Berke, M.A., Johnson, T.C., Werne, J.P., Livingstone, D.A., Grice, K., Schouten, S., Sinninghe
Damsté, J.S., 2014. Characterization of the last deglacial transition in tropical East Africa:
Insights from Lake Albert. Palaeogeography, Palaeoclimatology, Palaeoecology 409, 1-8.
Burney, D.A., 1987. Late Quaternary stratigraphic charcoal records from Madagascar. Quaternary
Bush, M.B., Colinvaux, P.A., 1990. A pollen record of a complete glacial cycle from lowland
Panama. Journal of Vegetation Science 1, 105-118.
Chiang, J.C.H., Bitz, C.M., 2005. Influence of high latitude ice cover on the marine Intertropical
Convergence Zone. Climate Dynamics 25, 477-496.
Coetzee, J.A., 1967. Pollen analytical studies in Eastern and Southern Africa. Palaeoecology of
Africa, 1-46.
Colombaroli, D., van der Plas, G., Rucina, S., Verschuren, D., 2016. Determinants of savanna-fire
dynamics in the eastern Lake Victoria catchment (western Kenya) during the last 1200
years. Quaternary International.
Courtney Mustaphi, C.J., Gajewski, K., Marchant, R., Rosqvist, G., 2017. A late Holocene pollen
record from proglacial Oblong Tarn, Mount Kenya. PLOS ONE 12, e0184925.
Denton, G.H., Anderson, R.F., Toggweiler, J.R., Edwards, R.L., Schaefer, J.M., Putnam, A.E.,
2010. The Last Glacial Termination. Science 328, 1652.
Faegri, K., Iversen, J., 1989. Textbook of pollen analysis. The Blackburn Press, Caldwell.
February, E.C., 2000. Archaeological charcoal and dendrochronology to reconstruct past
environments of southern Africa. South African Journal of Science 96, 111-116.
Foerster, V., Junginger, A., Langkamp, O., Gebru, T., Asrat, A., Umer, M., Lamb, H.F., Wennrich,
V., Rethemeyer, J., Nowaczyk, N., Trauth, M.H., Schaebitz, F., 2012. Climatic change
recorded in the sediments of the Chew Bahir basin, southern Ethiopia, during the last
45,000 years. Quaternary International 274, 25-37.
Foerster, V., Vogelsang, R., Junginger, A., Asrat, A., Lamb, H.F., Schaebitz, F., Trauth, M.H.,
2015. Environmental change and human occupation of southern Ethiopia and northern
Garcin, Y., Melnick, D., Strecker, M.R., Olago, D., Tiercelin, J.-J., 2012. East African
mid-Holocene wet–dry transition recorded in palaeo-shorelines of Lake Turkana, northern
Kenya Rift. Earth and Planetary Science Letters 331-332, 322-334.
Gasse, F., 2000. Hydrological changes in the African tropics since the Last Glacial Maximum.
Ivory, S.J., Russell, J., 2016. Climate, herbivory, and fire controls on tropical African forest for
the last 60ka. Quaternary Science Reviews 148, 101-114.
Izumi, K., Lézine, A.M., 2016. Pollen-based biome reconstructions over the past 18,000 years and
atmospheric CO2 impacts on vegetation in equatorial mountains of Africa. Quaternary
Science Reviews 152, 93-103.
Kiage, L.M., Howey, M., Hartter, J., Palace, M., 2017. Paleoenvironmental change in tropical
Africa during the Holocene based on a record from Lake Kifuruka, western Uganda:
PALEOENVIRONMENTAL CHANGE IN TROPICAL AFRICA. Journal of Quaternary
Science 32, 1099-1111.
Kiage, L.M., Liu, K.-b., 2006. Late Quaternary paleoenvironmental changes in East Africa: a
review of multiproxy evidence from palynology, lake sediments, and associated records.
Progress in Physical Geography: Earth and Environment 30, 633-658.
Kiage, L.M., Liu, K.-b., 2009. Palynological evidence of climate change and degradation in the
Lake Baringo area,Kenya,East Africa since AD 1650.
Palaegeography,Palaeoclimatology,Palaeoecology, 60-72.
Liu, X., Rendle-Bühring, R., Kuhlmann, H., Li, A., 2017. Two phases of the Holocene East African
Humid Period: Inferred from a high-resolution geochemical record off Tanzania. Earth and
Marchant, R., Richer, S., Boles, O., Capitani, C., Courtney-Mustaphi, C.J., Lane, P., Prendergast,
M.E., Stump, D., De Cort, G., Kaplan, J.O., Phelps, L., Kay, A., Olago, D., Petek, N.,
Platts, P.J., Punwong, P., Widgren, M., Wynne-Jones, S., Ferro-Vázquez, C., Benard, J.,
Boivin, N., Crowther, A., Cuní-Sanchez, A., Deere, N.J., Ekblom, A., Farmer, J., Finch, J.,
Fuller, D., Gaillard-Lemdahl, M.-J., Gillson, L., Githumbi, E., Kabora, T., Kariuki, R.,
Kinyanjui, R., Kyazike, E., Lang, C., Lejju, J., Morrison, K.D., Muiruri, V., Mumbi, C.,
Muthoni, R., Muzuka, A., Ndiema, E., Kabonyi Nzabandora, C., Onjala, I., Schrijver, A.P.,
Rucina, S., Shoemaker, A., Thornton-Barnett, S., van der Plas, G., Watson, E.E.,
Williamson, D., Wright, D., 2018. Drivers and trajectories of land cover change in East
Africa: Human and environmental interactions from 6000 years ago to present.
Earth-Science Reviews 178, 322-378.
Martinez-Ruiz, F., Kastner, M., Gallego-Torres, D., Rodrigo-Gámiz, M., Nieto-Moreno, V.,
Ortega-Huertas, M., 2015. Paleoclimate and paleoceanography over the past 20,000 yr in
the Mediterranean Sea Basins as indicated by sediment elemental proxies. Quaternary
Science Reviews 107, 25-46.
Mworia Maitima, J., 1991. Vegetation response to climatic change in central Rift Valley, Kenya.
Quaternary Research 35, 234-245.
Novenko, E.Y., Tsyganov, A.N., Olchev, A.V., 2018. Palaeoecological data as a tool to predict
possible future vegetation changes in the boreal forest zone of European Russia: a case
study from the Central Forest Biosphere Reserve. IOP Conference Series: Earth and
Environmental Science 107, 012104.
Oettli, P., Camberlin, P., 2005. Influence of topography on monthly rainfall distribution over East
Quick, L.J., Chase, B.M., Meadows, M.E., Scott, L., Reimer, P.J., 2011. A 19.5kyr vegetation
history from the central Cederberg Mountains, South Africa: Palynological evidence from
rock hyrax middens. Palaeogeography, Palaeoclimatology, Palaeoecology 309, 253-270.
Reotita, J., Siringan, F., Zhang, J., Azanza, R., 2014. Paleoenvironment changes in Juag Lagoon,
Philippines based on sedimentology, bulk geochemistry and stable isotopes and their
implication to nutrification. Quaternary International 333, 110-121.
Rucina, S.M., Muiruri, V.M., Kinyanjui, R.N., McGuiness, K., Marchant, R., 2009. Late
Quaternary vegetation and fire dynamics on Mount Kenya. Palaeogeography,
Palaeoclimatology, Palaeoecology 283, 1-14.
Sánchez Goñi, M.F., Desprat, S., Daniau, A.-L., Bassinot, F.C., Polanco-Martínez, J.M., Harrison,
S.P., Allen, J.R.M., Anderson, R.S., Behling, H., Bonnefille, R., Burjachs, F., Carrión, J.S.,
Cheddadi, R., Clark, J.S., Combourieu-Nebout, N., Courtney-Mustaphi, C.J., Debusk,
G.H., Dupont, L.M., Finch, J.M., Fletcher, W.J., Giardini, M., González, C., Gosling,
W.D., Grigg, L.D., Grimm, E.C., Hayashi, R., Helmens, K., Heusser, L.E., Hill, T., Hope,
G., Huntley, B., Igarashi, Y., Irino, T., Jacobs, B., Jiménez-Moreno, G., Kawai, S.,
Kershaw, P., Kumon, F., Lawson, I.T., Ledru, M.-P., Lézine, A.-M., Liew, P.M., Magri,
D., Marchant, R., Margari, V., Mayle, F.E., McKenzie, M., Moss, P., Müller, S., Müller,
U.C., Naughton, F., Newnham, R.M., Oba, T., Pérez-Obiol, R., Pini, R., Ravazzi, C.,
Roucoux, K.H., Rucina, S.M., Scott, L., Takahara, H., Tzedakis, P.C., Urrego, D.H., van
Geel, B., Valencia, B.G., Vandergoes, M.J., Vincens, A., Whitlock, C.L., Willard, D.A.,
Yamamoto, M., 2017. The ACER pollen and charcoal database: a global resource to
document vegetation and fire response to abrupt climate changes during the last glacial
Santisteban, J.I., Mediavilla, R., López-Pamo, E., Dabrio, C.J., Zapata, M.B.R., García, M.J.G.,
Castaño, S., Martínez-Alfaro, P.E., 2004. Loss on ignition: a qualitative or quantitative
method for organic matter and carbonate mineral content in sediments? Journal of
Paleolimnology 32, 287-299.
Schüler, L., Hemp, A., Zech, W., Behling, H., 2012. Vegetation, climate and fire-dynamics in East
Africa inferred from the Maundi crater pollen record from Mt Kilimanjaro during the last
glacial–interglacial cycle. Quaternary Science Reviews 39, 1-13.
Stuiver, M., Reimer, P., F. Braziunas, T., 2006. High precision radiocarbon age calibration for
terrestial and marine samples.
Stuiver, M., Reimer, P.J., Braziunas, T.F., 1998. High-Precision Radiocarbon Age Calibration for
Terrestrial and Marine Samples. Radiocarbon 40, 1127-1151.
Tian, F., Cao, X., Dallmeyer, A., Zhao, Y., Ni, J., Herzschuh, U., 2017. Pollen-climate
relationships in time (9 ka, 6 ka, 0 ka) and space (upland vs. lowland) in eastern continental
Asia. Quaternary Science Reviews 156, 1-11.
Tierney, J.E., Russell, J.M., Sinninghe Damsté, J.S., Huang, Y., Verschuren, D., 2011. Late
Quaternary behavior of the East African monsoon and the importance of the Congo Air
Boundary. Quaternary Science Reviews 30, 798-807.
Wright, D.K., 2017. Humans as Agents in the Termination of the African Humid Period. Frontiers
in Earth Science 5.
Zielhofer, C., von Suchodoletz, H., Fletcher, W.J., Schneider, B., Dietze, E., Schlegel, M.,
Schepanski, K., Weninger, B., Mischke, S., Mikdad, A., 2017. Millennial-scale
fluctuations in Saharan dust supply across the decline of the African Humid Period.