U P D A T E
Open Access
Coping with Persistent Pain, Effectiveness Research
into Self-management (COPERS): statistical analysis
plan for a randomised controlled trial
Brennan C Kahan
1*, Karla Diaz-Ordaz
2, Kate Homer
3, Dawn Carnes
3, Martin Underwood
4, Stephanie JC Taylor
3,
Stephen A Bremner
1and Sandra Eldridge
1Abstract
Background:The Coping with Persistent Pain, Effectiveness Research into Self-management (COPERS) trial assessed whether a group-based self-management course is effective in reducing pain-related disability in participants with chronic musculoskeletal pain. This article describes the statistical analysis plan for the COPERS trial.
Methods and design:COPERS was a pragmatic, multicentre, unmasked, parallel group, randomised controlled trial. This article describes (a) the overall analysis principles (including which participants will be included in each analysis, how results will be presented, which covariates will be adjusted for, and how we will account for clustering in the intervention group); (b) the primary and secondary outcomes, and how each outcome will be analysed; (c) sensitivity analyses; (d) subgroup analyses; and (e) adherence-adjusted analyses.
Trial registration:ISRCTN24426731
Keywords:Statistical analysis plan, Randomised controlled trial, Self-management, Chronic musculoskeletal pain, Complex intervention
Update
Background
COPERS (Coping with Persistent Pain, Effectiveness Research into Self-management) was a pragmatic, multi-centre, unmasked, parallel group, randomised controlled trial [1]. The protocol for the COPERS trial has been published previously [1] and gives details on the rational for the trial, the intervention and control groups, the inclusion/exclusion criteria, and the sample size calcula-tion. Briefly, the main aim of the COPERS trial was to assess whether a group-based learning course was effect-ive in reducing pain-related disability in participants with chronic musculoskeletal pain [2]. The intervention was a 3-day training course. Course content is shown in Table 1, and the schedule of assessments is shown in Figure 1. The intervention was compared with usual care plus a relaxation CD and pain education leaflet. In this
article, we describe the statistical analysis plan, which outlines how data analysis for the COPERS trial will be performed.
The statistical analysis plan was finalised and approved on 3 October 2013. All trial investigators were blinded to patient outcomes broken down by treatment group until after the analysis plan was signed off and the database was locked. Participant recruitment began in August 2011 and finished in July 2012 (participant follow-up was completed in August 2013). The trial database was locked after the statistical analysis plan was approved. Data analysis did not begin until after the analysis plan was approved, and after the database was locked.
The original sample size calculation called for 685 par-ticipants (391 in the intervention group and 294 in the control group, to be randomised in a 4:3 ratio). However, we required a sufficient number of participants in each group-based learning course to make the intervention viable; therefore, we continued recruitment until there was an adequate number of participants for each course. This led to 703 participants (403 intervention, 300 control). * Correspondence:[email protected]
1
Pragmatic Clinical Trials Unit, Queen Mary University of London, 58 Turner St, London E1 2AB, UK
Full list of author information is available at the end of the article
Ethics approval was granted by Cambridgeshire Ethics 11/EE/04. All patients provided written informed consent prior to randomisation.
Outcomes
Primary outcome
The primary outcome was the pain-related disability score (which is a subscale of the Chronic Pain Grade question-naire (CPG disability) [3]) at 12 months post-randomisation. The three questions in this subscale assess the extent to which the participant’s pain has, in the previous 6 months: (i) interfered with their ability to perform their daily activ-ities; (ii) changed their ability to take part in recreational, social, and family activities; and (iii) changed their ability to work. Each of the three questions is rated on a scale of 0 to 10, with 0 reflecting no change or interference, and 10 reflecting extreme change or interference.
The primary outcome is the mean of these three ques-tions, multiplied by 10; that is, if X1,X2, and X3 repre-sent the three questions, and Y reprerepre-sents the primary outcome, then:
Y¼10ðX1þX2þX3Þ=3
The primary outcome is therefore recorded on a scale from 0 to 100, with higher scores reflecting larger inter-ference or change in the participant’s ability to perform
daily activities, work, or take part in recreational, social, and family activities.
Secondary outcomes
The secondary outcomes are:
1. CPG disability at 6 months post-randomisation [3] 2. CPG pain intensity score at 6 and 12 months
post-randomisation [3]
3. Pain Self-Efficacy Questionnaire (PSEQ) score at 6 and 12 months post-randomisation [4]
4. Hospital Anxiety and Depression Scale (HADS) Anxiety score at 6 and 12 months post-randomisation [5] 5. Hospital Anxiety and Depression Scale (HADS)
Depression score at 6 and 12 months post-randomisation [5]
6. Chronic Pain Acceptance Questionnaire (CPAQ) score at 6 and 12 months post-randomisation [6] 7. Health Education Impact Questionnaire (HEIQ)
Social integration score at 6 and 12 months post-randomisation [7]
8. EQ-5D at 6 and 12 months post-randomisation [8] 9. Census global health question at 6 and 12 months
post-randomisation [9]
10. Total Defined Daily Doses (Total DDD) of psychotropic drugs consumed up to 12 months post-randomisation
11. Total DDD of analgesics (including all opioids and other central nervous system drugs) consumed for pain up to 12 months post-randomisation
12. Total DDD of weak opioids consumed up to 12 months post-randomisation
13. Total DDD of strong opioids consumed up to 12 months post-randomisation
14. Proportion of participants using weak opioids at 12 months post-randomisation (defined as having received a prescription for a weak opioid up to twelve weeks before the 12-month follow-up date) 15. Proportion of participants using strong opioids at 12 months post-randomisation (defined as having received a prescription for a strong opioid up to twelve weeks before the 12-month follow-up date)
A guide to how outcomes are derived is available in Additional file 1.
Analysis principles
General analysis principles
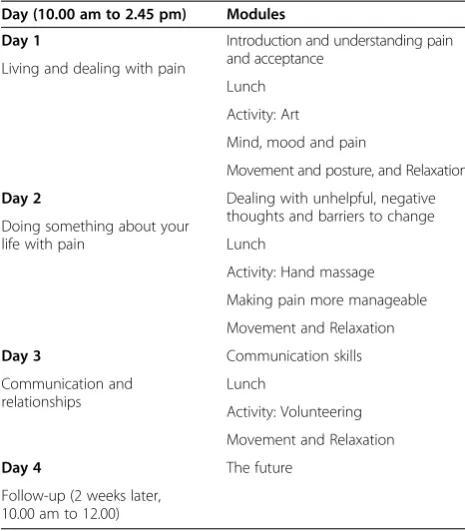
[image:2.595.56.289.122.388.2]The main analysis for each outcome will use intention-to-treat (ITT) principles, meaning that all participants with a recorded outcome will be included in the analysis, and will be analysed according to the treatment group to which they were randomised [10]. More information on which participants will be included in each analysis is Table 1 The Coping with Persistent Pain, Effectiveness
Research into Self-management (COPERS) course content overview
Day (10.00 am to 2.45 pm) Modules
Day 1 Introduction and understanding pain and acceptance
Living and dealing with pain
Lunch
Activity: Art
Mind, mood and pain
Movement and posture, and Relaxation
Day 2 Dealing with unhelpful, negative thoughts and barriers to change Doing something about your
life with pain Lunch
Activity: Hand massage
Making pain more manageable
Movement and Relaxation
Day 3 Communication skills
Communication and relationships
Lunch
Activity: Volunteering
Movement and Relaxation
Day 4 The future
available in later sections. AllP values will be two sided, and the significance level is set at 5%.
Analyses for all outcomes will be presented as:
1. The number of participants included in the analysis, by treatment group;
2. A summary measure of the outcome, by treatment group (for example, mean (SD) for continuous outcomes, number (%) for binary outcomes). Only participants with a completely recorded outcome will be used to calculate the summary measure (for example, participants who complete only one of three components of the CPG disability score will not be included in the calculation of the summary measure, although they will be included in estimated the treatment through the use of multiple
imputation - see later sections);
3. A treatment effect, with a 95% confidence interval; 4. A two-sidedPvalue.
All analyses will account for clustering by course in the intervention group. This is because when the inter-vention is delivered in clusters (for example, in a group setting, or when the same therapist treats multiple
patients) it is necessary to account for the clustering in the analysis to avoid increasing the type I error rate [11-13]. Participants in the control group (who do not attend courses), will act as their own cluster (that is, each participant in the control group will belong to a
‘course’where they are the only member).
Site of recruitment (London or Midlands) [14-17], age, gender, and the HADS depression score at baseline will be included as covariates in each analysis [17-20]. Add-itionally, for continuous outcomes (CPG disability, CPG pain intensity, PSEQ, HADS Anxiety, HADS Depression, CPAQ, HEIQ, and EQ-5D), the outcome measured at base-line will be included in the analysis [19]. Site of recruitment will be adjusted for because it was used as a stratification factor in the randomisation process, and therefore, it is ne-cessary to include it in the analysis to maintain correct type I error rates [11,14-16]. The other covariates will be in-cluded in the analysis because adjustment for prognostic factors can substantially increase power [17-21].
Continuous covariates (age, HADS depression score, outcome measured at baseline) will be analysed using a linear relationship with the outcome, as categorising continuous covariates has been shown to lead to poor performance in other scenarios [22]. We made the decision
Baseline questionnaire*
Demographics, CPG, HADS, EQ-5D, PSEQ, CPAQ, HEIQ (Social integration), Global health Question.
Randomisation to:
Intervention: COPERS course plus usual care or
Control: usual care, self guided relaxation and pain education leaflet
12 weeks questionnaire*
PSEQ: self-efficacy
6 month follow-up questionnaire*
CPG, HADS, EQ-5D, PSEQ, CPAQ, HEIQ (Social integration), Global health Question, non-NHS health care resource use
12 month follow-up questionnaire*
[image:3.595.57.538.89.388.2]CPG, HADS, EQ-5D, PSEQ, CPAQ, HEIQ (Social integration), Global health Question, non-NHS health care resource use
to assume a linear relationship prior to examining the ob-served association between covariate and outcome in the trial data, as previous research has shown that choosing the analysis method based on study data can lead to biased treatment effect estimates and incorrect type I error rates in some scenarios [23-27].
Analysis of primary outcome
The primary outcome (CPG disability at 12 months) will be analysed using a mixed-effects linear regression model, with a‘group-based learning course’as a random effect. Restricted maximum likelihood (REML) will be used. The model will include site of recruitment, age, gender, HADS depression score, and CPG disability at baseline as covariates.
All participants who completed at least one of the three questions that form the CPG disability score at either 6 or 12 months will be included in the analysis. Participants who did not fill out any portion of the CPG disability score at both 6 or 12 months will be excluded from the analysis.
Multiple imputation (MI) [28] will be used to account for participants who have an observed outcome at 6 months, but are missing the outcome at 12 months, as well as for participants who completed some, but not all, of the questions on the CPG disability score at 12 months. A total of 20 imputations will be performed, and results will be combined using Rubin’s Rules [28]. Only participants included in the analysis will be in-cluded in the imputation model. The imputation model will include the three questions that form the CPG dis-ability score at baseline, 6 months, and 12 months, as well as the site of recruitment, age, gender, the HADS depression score at baseline, and employment status (employed or in full-time education versus not employed or in full-time education) (14 variables in total). We chose to include these variables in the imputation model because they will be included in the analysis model (CPG disability score at baseline, 6 months, and 12 months, site of recruitment, age, gender, and HADS depression score at baseline) or because we felt they may be predictive of missingness (employed or in full-time education versus not employed or in full-full-time education). Imputation will be performed separately within each treatment group [29]. In the intervention group, multilevel imputation will be performed, with
‘course’ included in the imputation model as a random
effect [30,31].
Missing data in any of the covariates to be adjusted for in the analysis (site of recruitment, age, gender, HADS depression score, CPG disability and baseline) will be accounted for at the same time as missing data in the CPG disability score at 6 or 12 months, as these vari-ables will be included in the same imputation model.
Sensitivity analyses for primary outcome
Method of accounting for missing data
We will perform three sensitivity analyses for the pri-mary outcome to assess the robustness of the results to other methods of account for missing data [32]. The first sensitivity analysis involves specifying a different imput-ation model than that used in the primary analysis, and the last two sensitivity analyses involve the re-analysis of the primary outcome using two approaches which are not based on MI.
The sensitivity analyses are:
1. We will determine which baseline covariates are associated with loss to follow-up and include them in the imputation model. The analysis model will be the same as that for the primary analysis, except for the inclusion of additional covariates (that is, those that we determined were associated with loss to follow-up) in the imputation model.
2. We will perform a complete case analysis, where all participants who did not complete all
components of the CPG disability score at 12 months will be excluded from the analysis. The analysis model will be the same as that for the primary analysis, except missing baseline
covariates will be replaced using mean imputation. We used mean imputation as it has been shown to give unbiased estimates and standard errors for the treatment effect in randomised trials, and will suffer only a small loss in efficiency when the amount of missing data is small [33].
3. We will analyse the three components that form the CPG disability score at 12 months, rather than the overall CPG disability score. This will be done by performing a multivariate analysis, where each of the three components from the 12-month score are included in the model as outcomes (that is, each participant will have three outcomes). A three-level mixed-effects model will be used, with random effects for‘course’and for participant. Treatment-by-question interactions will be included, allowing the treatment effect to vary for each of the three components. An overall treatment effect for CPG disability at 12 months will be estimated using the lincomfunction in Stata (StataCorp, College Station, TX, USA) to combine the treatment estimates from the three separate components. As above, missing baseline covariates will be replaced using mean imputation.
Participants with no completed follow-ups
were missing-at-random (that is, they were missing based on the covariates included in the analysis model). To assess the robustness to departures from this assumption, the primary outcome will be assessed under a range of missing-not-at-random scenarios. This will be done using the formula
Δ¼ΔprimaryþY1P1−Y2P2
where Δ is the treatment effect under the
missing-not-at-random scenario,Δprimaryis the treatment effect from
the primary analysis, Y1 and Y2 are the assumed mean
responses for participants with missing data in treatment groups 1 and 2 respectively, and P1and P2are the pro-portion of participants who were excluded from the ana-lysis in groups 1 and 2, respectively. The standard error forΔis assumed to be approximately equal to the stand-ard error for Δprimary. Y2will be varied between 10, 25, 50, 75, and 90, and for each value of Y2, Y1will be set to Y2- 10, Y2, and Y2+ 10. For example, for Y2= 25, Y1will vary between 15, 25, and 35.
Re-definition of primary endpoint
The primary outcome is a composite of three questions. The first question (Q1) assesses to what extent the participant’s pain has interfered with daily activities in the previous 6 months. This is assessed on a scale of 0 to 10, with higher scores indicating more interfer-ence. The last two questions assess to what extent the participant’s pain has changed their ability to (a) take part in recreational, social, and family activities (Q2); and (b) work (Q3). Both these questions are measured on a scale from 0 to 10, with higher scores indicating more extreme change.
For the last two questions, higher change scores are
meant to represent a higher negativechange. However,
it is possible that some participants have misinter-preted this, and have recorded a high score to indicate a large positive change. We will therefore perform a sensitivity analysis by redefining the outcome for par-ticipants whose scores indicate they may have misin-terpreted the intended direction of the questions relating to change.
For participants with a score of 2 or less for Q1 (indicating very little interference in daily activities)and
a score of 8 or higher on either Q2 or Q3 (intending to indicate an extreme negative change in their ability to take part in social activities or to work), we will assume the participant has misinterpreted the intended direction of the scale for Q2 or Q3 (as it is inconsistent for the pain to have had very little interference in daily activities, and for there to have been an extreme negative change in the participant’s ability to take part in activities or work). We will therefore rescore Q2 or Q3 based on a reverse scale
(that is, a score of 10 will be rescored as 0, 9 will be rescored as 1, and 8 will be rescored as 2). We will then re-analyse the outcome using the same method as for the main analysis.
Subgroup analyses
Subgroup analyses will be performed for the primary outcome (CPG disability at 12 months). All subgroup analyses will be performed using the same analysis model as for the primary outcome, but will also include the subgroup of interest and a treatment-by-subgroup interaction. Interaction tests will be considered signifi-cant at the 5% level. No correction will be made for mul-tiple tests.
The following subgroups will be assessed:
Non-pain:
Comorbidity (number of body systems affected):≤3 versus >3 comorbidities (with chronic
musculoskeletal pain counting as a comorbidity) Living arrangements: living alone versus living with
others
Baseline self-efficacy: PSEQ score 0 to 20 (not likely to be confident) versus 21 to 39 (more likely to be confident and to self manage) versus≥40 (confident) Socioeconomic status (SES) (based on the Index of
Multiple Deprivation 2010, calculated from participant postcodes via Geographical Information Systems (GIS): lower social class (less than observed median in data) versus higher social class (equal or greater than observed median in data)
Pain-related:
Pain duration: 0 to 12 months versus 13 months to 4 years versus 5 or more years
Baseline pain intensity: CPG intensity score 0 to 3 (low) versus 4 to 7 (medium) versus 8 to 10 (high) Baseline pain-related disability: CPG disability score
0 to 3 (low) versus 4 to 7 (medium) versus 8 to 10 (high)
Baseline depression: HADS depression score <11 versus≥11
Analysis of secondary outcomes
CPG disability at 6 months
This outcome will be analysed using the same methods as CPG disability at 12 months.
CPG pain intensity, HADS Anxiety, HADS Depression, and HEIQ at 6 and 12 months
PSEQ at 6 and 12 months
These outcomes will be analysed using the same methods as CPG disability at 6 and 12 months, except the individual components of the PSEQ score at 12 weeks will also be in-cluded in the imputation model (in addition to the PSEQ score at baseline, 6, and 12 months).
CPAQ at 6 and 12 months
These outcomes will be analysed using the same methods as CPG disability at 6 and 12 months, with the exception of how CPAQ at baseline is included in the MI model. We will include the individual questions for CPAQ at 6 and 12 months in the imputation model, and include the overall CPAQ score at baseline For partici-pants who are missing CPAQ at baseline, we will use mean imputation [33]. We chose this approach because CPAQ is a composite of 20 questions including each of these questions at each time point in the imputation model would lead to 60 variables being included (20 questions at baseline, 20 at 6 months, and 20 at 12 months), which may cause problems [34]. Including the overall CPAQ score at baseline rather than the 20 indi-vidual questions would reduce the number of variables from 60 to 41.
EQ-5D at 6 and 12 months
These outcomes will be analysed using the same analysis model as the primary outcome (that is, a mixed-effects linear regression model, with course as a random effect, adjusted for site of recruitment, age, gender, HADS de-pression score, and EQ-5D at baseline).
All participants who fully complete the EQ-5D score at either 6 or 12 months will be included in the analysis.
MI will be used to account for participants who are missing the outcome at either 6 or 12 months. The MI strategy will be the same as that for the primary and other secondary outcomes, except instead of imputing the individual components of the EQ-5D score, we will impute the whole score.
Census global health question at 6 and 12 months
These outcomes will be analysed using a mixed-effects ordered logistic regression model, with‘course’as a ran-dom effect. Site of recruitment, age, gender, HADS de-pression score, and the outcome at baseline will be included as fixed covariates.
All participants who completed the Census global health question score at either 6 or 12 months will be included in the analysis.
MI will be used to account for participants who are missing the outcome at either 6 or 12 months. The MI strategy will be the same as that for the primary and other secondary outcomes, except we will impute the whole score (as there are no individual components).
Total DDDs up to 12 months post-randomisation for psychotropic drugs, drugs for pain, weak opioids, and strong opioids
These outcomes will be analysed using a mixed-effects linear regression model, with‘course’as a random effect. Restricted maximum likelihood (REML) will be used. The model will include site of recruitment, age, gender, HADS depression score, and Total DDD in 3 months before randomisation at baseline as covariates. All par-ticipants who have data on Total DDD up to 12 months post-randomisation will be included in the analysis. In order to include participants with missing covariates in the analysis, mean imputation will be used to account for missing baseline covariates [33].
Proportion of participants using weak opioids and strong opioids at 12 months post-randomisation
These outcomes will be analysed using a mixed-effects logistic regression model, with ‘course’ as a random ef-fect. The model will include site of recruitment, age, gender, HADS depression score, and weak or strong (depending on outcome) opioid use at baseline (defined as a prescription for weak or strong) opioids in the 12 weeks before randomization) as covariates. All partici-pants who have data on whether they had had a weak/ strong opioid prescription at 12 months will be included in the analysis. Mean imputation will be used to account for missing baseline covariates [33].
Adherence-adjusted analysis
As a secondary analysis, CPG disability, CPG pain inten-sity, PSEQ, HADS anxiety, HADS depression, CPAQ, HEIQ, and EQ-5D, all at 12 months will be re-analysed to obtain a complier average causal effect of treatment (CACE) [35,36]. This is because while ITT will give an unbiased estimate of the effect of assigning treatment, it may underestimate the effect of actually receiving the treatment. An analysis using CACE will lead to an un-biased estimate of receiving treatment.
We define‘compliers’ as those who attend more than
half of the course (that is, those present for at least 12 of the 24 course components). The compliers can only be observed in the intervention group, where an indi-cator variable will indentify whether the individual complied. The compliers’class is unobserved in the control group.
imputed datasets as the primary analysis. The assump-tions used for this analysis, as well as other adherence-adjusted analyses to be performed, are listed in the online appendix.
Additional file
Additional file 1:Methods used to calculate derived variables, and more information on how adherence-adjusted analyses will be performed.
Abbreviations
CACE:complier average causal effect; COPERS: The Coping with Persistent Pain, Effectiveness Research into Self-management Trial; CPAQ: Chronic Pain Acceptance Questionnaire; CPG: Chronic Pain Grade; GIS: Geographical Information Systems; HADS: Hospital Anxiety and Depression Scale; HEIQ: Health Education Impact Questionnaire; ITT: intention-to-treat; MI: multiple imputation; PSEQ: Pain Self-efficacy Questionnaire; REML: restricted maximum likelihood; SD: standard deviation; SES: socioeconomic status; Total DDD: total defined daily doses.
Competing interests
The authors declare that they have no competing interests.
Authors’contributions
BCK, KDO, KH, DC, MU, SJCT, and SE drafted and finalised the statistical analysis plan. SB and SE wrote the statistical analysis sections in the trial protocol. SJCT was the chief investigator for this trial; MU and SE contributed to the design. All authors read and approved the manuscript for publication.
Acknowledgements
We would like to thank Dr Obioha Ukoumunne for helpful comments on the statistical analysis plan, and a reviewer whose comments helped to improve clarity of the manuscript. This paper presents independent research funded by the National Institute for Health Research (NIHR) under its Programme Grants for Applied Research scheme (RP-PG-0707-10189). The views expressed in this publication are those of the authors and not necessarily those of the NHS, the NIHR or the Department of Health.
Author details 1
Pragmatic Clinical Trials Unit, Queen Mary University of London, 58 Turner St, London E1 2AB, UK.2Department of Health Services Research and Policy, London School of Hygiene and Tropical Medicine, 15-17 Tavistock Place, London WC1H 9SH, UK.3Translational Research Unit, Centre for Primary Care and Public Health, Blizard Institute, Barts and The London School of Medicine and Dentistry, Queen Mary University of London 58 Turner St, London E1 2AB, UK.4Warwick Clinical Trials Unit, Warwick Medical School, Gibbett Hill Road, Coventry CV4 7AL, England.
Received: 26 November 2013 Accepted: 3 February 2014 Published: 15 February 2014
References
1. Carnes D, Taylor SJ, Homer K, Eldridge S, Bremner S, Pincus T, Rahman A, Underwood M:Effectiveness and cost-effectiveness of a novel, group self-management course for adults with chronic musculoskeletal pain: study protocol for a multicentre, randomised controlled trial (COPERS).
BMJ Open2013,3:e002492.
2. Carnes D, Homer K, Underwood M, Pincus T, Rahman A, Taylor SJ:Pain management for chronic musculoskeletal conditions: the development of an evidence-based and theory-informed pain self-management course.BMJ Open2013,3:e003534.
3. Von Korff M, Ormel J, Keefe FJ, Dworkin SF:Grading the severity of chronic pain.Pain1992,50:133–149.
4. Nicholas MK:The pain self-efficacy questionnaire: taking pain into account.Eur J Pain2007,11:153–163.
5. Zigmond AS, Snaith RP:The hospital anxiety and depression scale.Acta Psychiatr Scand1983,67:361–370.
6. McCracken LM, Vowles KE, Eccleston C:Acceptance of chronic pain: component analysis and a revised assessment method.Pain2004, 107:159–166.
7. Osborne RH, Elsworth GR, Whitfield K:The Health Education Impact Questionnaire (heiQ): an outcomes and evaluation measure for patient education and self-management interventions for people with chronic conditions.Patient Educ Couns2007,66:192–201.
8. Group E:The EuroQol instrumnet: EQ-5D 1990.http://www.euroqol.org/eq-5d. 9. Statistics OfN:Census 2011.2011. http://www.ons.gov.uk/census/2011-census. 10. White IR, Horton NJ, Carpenter J, Pocock SJ:Strategy for intention to treat
analysis in randomised trials with missing outcome data.BMJ2011, 342:d40.
11. Kahan BC, Morris TP:Assessing potential sources of clustering in individually randomised trials.BMC Med Res Methodol2013,13:58. 12. Andridge RR, Shoben AB, Muller KE, Murray DM:Analytic methods for
individually randomized group treatment trials and group-randomized trials when subjects belong to multiple groups.Stat Med2014. doi: 10.1002/sim.6083.
13. Pals SL, Murray DM, Alfano CM, Shadish WR, Hannan PJ, Baker WL: Individually randomized group treatment trials: a critical appraisal of frequently used design and analytic approaches.Am J Public Health2008, 98:1418–1424.
14. Kahan BC, Morris TP:Reporting and analysis of trials using stratified randomisation in leading medical journals: review and reanalysis.BMJ
2012,345:e5840.
15. Kahan BC, Morris TP:Improper analysis of trials randomised using stratified blocks or minimisation.Stat Med2012,31:328–340. 16. Kahan BC, Morris TP:Analysis of multicentre trials with continuous
outcomes: when and how should we account for centre effects?Stat Med2013,32:1136–1149.
17. Kahan BC:Accounting for centre-effects in multicentre trials with a binary outcome - when, why, and how?BMC Med Res Methodol2014, 14:20. doi:10.1186/1471-2288-14-20.
18. Hernandez AV, Steyerberg EW, Habbema JD:Covariate adjustment in randomized controlled trials with dichotomous outcomes increases statistical power and reduces sample size requirements.J Clin Epidemiol
2004,57:454–460.
19. Pocock SJ, Assmann SE, Enos LE, Kasten LE:Subgroup analysis, covariate adjustment and baseline comparisons in clinical trial reporting: current practice and problems.Stat Med2002,21:2917–2930.
20. Turner EL, Perel P, Clayton T, Edwards P, Hernandez AV, Roberts I,et al: Covariate adjustment increased power in randomized controlled trials: an example in traumatic brain injury.J Clin Epidemiol2012,65:474–481. 21. Kahan BC, Morris TP:Adjusting for multiple prognostic factors in the
analysis of randomised trials.BMC Med Res Methodol2013,13:99. 22. Royston P, Altman DG, Sauerbrei W:Dichotomizing continuous predictors
in multiple regression: a bad idea.Stat Med2006,25:127–141. 23. Campbell H, Dean CB:The consequences of proportional hazards based
model selection.Stat Med2013. 10.1002/sim.6083.
24. Freeman PR:The performance of the two-stage analysis of two-treatment, two-period crossover trials.Stat Med1989,8:1421–1432.
25. Kahan BC:Bias in randomised factorial trials.Stat Med2013,32:4540–4549. 26. Raab GM, Day S, Sales J:How to select covariates to include in the
analysis of a clinical trial.Control Clin Trials2000,21:330–342. 27. Shuster JJ:Diagnostics for assumptions in moderate to large simple
clinical trials: do they really help?Stat Med2005,24:2431–2438. 28. Rubin DB:Multiple Imputation for Nonresponse in Surveys.New York: John
Wiley and Sons; 1987.
29. White IR, Royston P, Wood AM:Multiple imputation using chained equations: Issues and guidance for practice.Stat Med2011, 30:377–399.
30. Carpenter JR, Goldstein H, Kenward MG:REALCOM-IMPUTE software for multilevel multiple imputation with mixed response types.J Stat Softw
2011,45(5) [epub].
31. Andridge RR:Quantifying the impact of fixed effects modeling of clusters in multiple imputation for cluster randomized trials.Biom J
2011,53:57–74.
32. Morris TP, Kahan BC, White IR:Choosing sensitivity analyses for randomised trials: principles.BMC Med Res Methodol2014,14:11. 33. White IR, Thompson SG:Adjusting for partially missing baseline
34. Hardt J, Herke M, Leonhart R:Auxiliary variables in multiple imputation in regression with missing X: a warning against including too many in small sample research.BMC Med Res Methodol2012,12:184. 35. Emsley R, Dunn G, White IR:Mediation and moderation of treatment
effects in randomised controlled trials of complex interventions.Stat Methods Med Res2010,19:237–270.
36. Sussman JB, Hayward RA:An IV for the RCT: using instrumental variables to adjust for treatment contamination in randomised controlled trials.
BMJ2010,340:c2073.
doi:10.1186/1745-6215-15-59
Cite this article as:Kahanet al.:Coping with Persistent Pain, Effectiveness Research into Self-management (COPERS): statistical analysis plan for a randomised controlled trial.Trials201415:59.
Submit your next manuscript to BioMed Central and take full advantage of:
• Convenient online submission
• Thorough peer review
• No space constraints or color figure charges
• Immediate publication on acceptance
• Inclusion in PubMed, CAS, Scopus and Google Scholar
• Research which is freely available for redistribution
![Figure 1 Schedule of assessment. CPG, Chronic Pain Grade (Von Korff [3]); HADS, Hospital Anxiety and Depression Scale (Zigmond and Snaith[5]); EQ-5D, Quality of life (EuroQol.org); PSEQ, Pain Self-Efficacy Questionnaire (Nicholas 1989, [4]); CPAQ, Chronic Pain Acceptance Questionnaire(McCracken [6]); HEIQ, Social integration [7]; Census global health question (ons.gov.uk/census/2011-census).](https://thumb-us.123doks.com/thumbv2/123dok_us/9019732.972512/3.595.57.538.89.388/schedule-assessment-depression-questionnaire-acceptance-questionnaire-mccracken-integration.webp)
